
KOSPI Drops 10% as Crowded AI Trade Unwinds Across Global Markets
1 hr ago

Two macro forces that rarely move in sync are converging this week, and the interaction between them is what makes the next five trading days potentially decisive for rate expectations. US-Iran peace diplomacy, formalised in a 14-point memorandum of understanding signed over the weekend, is pushing oil lower at precisely the moment the Federal Reserve’s preferred inflation gauge is scheduled to print. The MOU, signed following talks in Switzerland on Sunday, 22 June 2026, removes near-term military risk around the Strait of Hormuz and opens the door to resumed Iranian oil exports. Simultaneously, the US economic calendar for the week of 23 June carries the May PCE price index, a revised Q1 GDP figure, and June PMI readings. Oil falling into a PCE release is not a neutral event. It changes the data, the Fed’s interpretive options, and potentially the trajectory of equity and fixed income markets. Here is what both forces mean for how you should read the week’s data, what scenarios to watch for, and which parts of your portfolio are most exposed to each outcome.
Oil prices declined toward pre-conflict levels following the diplomatic breakthrough, and the scale of the move tells you the market is treating this as a genuine reduction in supply-disruption risk, not just a headline.
Oil approached pre-conflict levels following the MOU’s release, reflecting the removal of the most acute geopolitical risk premium crude has carried in months.
The reason sits in the MOU’s specific provisions. The most market-relevant terms include:
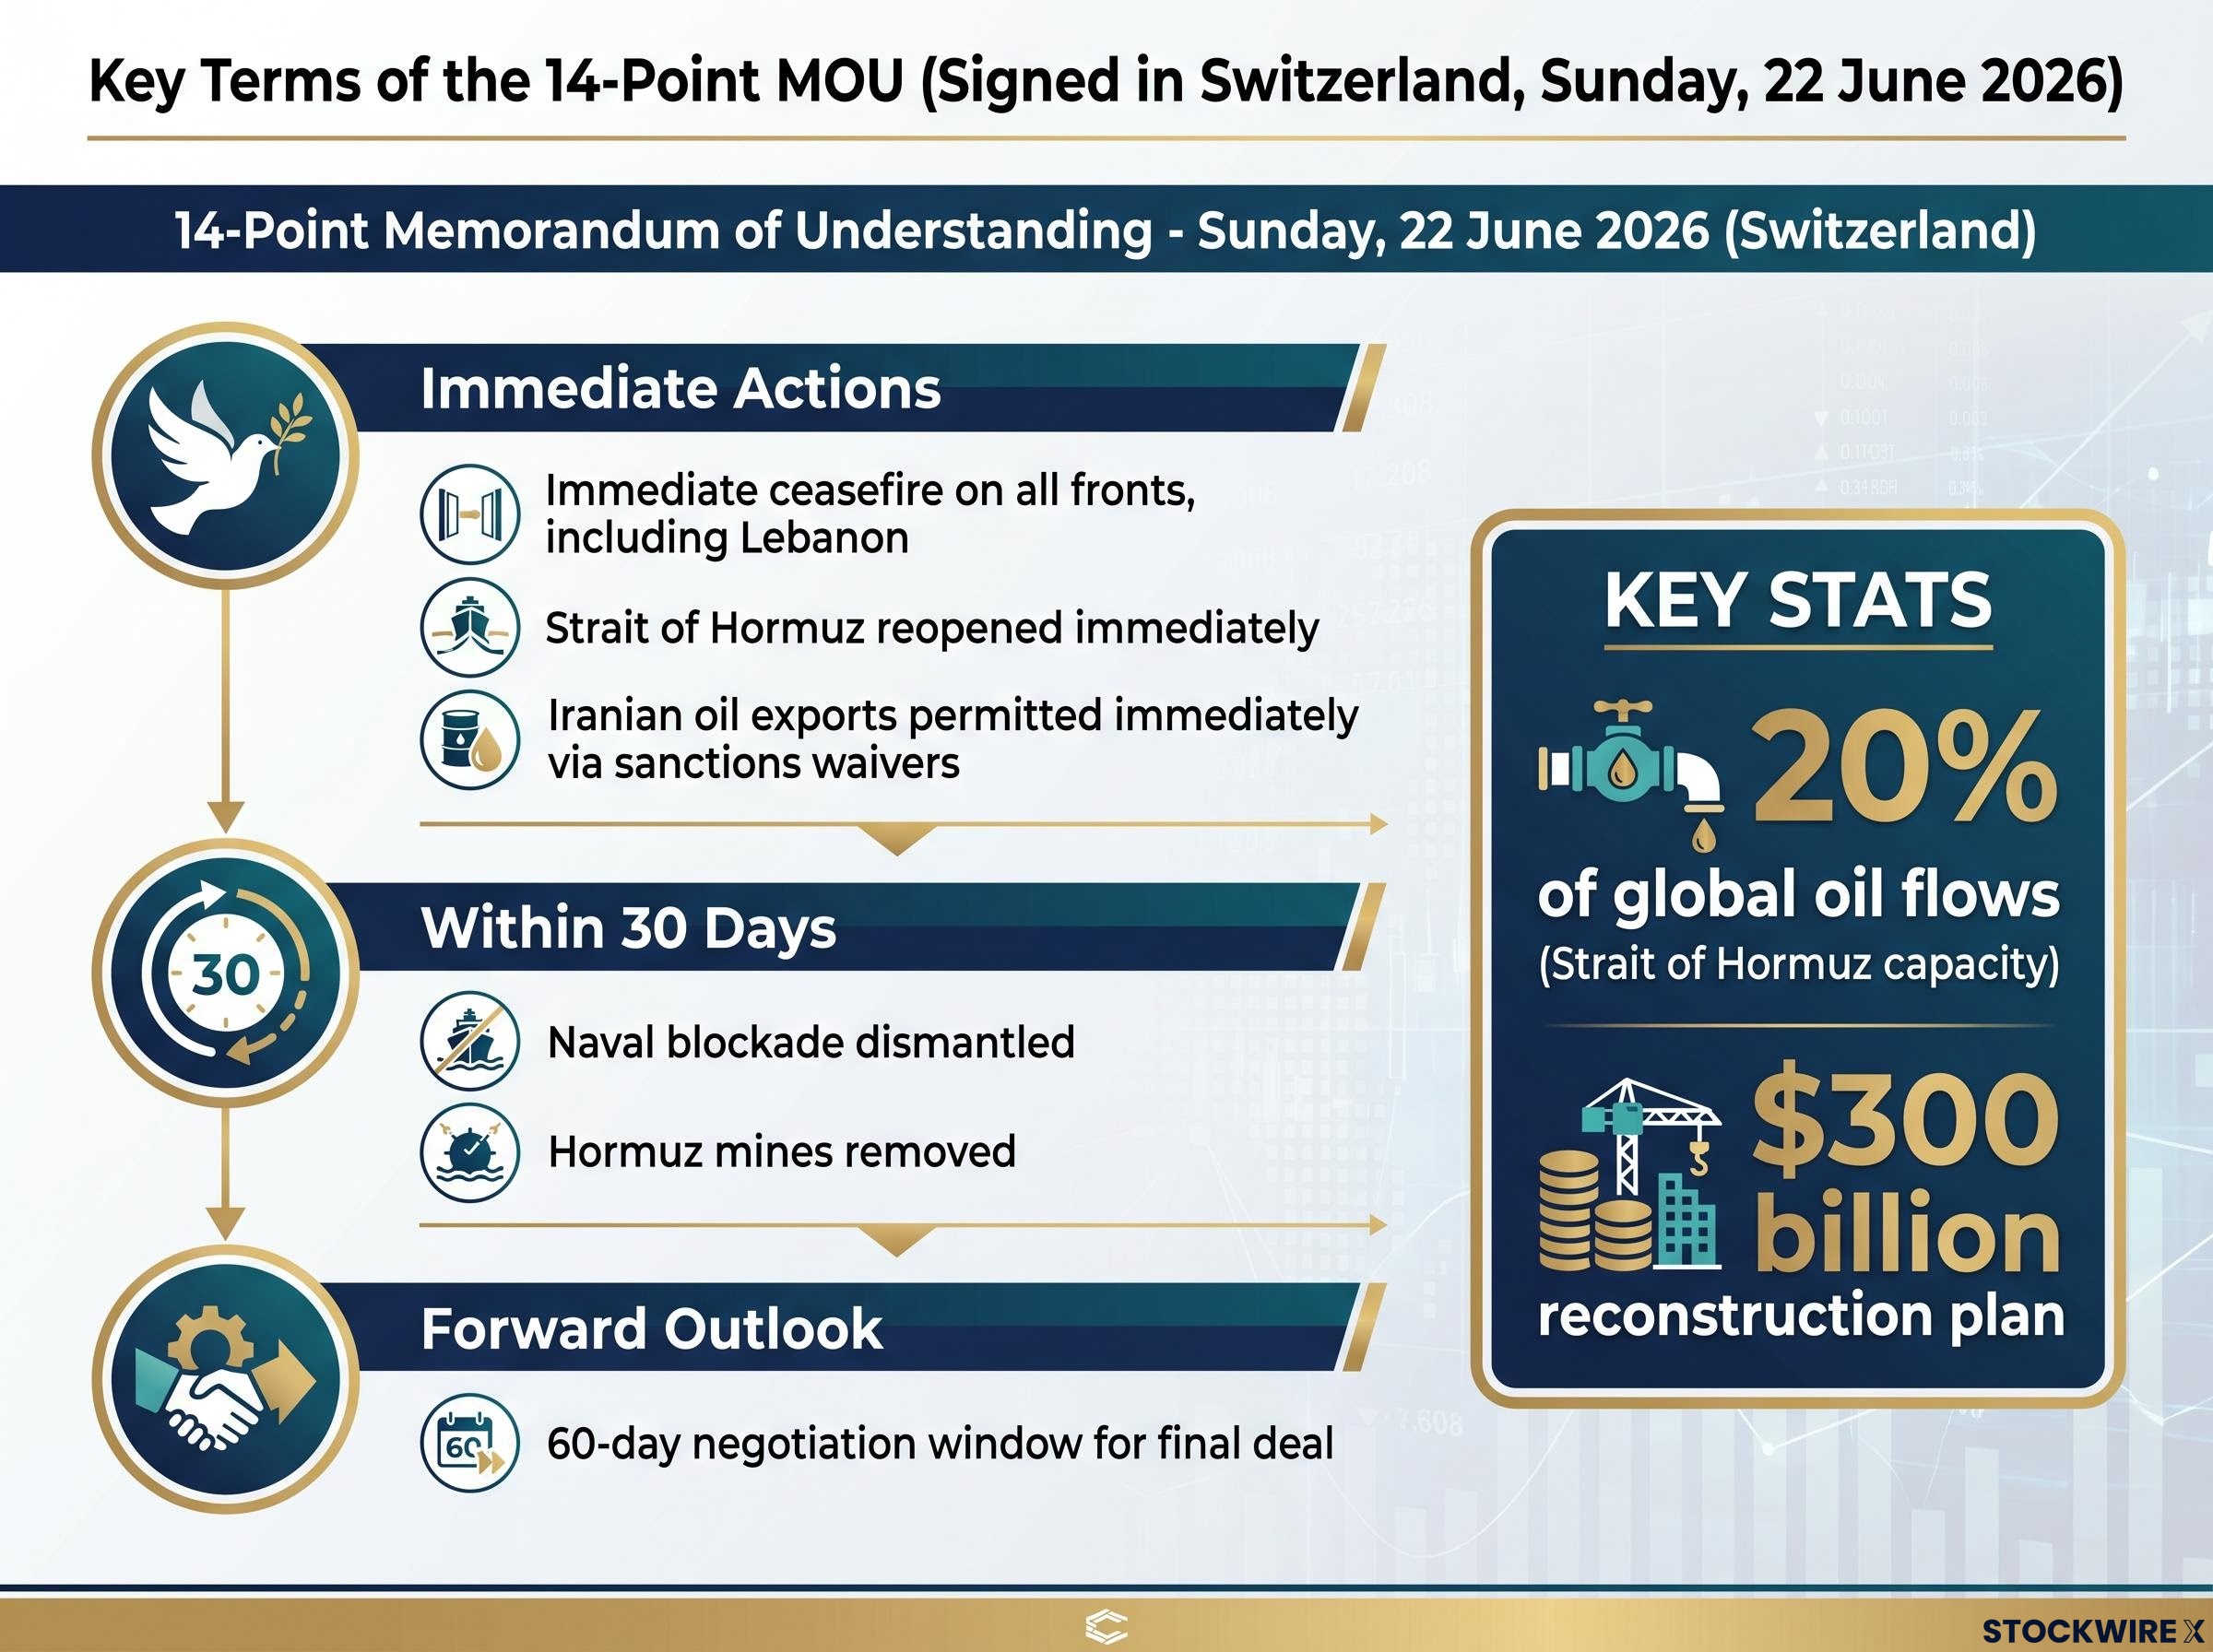
The Hormuz provision is the single most direct commodity trigger. The strait carries approximately 20% of global oil flows, and its reopening removes the scenario that had kept risk premiums elevated. A $300 billion reconstruction plan for Iran, included in the broader framework, signals the scale of economic commitment both sides are attaching to the deal’s success.
The oil decline reflects a real reduction in tail risk, not a speculative bet. But the 60-day negotiation window means the geopolitical risk premium has been reduced rather than eliminated, and you should size your response accordingly.
The Hormuz oil risk premium did not build overnight, and the IEA projects a two-year supply chain recovery timeline even under a best-case resolution, which is why the market is pricing a partial reduction in tail risk this week rather than a clean slate.
Three friction points are most likely to surface during the negotiation period. First, domestic political pushback in the US or Iran could slow or block ratification of a final agreement. Second, any shipping incident or accusation of non-compliance in the Hormuz corridor would immediately re-introduce the premium the market just shed. Third, disputes over the pace and scope of sanctions relief could stall implementation before Iranian barrels reach the market in meaningful volume.
The primary indicator to watch is rhetoric from Washington. President Trump continued to issue military threats toward Iran even as the MOU was signed, and any escalation in that tone is the earliest signal that deal stress is building.
The connection between falling crude and inflation data is real, but it operates through a specific chain that investors need to understand before Wednesday’s release.
The transmission works in three steps:
The limit of that chain is where it gets important. Core PCE, which strips out food and energy, is the measure the Federal Reserve actually prioritises as a signal of underlying inflation pressure. Lower oil helps headline PCE look better but does far less for core.
The Federal Reserve guidance on PCE inflation explains why the central bank favours the PCE price index over CPI as its primary inflation benchmark, citing its broader scope and ability to capture shifting consumer behaviour across expenditure categories.
Some core components are affected indirectly over time: airfares, shipping-intensive goods, and freight-linked industrial inputs all carry energy cost exposure. But those effects take months to filter through, not days.
The timing adds a layer. Wednesday’s May PCE data captures conditions from last month, before this weekend’s MOU was signed. The oil move does not yet appear in the Wednesday print. What it does is shape how markets interpret the forward path: if May’s reading is already benign and oil is now falling, the combination shifts rate expectations more than either data point would alone.
The Fed has signalled it needs several consecutive benign core prints before adjusting its guidance. One soft number shifts probabilities but does not confirm a policy change.
The sub-component most watched internally at the Fed is super-core: services excluding housing. This is the measure that captures wage-driven, demand-side inflation pressure most directly. If you want to track the granular data that the Federal Open Market Committee is actually debating, super-core is where to look.
Heading into this week, the prevailing consensus among market participants was that the Fed would keep rates on hold or nudge them slightly higher through 2026. A soft core PCE print could begin shifting that consensus, but only if it arrives alongside cooperative signals from the other data releases on the calendar.
Warsh’s forward guidance removal at the June meeting shifted the Fed’s communication architecture to a strict meeting-by-meeting framework, which means this week’s PCE print lands in a policy environment where even a benign number does not automatically translate into an easing signal from the committee.
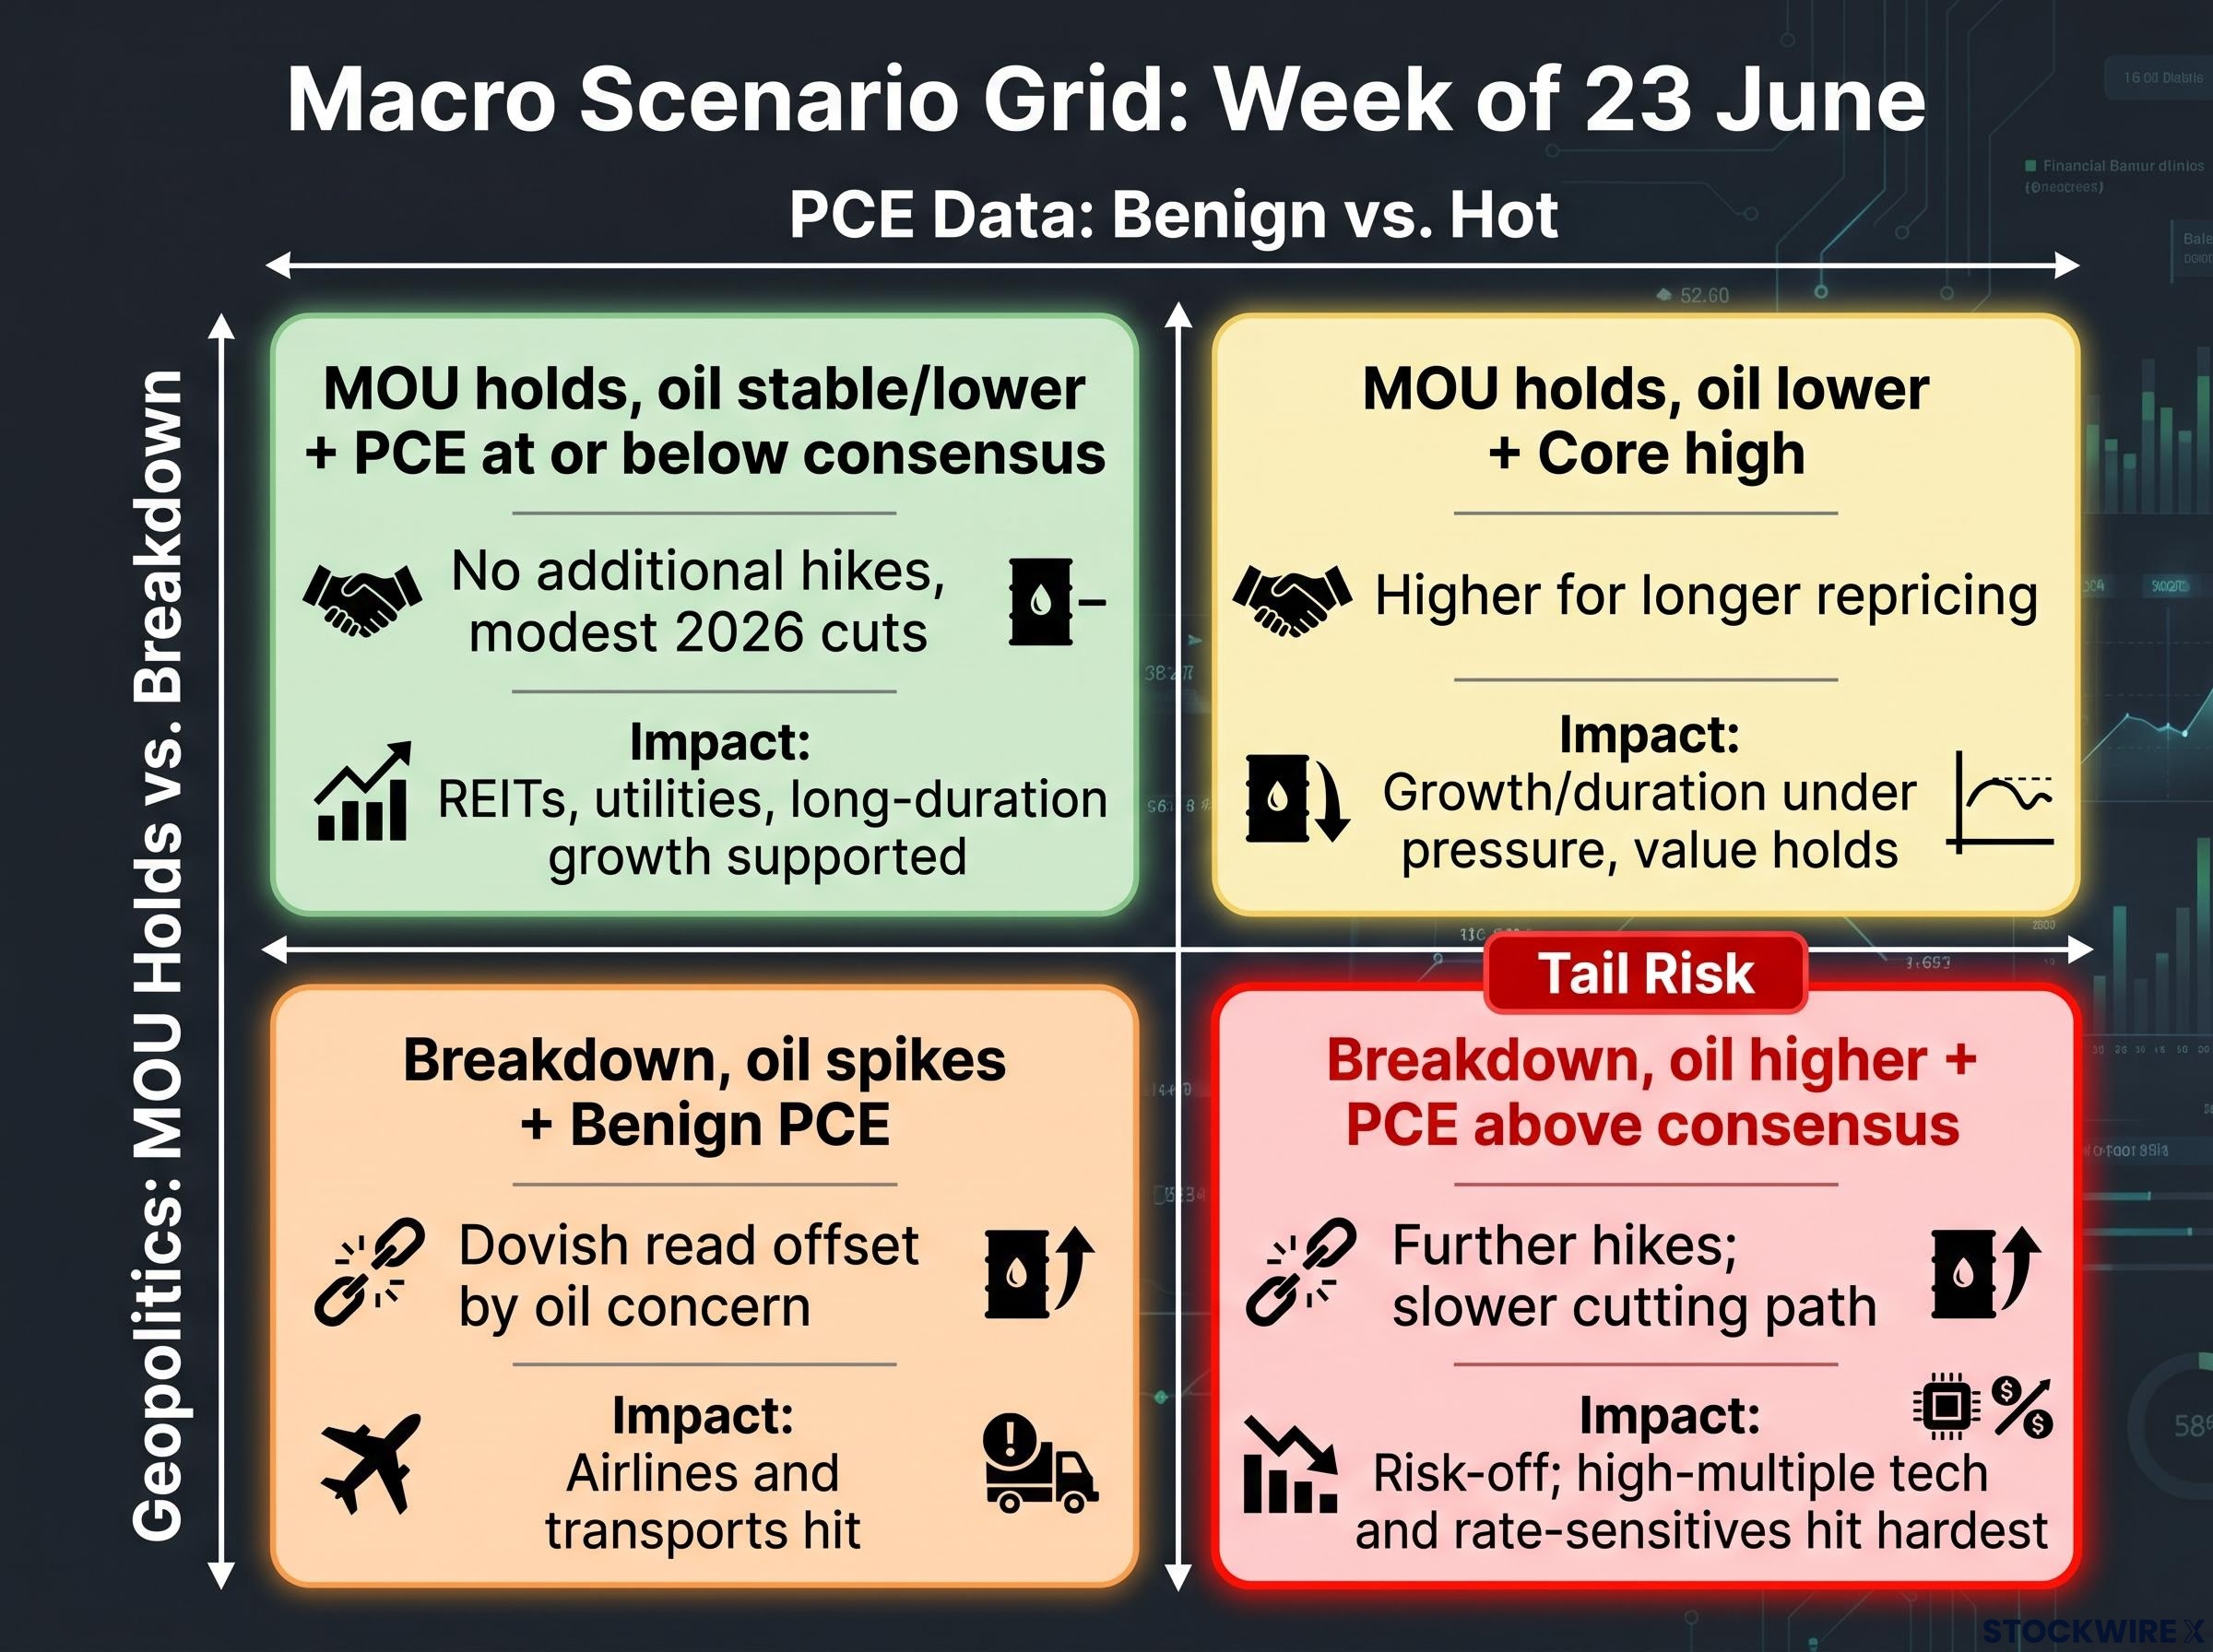
The week’s outcomes split across two axes: whether the MOU holds or breaks down, and whether PCE prints benign or hot. That gives you four distinct market environments, and running through each one before the data arrives tells you where your current positions carry asymmetric risk.
| Scenario | Geopolitics | PCE | Rate Implication | Equity Impact |
|---|---|---|---|---|
| Quadrant 1 | MOU holds, oil stable or lower | At or below consensus | Market leans toward no additional hikes, modest 2026 cuts | REITs, utilities, long-duration growth supported |
| Quadrant 2 | MOU holds, oil lower | Core still uncomfortably high | “Higher for longer” repricing | Growth and duration trades under pressure; value holds up |
| Quadrant 3 | Breakdown, oil spikes | Benign (reflects pre-MOU data) | Dovish PCE read offset by oil spike concern | Airlines and transports hit; short-term relief faded |
| Quadrant 4 | Breakdown, oil higher | Above consensus | Material chance of further hikes; slower cutting path | Broad risk-off; high-multiple tech and rate-sensitives hit hardest |
Quadrant 4 is the tail risk that deserves explicit acknowledgment. A simultaneous MOU breakdown and hot PCE print would represent the worst macro mix of the week: a re-inflationary energy shock layered on top of sticky core inflation, tightening financial conditions across equities, credit, and rates.
Running this grid before Wednesday tells you which of your current positions are most exposed to the worst-case quadrant. That is the framework for deciding whether to hedge or accept the tail risk heading into the data.
PCE captures the inflation side. The other releases this week fill in the growth side, and the Fed is reading both simultaneously.
If PMIs are soft and GDP is revised lower on the same day as a benign PCE print, the Fed faces a genuine growth-inflation trade-off rather than a simple inflation problem. That changes the policy calculus in ways that benefit duration and rate-sensitive equity sectors.
FedEx volumes function as a leading indicator of physical goods demand, which helps you calibrate whether PMI survey data aligns with actual economic activity. The fuel surcharge angle is the specific detail to watch: if FedEx’s cost margins improve on lower fuel costs at the same time volumes hold, it reinforces the constructive scenario where growth is slowing but not collapsing while inflation eases. That is the combination risk assets need most this week.
The positioning call this week is not a single directional bet. It is a conditional one: which quadrant the data and headlines deliver determines which parts of your portfolio benefit and which come under pressure.
| Asset Class | Favoured Outcome | Risk Scenario | Key Variable |
|---|---|---|---|
| Energy equities | MOU breaks down, oil rebounds | MOU holds, oil drifts lower | Brent/WTI daily moves and time spreads |
| Airlines and logistics | MOU holds, fuel costs fall | MOU breakdown, oil spikes | Hormuz shipping normalisation pace |
| REITs and utilities | Quadrant 1: MOU holds, soft PCE | Hot PCE pushes out easing timeline | Core PCE month-on-month |
| Long-duration growth | Lower real yields via soft PCE | Higher-for-longer repricing | Real yield movements post-data |
| Treasuries | Bull steepener on benign PCE plus falling oil | Bear flattener if front-end reprices higher | Core PCE versus consensus |
| High-yield credit | Geopolitical de-risking, lower energy costs | Quadrant 4 risk-off tightens conditions | MOU implementation signals |
Within energy equities, the distinction matters: integrated majors are more resilient than high-beta shale or offshore names if oil drifts lower on sustained Hormuz normalisation.
Emerging markets split along the energy import/export line:
If you hold concentrated positions in rate-sensitive or energy-linked assets, know your adjustment trigger before the data arrives. A pre-built response framework is worth more than a reactive one when Wednesday’s numbers print.
What this week resolves:
What remains open after Friday:
The supply normalisation timeline matters for how quickly the oil decline feeds into future PCE prints, and Saudi Aramco’s warning that full normalisation could extend into 2027 sets a ceiling on how rapidly headline inflation will respond even if Hormuz traffic resumes on schedule.
The Fed requires several consecutive benign core PCE prints before adjusting policy guidance. One good number shifts probabilities but does not confirm a pivot. The 60-day MOU window extends well beyond this week’s calendar.
The most constructive near-term mix: MOU implementation proceeding without incident, PMIs not collapsing, PCE benign or slightly soft, and Fed messaging emphasising patience rather than renewed hawkishness. That is the benchmark against which to measure what actually arrives.
A week that delivers Quadrant 1 outcomes gives you greater conviction in your current positioning rather than a signal to make aggressive new bets. The structural uncertainties remain intact after Friday. Knowing what this week can and cannot settle prevents you from overcorrecting on a single data release and helps you calibrate how much confidence to assign to any positioning changes you make in response to Wednesday’s prints.
This article is for informational purposes only and should not be considered financial advice. Investors should conduct their own research and consult with financial professionals before making investment decisions. Financial projections and forward-looking statements referenced in this article are subject to market conditions and various risk factors.
—
The MOU is a 14-point memorandum of understanding signed on 22 June 2026 following talks in Switzerland, covering an immediate ceasefire, the reopening of the Strait of Hormuz, and permission for Iranian oil exports to resume immediately via sanctions waivers. Because the Strait of Hormuz carries approximately 20% of global oil flows, its reopening directly removes the supply-disruption risk premium that had kept crude prices elevated.
Lower crude prices reduce consumer energy costs, including gasoline and diesel, which feeds directly into the headline PCE figure. Core PCE, the measure the Federal Reserve actually prioritises, is less affected in the short term because energy costs filter into services and goods prices over months rather than days.
The key releases are the May PCE price index and a revised Q1 2026 GDP figure on Wednesday 25 June, plus June PMI readings on Tuesday 24 June. The most important sub-component to track in the PCE report is super-core, services excluding housing, because it captures the wage-driven inflation pressure the Federal Reserve is most focused on.
Quadrant 4 is the tail risk: a simultaneous breakdown of the US-Iran MOU causing an oil price spike layered on top of a hotter-than-expected PCE print, which would raise the probability of further Federal Reserve rate hikes and trigger broad risk-off pressure across high-multiple equities, credit, and rate-sensitive assets.
REITs, utilities, airlines, logistics companies, and long-duration growth equities are the primary beneficiaries of Quadrant 1, where the MOU holds, oil remains stable or drifts lower, and PCE prints at or below consensus, easing pressure on rate expectations. Treasuries would likely see a bull steepener in that scenario.


