
The $1.1 Trillion Hyperscaler Capex Gap Wall Street Is Missing
3 mins ago

Wall Street is currently modelling a version of the AI infrastructure buildout that Barclays believes is roughly $230-$300 billion too cheap. That gap is not a rounding error. It is a structural assumption embedded in equity valuations, credit spreads, and sector allocations across the market.
Barclays puts combined hyperscaler capital expenditure on a path to exceed $1.1 trillion by 2028, a figure the bank calculates at around 26% higher than where Wall Street consensus currently sits. That divergence sits at the analytical core of the bank’s second-half 2026 positioning, and it reaches well beyond the technology sector into credit markets, utilities, industrials, and consumer spending.
What follows unpacks the maths behind that gap, where the funding pressure surfaces first, and which sectors Barclays believes are priced for the wrong scenario heading into the back half of 2026.
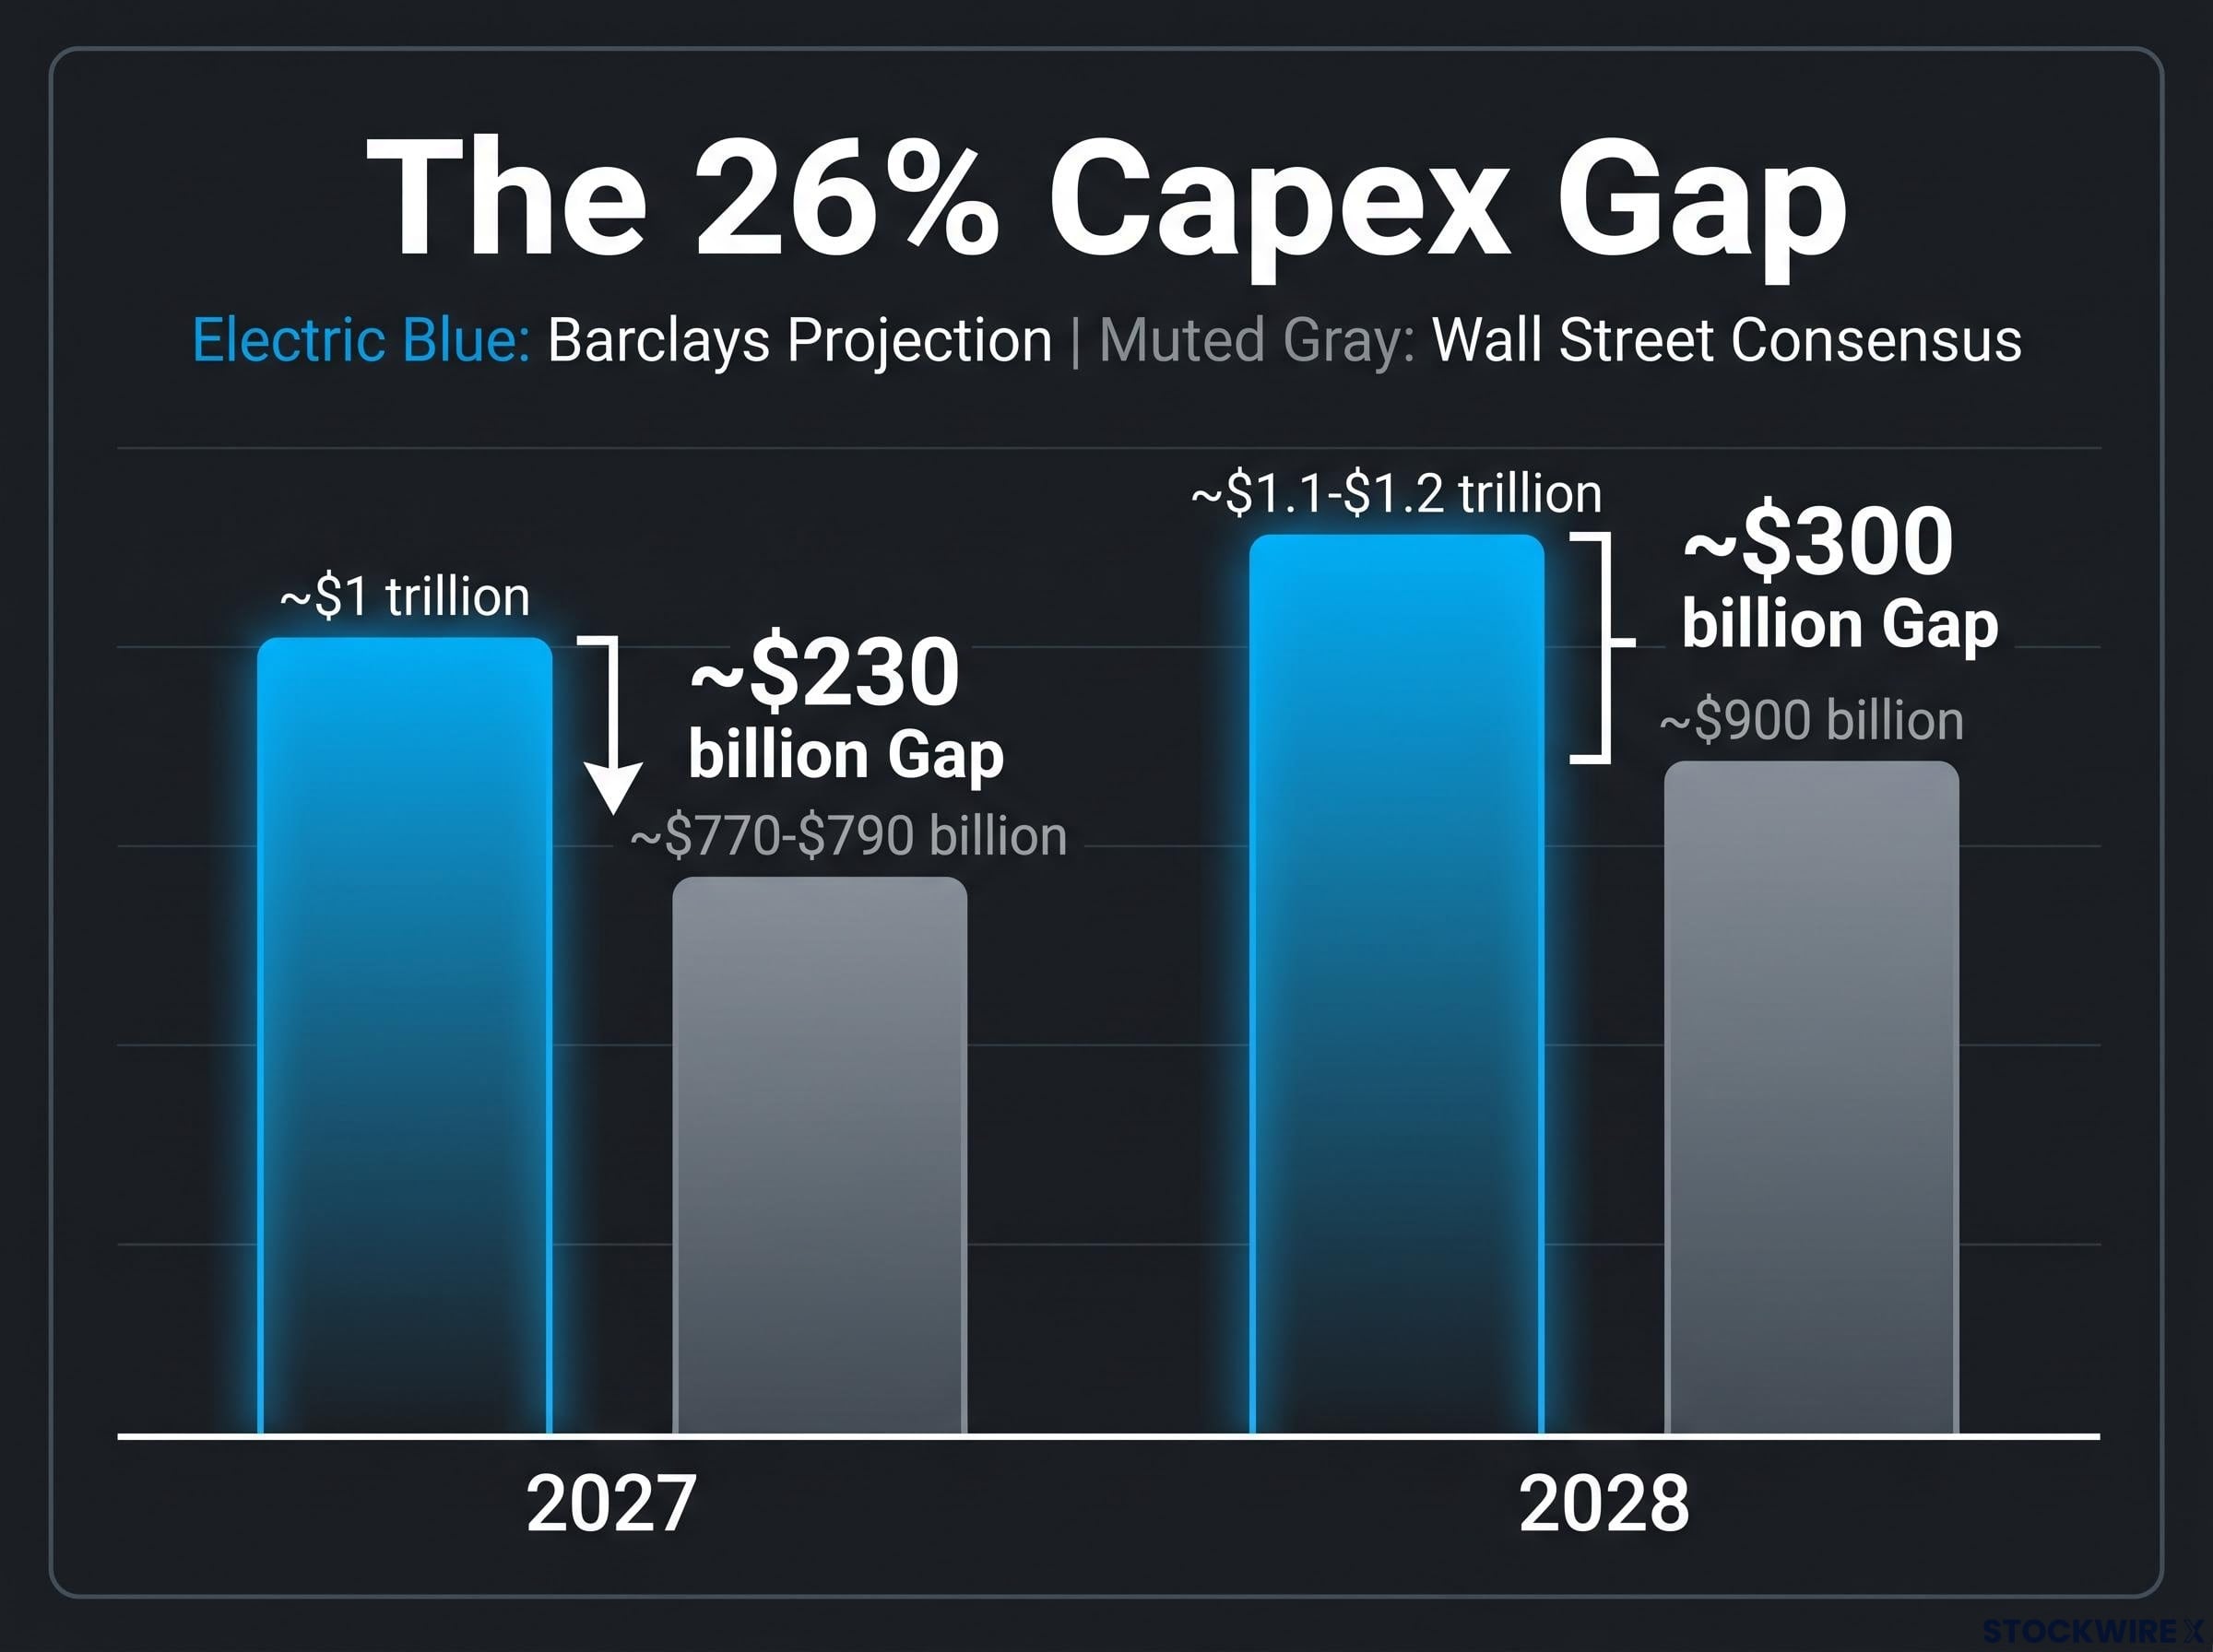
Barclays’ credit strategy team, cited by Bloomberg, projects that hyperscaler capital expenditure could near $1 trillion in 2027 and rise to approximately $1.2 trillion in 2028. The bank’s equity research variant puts the 2028 figure above $1.1 trillion. Either way, the numbers land in the same territory: roughly 26% above what the rest of Wall Street is currently modelling.
In dollar terms, that translates to approximately $230 billion above consensus in 2027 and close to $300 billion in 2028. Barclays analyst Thomas O’Malley, in the bank’s “Flip Side” video series, frames the peak at around 2028 using a lab-driven artificial intelligence (AI) capex framework, meaning one built from competitive dynamics between hyperscalers rather than demand forecasts alone.
The divergence is not idiosyncratic to Barclays. Goldman Sachs’ independent modelling points to a similar gap, estimating hyperscaler capex could reach roughly $1.1 trillion in 2027 against approximately $920 billion in current consensus. When two of the largest research operations on Wall Street independently arrive at a comparable analytical fracture, the question shifts from whether consensus is wrong to how much repricing is still ahead.
The hyperscaler capex trajectory entering 2026 already supports Barclays’ projection, with Amazon, Microsoft, Alphabet, and Meta collectively spending $130 billion in Q1 2026 alone and full-year combined guidance reaching approximately $725 billion, a pace that puts the $1 trillion annual run rate within reach by 2027 on current trends.
Barclays credit strategy projects that hyperscaler capex could near $1 trillion in 2027 and rise to approximately $1.2 trillion in 2028.
| Year | Barclays Projection | Street Consensus (approx.) | Implied Gap |
|---|---|---|---|
| 2026 | Above consensus (trajectory building) | Baseline estimates | Widening |
| 2027 | ~$1 trillion | ~$770-$790 billion | ~$230 billion |
| 2028 | ~$1.1-$1.2 trillion | ~$900 billion | ~$300 billion |
That 26% gap matters because it is the magnitude of repricing that could still be ahead for any investor whose portfolio is currently priced to the consensus scenario rather than the one Barclays is describing.
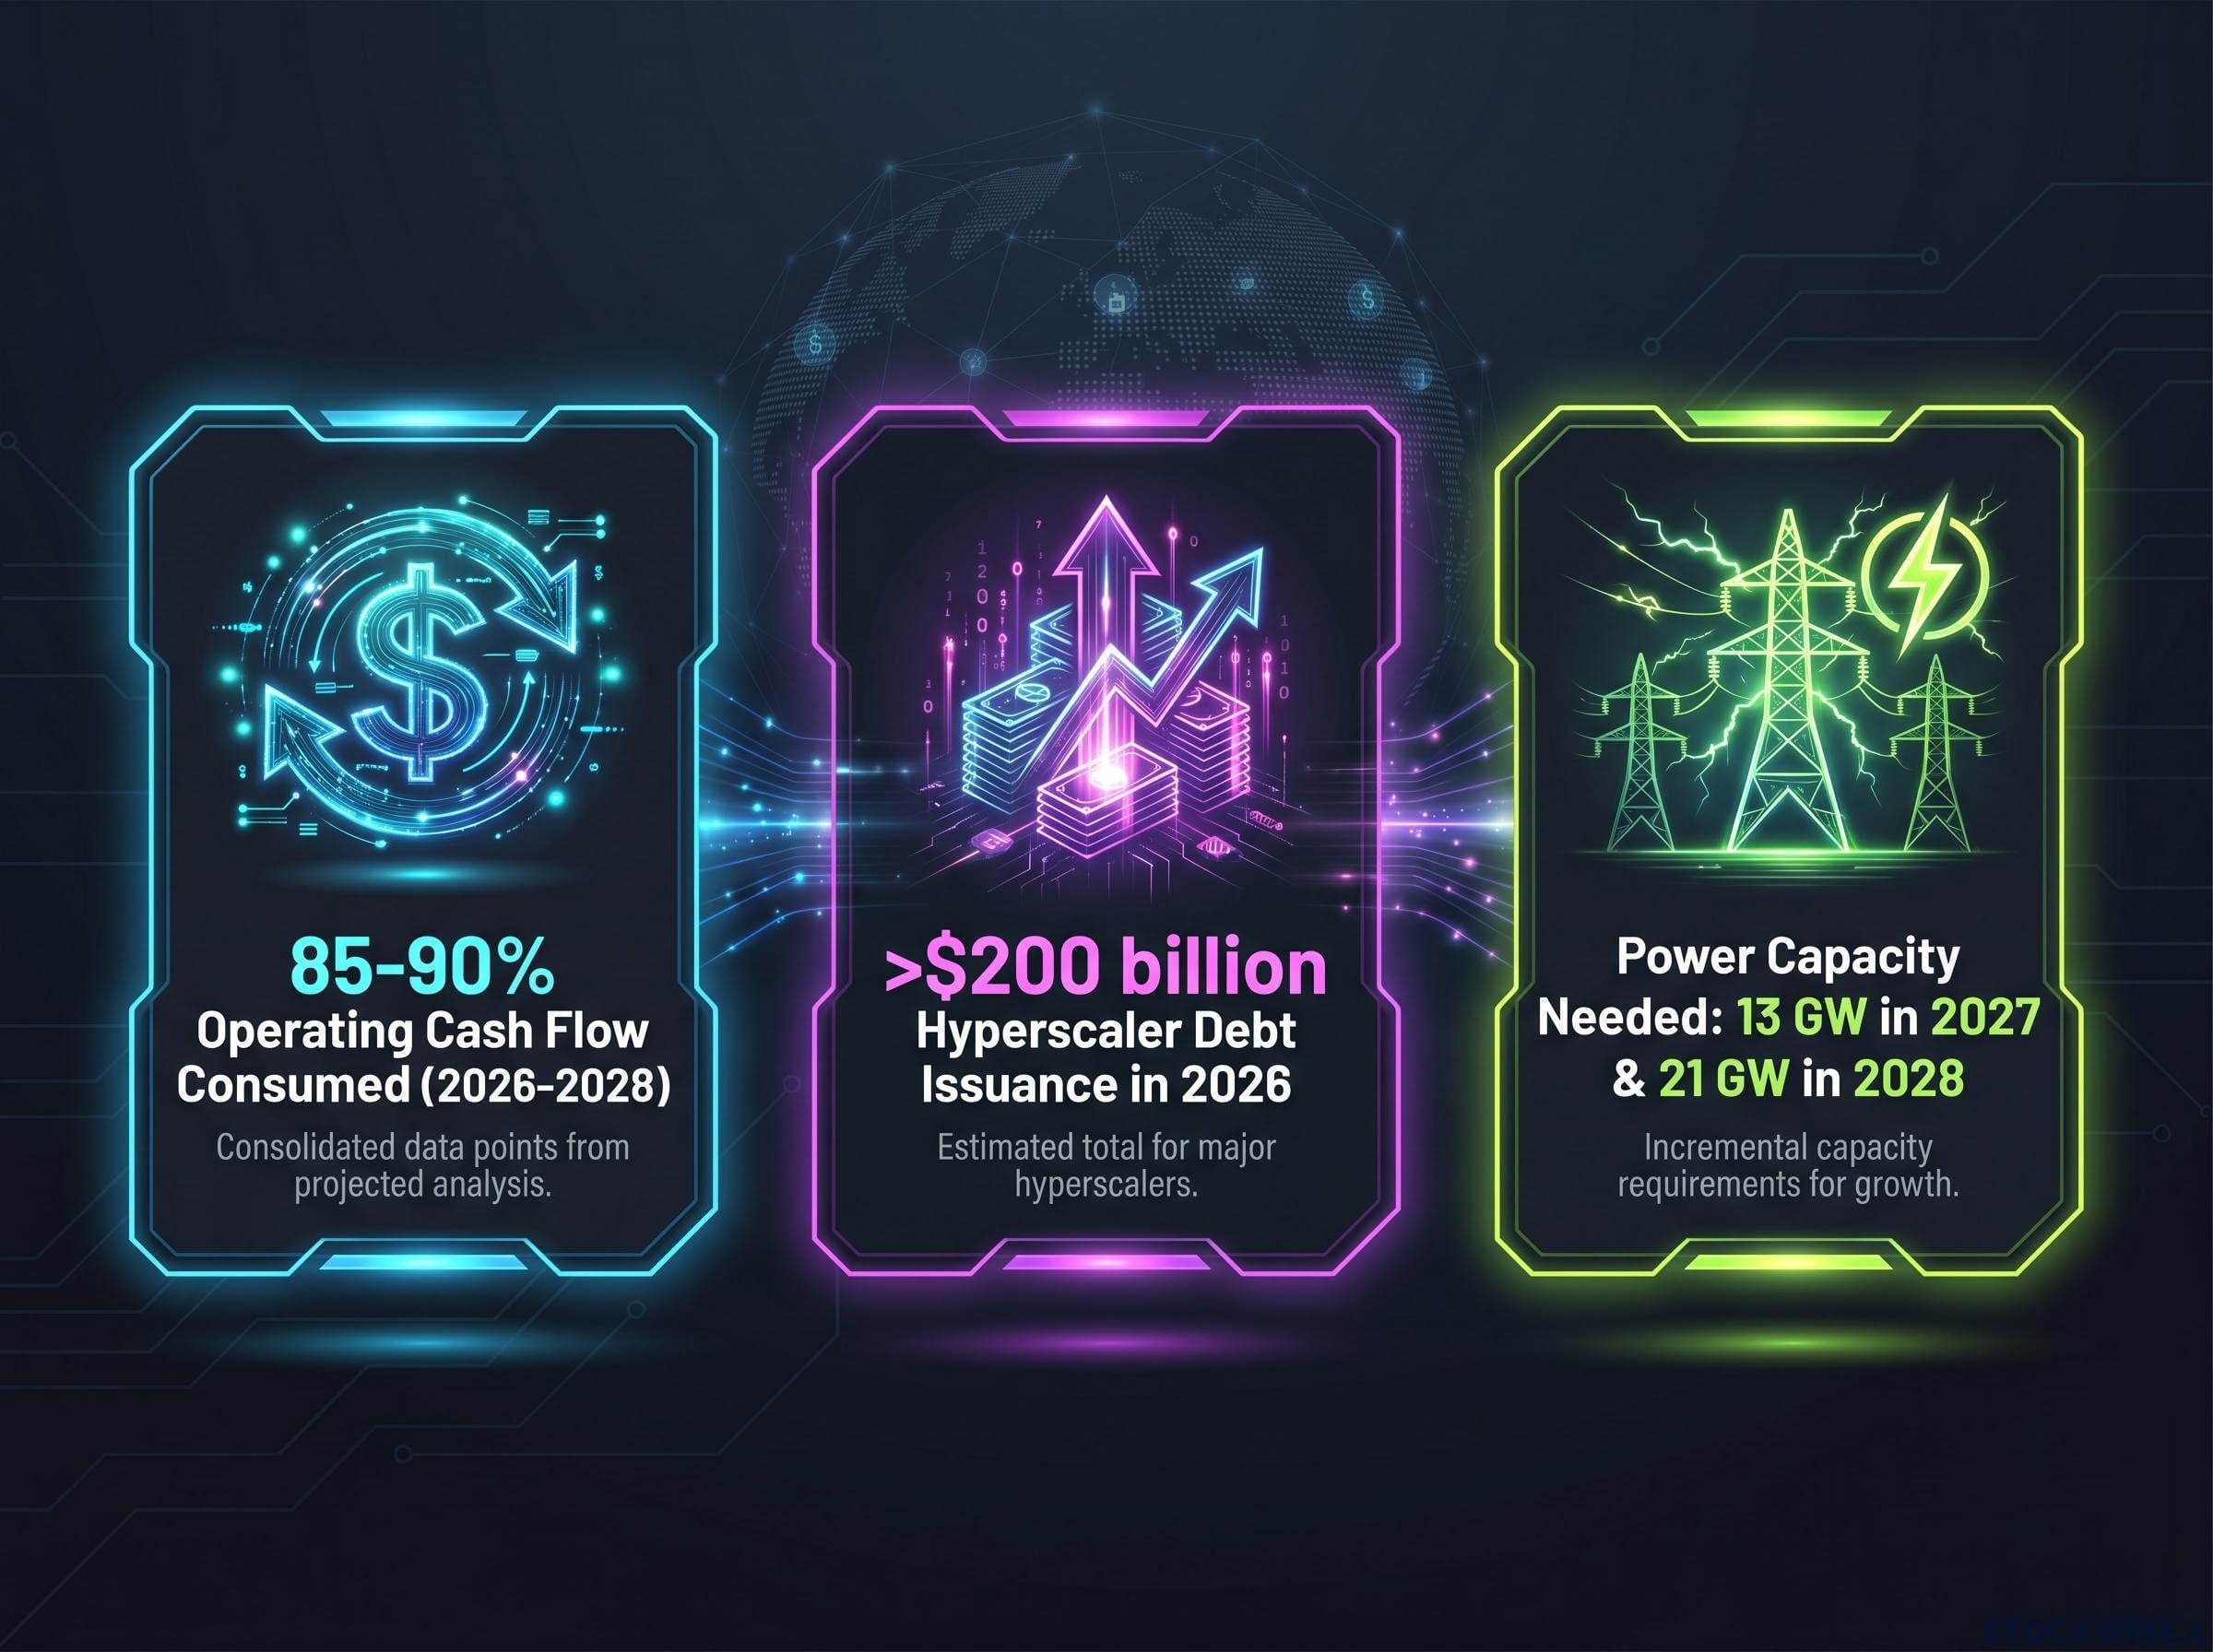
Barclays models hyperscaler capex consuming 85-90% of combined operating cash flow between 2026 and 2028. That is the ratio. Here is what the ratio feels like from inside a corporate treasury: for every dollar of cash these companies generate from operations, roughly 85 to 90 cents is already committed to building AI infrastructure. The margin left over for dividends, buybacks, acquisitions, and working capital needs is a sliver.
Internal cash generation covers most of the projected spend, but not all of it. The shortfall is not optional debt; it is structural. Barclays expects hyperscaler debt issuance to exceed $200 billion in 2026, with further increases likely in 2027.
The AI infrastructure debt burden carries another dimension that quarterly earnings do not fully surface: Oracle’s 9% post-earnings collapse in June 2026, despite beating expectations, illustrated how capital markets are increasingly pricing balance sheet leverage ahead of income statement performance when issuers announce large financing plans mid-cycle.
The three implications of this funding structure land in sequence:
When nearly all of a company’s operating cash flow is committed to capex, the margin for error shrinks to near zero. Any shortfall in cash generation or AI monetisation turns a funding gap into a refinancing event.
Barclays’ credit strategy team has explicitly warned that the investment-grade bond market may not be able to accommodate all hyperscaler financing needs. That warning carries implications well beyond technology names.
When issuers of this size enter the bond market at this pace, they crowd the calendar, compress new-issue concessions, and widen spreads across indices. For investors holding investment-grade credit, the downstream effect is not theoretical. It is a repricing of the cost of corporate borrowing that touches every sector in the index.
Capital expenditure, or capex, is the money a company spends on long-term physical assets: buildings, equipment, infrastructure. Most corporate capex cycles follow demand. Companies see revenue growing, invest to meet it, and pull back when demand softens. AI infrastructure capex does not follow that pattern, and the difference explains why this cycle is structurally distinct.
Three features separate AI capex from prior tech investment cycles:
The scale of the current cycle is clearest when set against prior technology investment peaks: US IT spending reached 4.9% of GDP in Q1 2026, surpassing both the dot-com era high of approximately 4.2% and the cloud buildout peak of approximately 3.8%, a comparison that contextualises why Barclays’ $1.1 trillion projection, while large in absolute terms, sits within a structurally unprecedented demand environment.
The power capacity requirement alone tells the story of physical scale: 13 GW of new capacity in 2027 and 21 GW in 2028 to support AI demand.
Venu Krishna, Barclays’ head of US equity strategy, frames AI capex as a key earnings support but also a source of volatility given adoption and monetisation uncertainty. The physical infrastructure dependency is what makes this cycle sticky in both directions: it creates durable tailwinds for utilities and industrials, but it also means that if AI monetisation disappoints, the capital is already locked into concrete and cables with no easy exit.
Understanding this anatomy helps you distinguish which sector exposures are durable (power, grid, industrial construction) from which are contingent on AI adoption hitting its targets (hyperscaler valuations, credit spread assumptions).
The AI capex cycle is large and sticky. The macro environment it is running in offers less cushion than prior cycles enjoyed.
Barclays identifies four risk factors for the second half of 2026:
The Federal Reserve June 2026 monetary policy decision reinforced the higher-for-longer rate posture that Barclays identifies as a structural headwind, confirming that the easing runway hyperscalers are counting on to soften debt issuance costs remains narrower than prior cycle assumptions implied.
Barclays’ strategists argue that earnings momentum, including the demand generated by AI activity, must shoulder a greater share of the bull case as the scope for monetary easing narrows. The safety net is thinner precisely when the capex commitments are largest.
If the Federal Reserve transitions to new leadership, the available rate-cutting runway could shrink considerably. This is not widely discussed in public Barclays press coverage, but the logic is straightforward: a leadership transition introduces uncertainty about the timing and magnitude of easing at precisely the moment hyperscalers are issuing debt at record scale.
Higher-for-longer rates raise the cost of the more than $200 billion in annual debt hyperscalers are already issuing. A macro environment with less monetary policy flexibility means that any stumble in AI capex execution or monetisation has less of a policy buffer to absorb it, making the range of outcomes wider than it would be in a rate-cutting cycle.
For investors relying on Fed support to underwrite stretched valuations, Barclays’ framing amounts to a structural warning: the AI capex story and the macro safety net are both under simultaneous pressure in the second half of 2026.
If hyperscaler capex is heading where Barclays believes it is, the sector implications follow logically from everything above. The bank’s formal positioning reflects where it sees the consensus-vs-reality gap as widest.
| Sector | Rating | Primary Rationale | Capex Cycle Connection |
|---|---|---|---|
| TMT | Positive | Strong earnings momentum in tech and communication services | Direct beneficiary of above-consensus AI and cloud demand |
| Industrials | Positive | Multi-year economy-wide capex boom thesis | Data centre construction, grid infrastructure, equipment supply |
| Utilities | Positive | Power and grid bottleneck as structural demand tailwind | 13 GW (2027) and 21 GW (2028) capacity requirements |
| Financials | Neutral (downgraded) | Non-bank lending stress, regulatory headwinds, and AI disruption across non-bank segments | Previously positive thesis did not materialise; AI disruption adds new headwind |
| Healthcare | Neutral (upgraded) | Bulk of the sector’s earnings estimate cuts now behind it | Indirect; earnings stabilisation unrelated to capex thesis |
The Consumer sector sits at the other end. Barclays rates it Negative, driven by three distinct pressure sources converging in the second half of 2026:
The Utilities Positive stance deserves particular attention. If the market is modelling a cheaper AI buildout than the one Barclays describes, it is simultaneously underpricing the power and grid demand that the larger buildout requires. The 13 GW and 21 GW capacity figures are not speculative; they are engineering requirements tied to compute capacity that hyperscalers have already committed to.
The sector grid tells you where Barclays believes the market has the wrong consensus assumption embedded. Owning Consumer into a higher-for-longer, inflation-pressured environment, or holding Financials without accounting for private credit stress and AI disruption, are both expressions of the same underpricing problem.
For readers wanting to understand the full investment implications of the power constraint, our deep-dive into the structural grid crisis examines how IEA projections place data centre and AI electricity consumption above 1,000 TWh by 2026, which corporate beneficiaries across nuclear operators, regulated utilities, and grid equipment manufacturers are best positioned to capture the demand, and how the regulatory fragmentation between the EU and US is creating asymmetric timelines for infrastructure buildout.
If $1.1 trillion or more in hyperscaler capex by 2028 is the correct number, the market’s current consensus assumptions about equity valuations, credit spreads, and sector allocations all face potential revision. Approximately 26% above consensus translates to $230-$300 billion in capex that is not currently modelled into most portfolio frameworks.
The repricing magnitude: approximately 26% above consensus, translating to $230-$300 billion in unmodelled capex by the peak year.
Three variables will determine whether the Barclays scenario or the consensus scenario is closer to correct:
The capex peak sits at approximately 2028, which means the full resolution of this analytical debate is a multi-year process. Each quarterly earnings cycle from hyperscalers provides data that either closes or widens the gap between Barclays and consensus.
Tracking these three variables across the next six to eight quarters gives you a materially better read on whether the AI capex cycle is delivering its bull case or revealing the bear case embedded in Barclays’ funding gap warning. The Barclays thesis is not a single trade. It is a multi-year analytical framework, and the signposts are where that framework becomes actionable.
This article is for informational purposes only and should not be considered financial advice. Investors should conduct their own research and consult with financial professionals before making investment decisions. These statements are speculative and subject to change based on market developments and company performance.
Hyperscaler capital expenditure refers to the spending by the largest cloud and AI platform companies, including Amazon, Microsoft, Alphabet, and Meta, on physical infrastructure such as data centres, servers, and power systems. It matters for investors because the scale of this spending ripples through equity valuations, credit markets, utilities, and industrials far beyond the technology sector.
Barclays projects combined hyperscaler capex will reach approximately $1.1-$1.2 trillion by 2028, roughly 26% above current Wall Street consensus estimates of around $900 billion, a divergence that Goldman Sachs' independent modelling also supports.
Barclays' credit strategy team has warned that the investment-grade bond market may struggle to absorb all hyperscaler financing at this pace; concentrated issuance of this scale tends to crowd the calendar, compress new-issue concessions, and widen spreads across indices, raising the cost of corporate borrowing for every sector in the index.
Three features make it structurally distinct: hyperscalers face a competitive escalation dynamic where no single company can afford to fall behind in model training capacity; the physical infrastructure requires power plants and transmission lines measured in years to build; and capital commitments are being made ahead of confirmed AI revenue returns, meaning the spending is locked in before monetisation is proven.
Barclays rates TMT, industrials, and utilities as Positive, with utilities supported by the 13 GW and 21 GW power capacity requirements in 2027 and 2028 respectively; financials were downgraded to neutral and consumer was rated Negative, citing inflation pressure, moderating income growth, and higher-for-longer interest rates.


