
Why Short Squeezes Send Stocks Parabolic and Then Collapse
15 mins ago
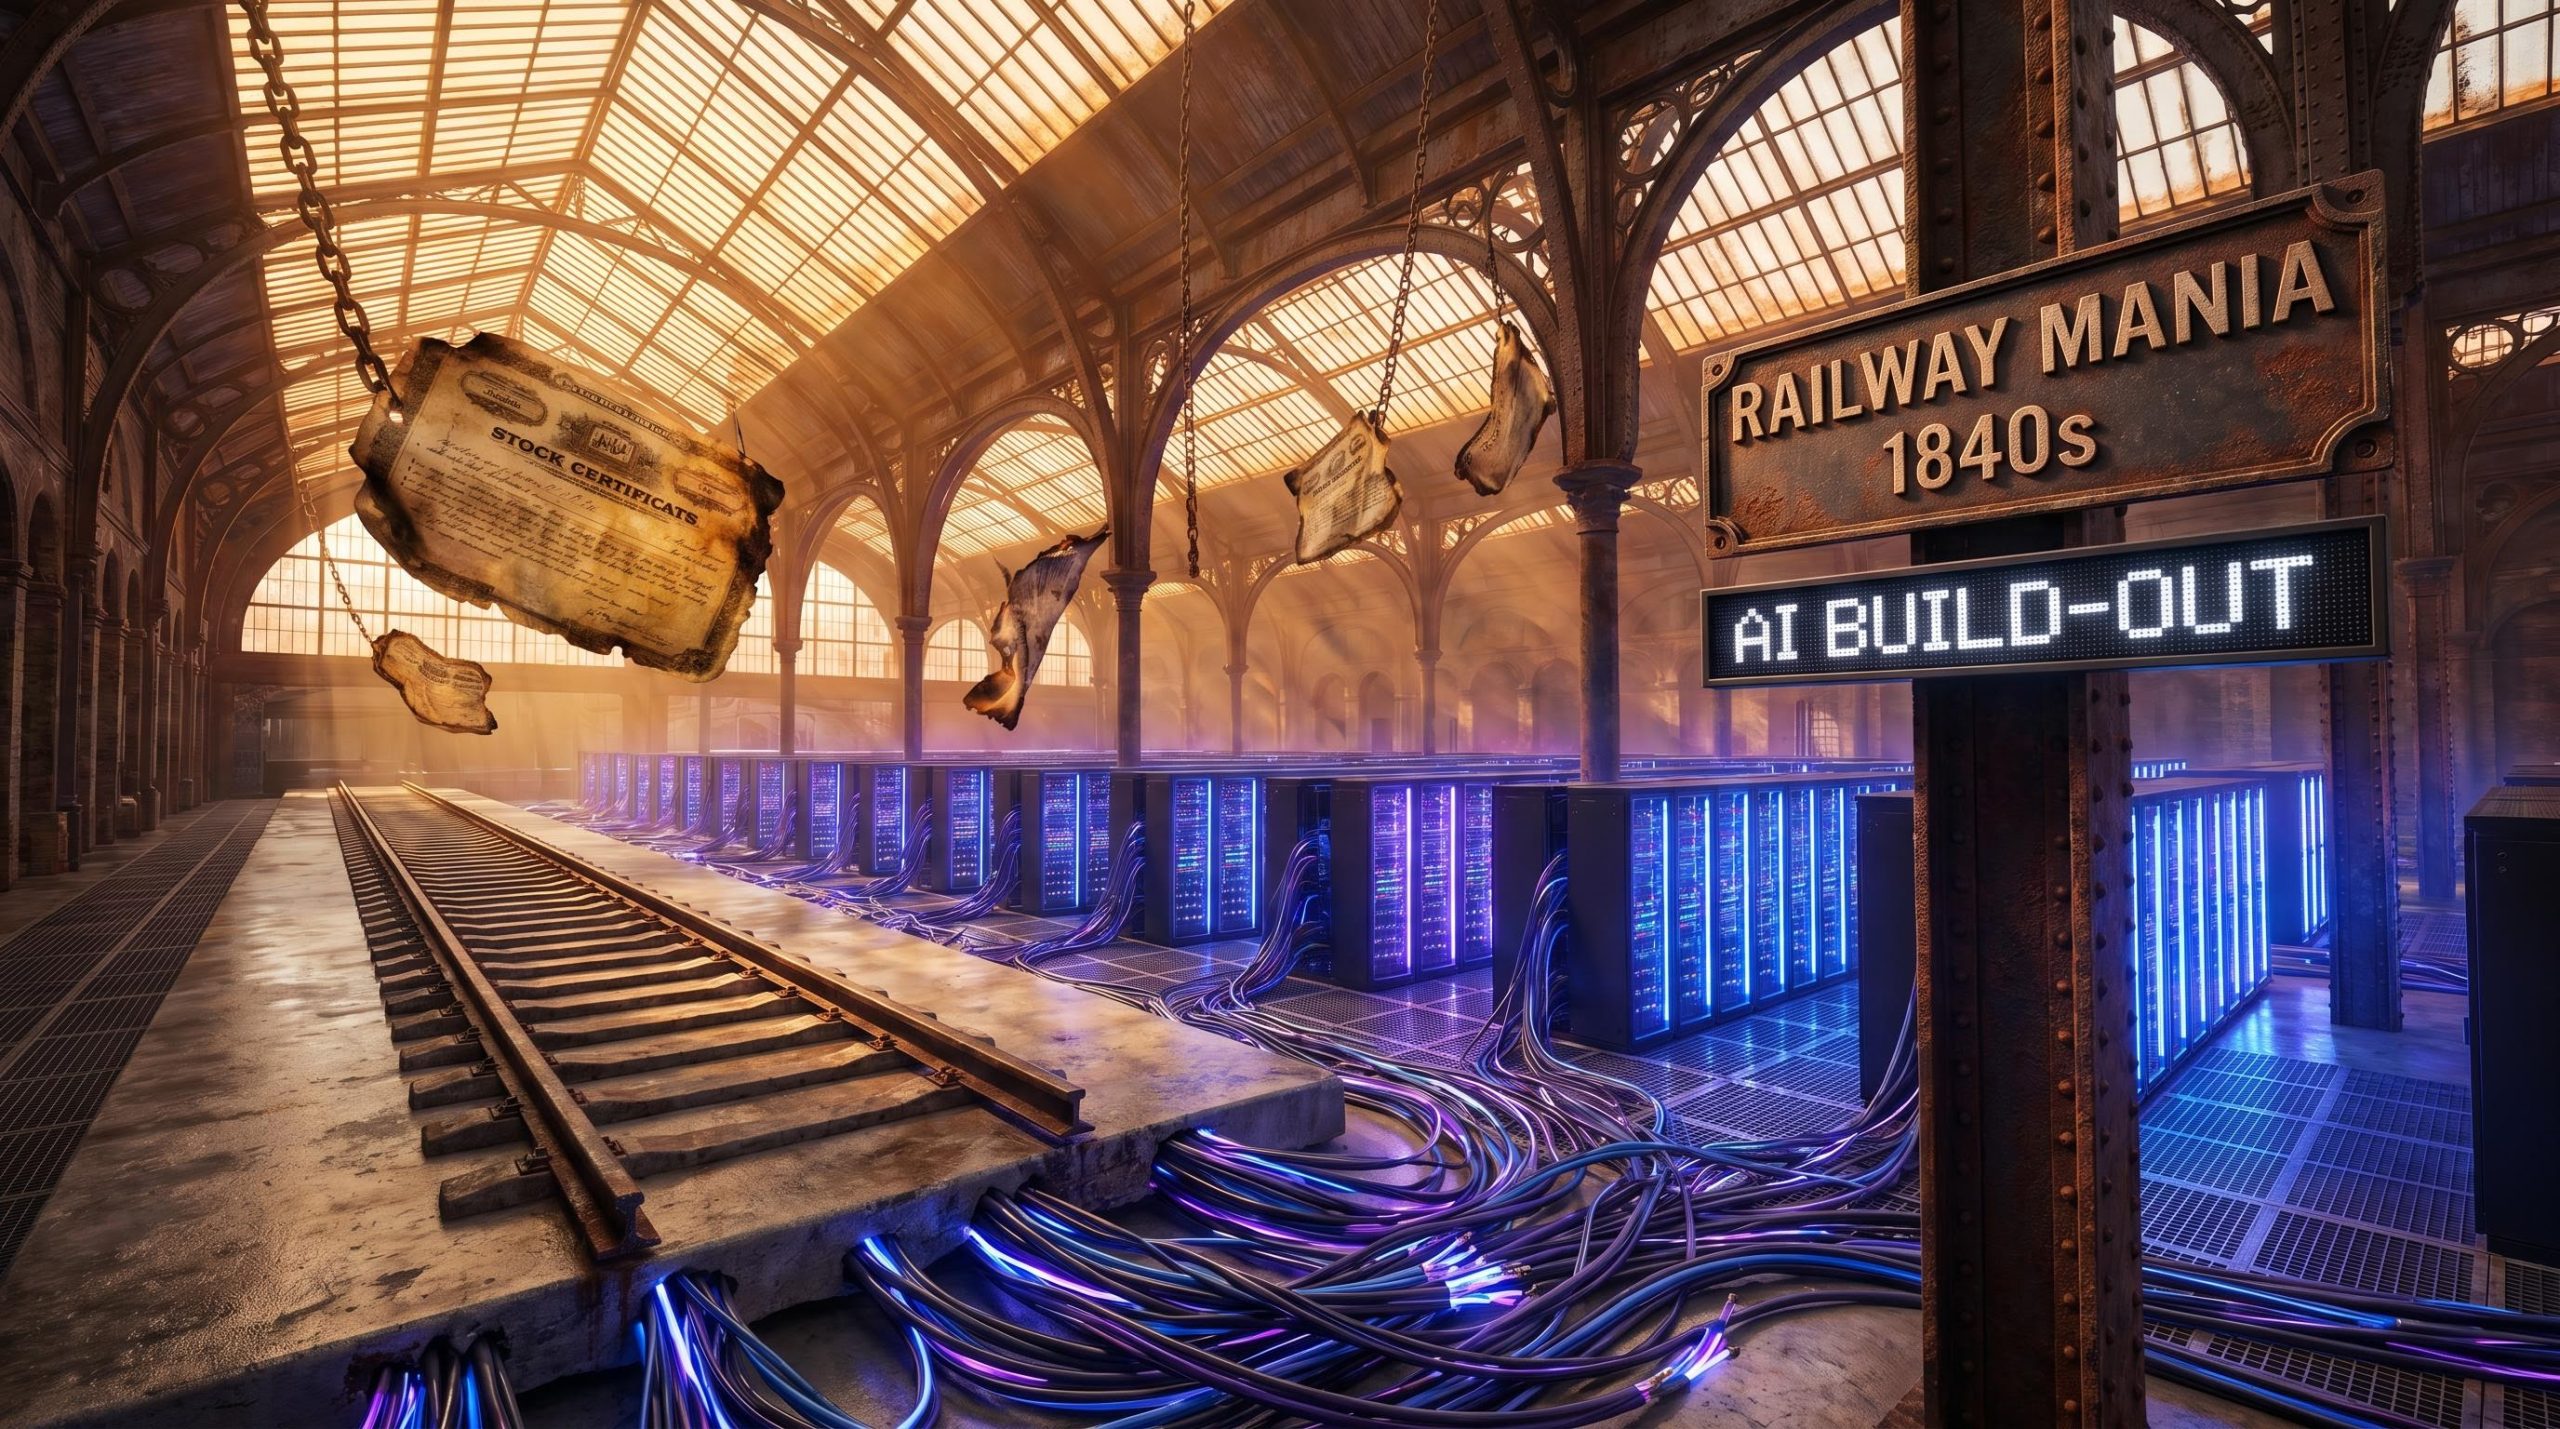
Three-quarters of every major general-purpose technology boom in history has followed the same arc: euphoric overbuilding, widespread capital destruction, and then decades of genuine productivity gains built on the infrastructure that survived. With hundreds of billions of dollars now flowing into AI data centres, chips, and power infrastructure, investors are asking whether the current buildout is a rational bet on a technology that will reshape economies, or a replay of the speculative overbuilding that preceded the dot-com collapse. The historical record suggests both can be true simultaneously, and that they usually are. What follows traces that pattern from 1840s British railways through the 1990s fibre-optic overbuild, explaining what the evidence actually tells investors about positioning, risk, and realistic timelines for AI to deliver on its productivity promise.
Economists classify certain technologies as general-purpose technologies (GPTs), innovations that improve over time, spread across multiple sectors, and generate waves of complementary inventions. That profile sounds like a compelling investment case. In practice, it creates the structural conditions for overinvestment.
The canonical examples include:
Each of these technologies genuinely reshaped the economies they entered. Each also attracted capital far in excess of what near-term demand could absorb.
Approximately three-quarters of historical general-purpose technology booms followed a comparable trajectory: massive overinvestment, financial destruction, and then extended productivity growth built on whatever infrastructure survived.
The paradox is structural, not incidental. GPTs promise broad, long-run returns, which attracts speculative capital. But the lag between capital deployment and realised productivity is measured in decades, not quarters. That gap almost guarantees a boom-bust sequence before the genuine gains arrive. Understanding this pattern is not historical pessimism; it is the documented baseline for how economies absorb their most important technologies.
The 1990s long-haul fibre build-out was fuelled by speculative demand assumptions and debt-financed expansion. Carriers such as Global Crossing and Level 3 raced to provision capacity for internet traffic that, in the short term, never arrived at the scale their business models required.
Approximately US$5 trillion in equity market value was destroyed across the tech sector between 2000 and 2002.
The collapse metrics were severe:
Then something happened that complicates the word “waste.” The surviving and eventually reactivated fibre infrastructure became the physical backbone for streaming, cloud computing, and the modern internet economy. The infrastructure that bankrupted its original investors enabled the next era of economic value creation. Netflix, Amazon Web Services, and the entire cloud computing industry run on capacity that speculative capital overbuilt and the bust repriced to near zero.
The original investors were largely wiped out. The infrastructure endured.
British Railway Mania in the early-to-mid 1840s remains the cleanest historical case study in how civilisational value and investment returns can diverge completely. Speculative enthusiasm drove an explosion of new rail projects. Promoters secured parliamentary authorisation for lines that often had no realistic prospect of earning adequate returns.
The reckoning arrived in 1847, when a financial crisis linked to overextension in railway finance swept through British capital markets. Approximately one-third of authorised British railways were never built. Many of those that were completed failed to generate returns sufficient to justify the capital deployed.
| Period | Event | Financial outcome |
|---|---|---|
| Early-mid 1840s | British Railway Mania | Speculative explosion; one-third of authorised lines never built |
| 1847 | British financial crisis | Widespread losses linked to railway overextension |
| 1873 | US financial panic | Railroad overbuilding and fragile financing triggered panic |
| 1893 | Second US financial panic | Repeated railroad bankruptcies and reorganisations |
The pattern was not confined to Britain. In the United States, railroad overbuilding and fragile financing structures contributed directly to two of the century’s most severe financial crises: the panics of 1873 and 1893. Repeated bankruptcies and forced reorganisations destroyed investor capital across multiple cycles.
The dual reality is worth sitting with. Railways were central to US industrial expansion, integrating markets, reducing transport costs, and underpinning the country’s rise as a leading industrial power. The technology delivered on its economic promise. The investors who funded it, in large part, did not share in those returns.
The gap between a technology’s technical availability and its measurable productivity impact is one of the most consistent features of GPT history. It is also one of the least intuitive for investors accustomed to thinking in quarterly earnings cycles.
The mechanism is straightforward. Firms must redesign processes, invest in complementary capital and skills, and reorganise workflows around the new technology before macro-level gains appear. Simply substituting the new tool into an existing process captures only a fraction of its potential.
The NBER research on GPT diffusion cycles by Helpman and Trajtenberg formalises this two-phase dynamic, showing that general-purpose technologies characteristically depress real income during their initial diffusion period before the complementary investments and organisational changes required for broad productivity gains accumulate.
The electricity example makes this concrete. Early factories replaced their central steam engine with an electric motor, kept the same factory layout, and saw limited productivity improvement. The real gains arrived only once factories were physically reorganised around distributed electric motors, a process that took roughly 30 years from electricity’s technical introduction.
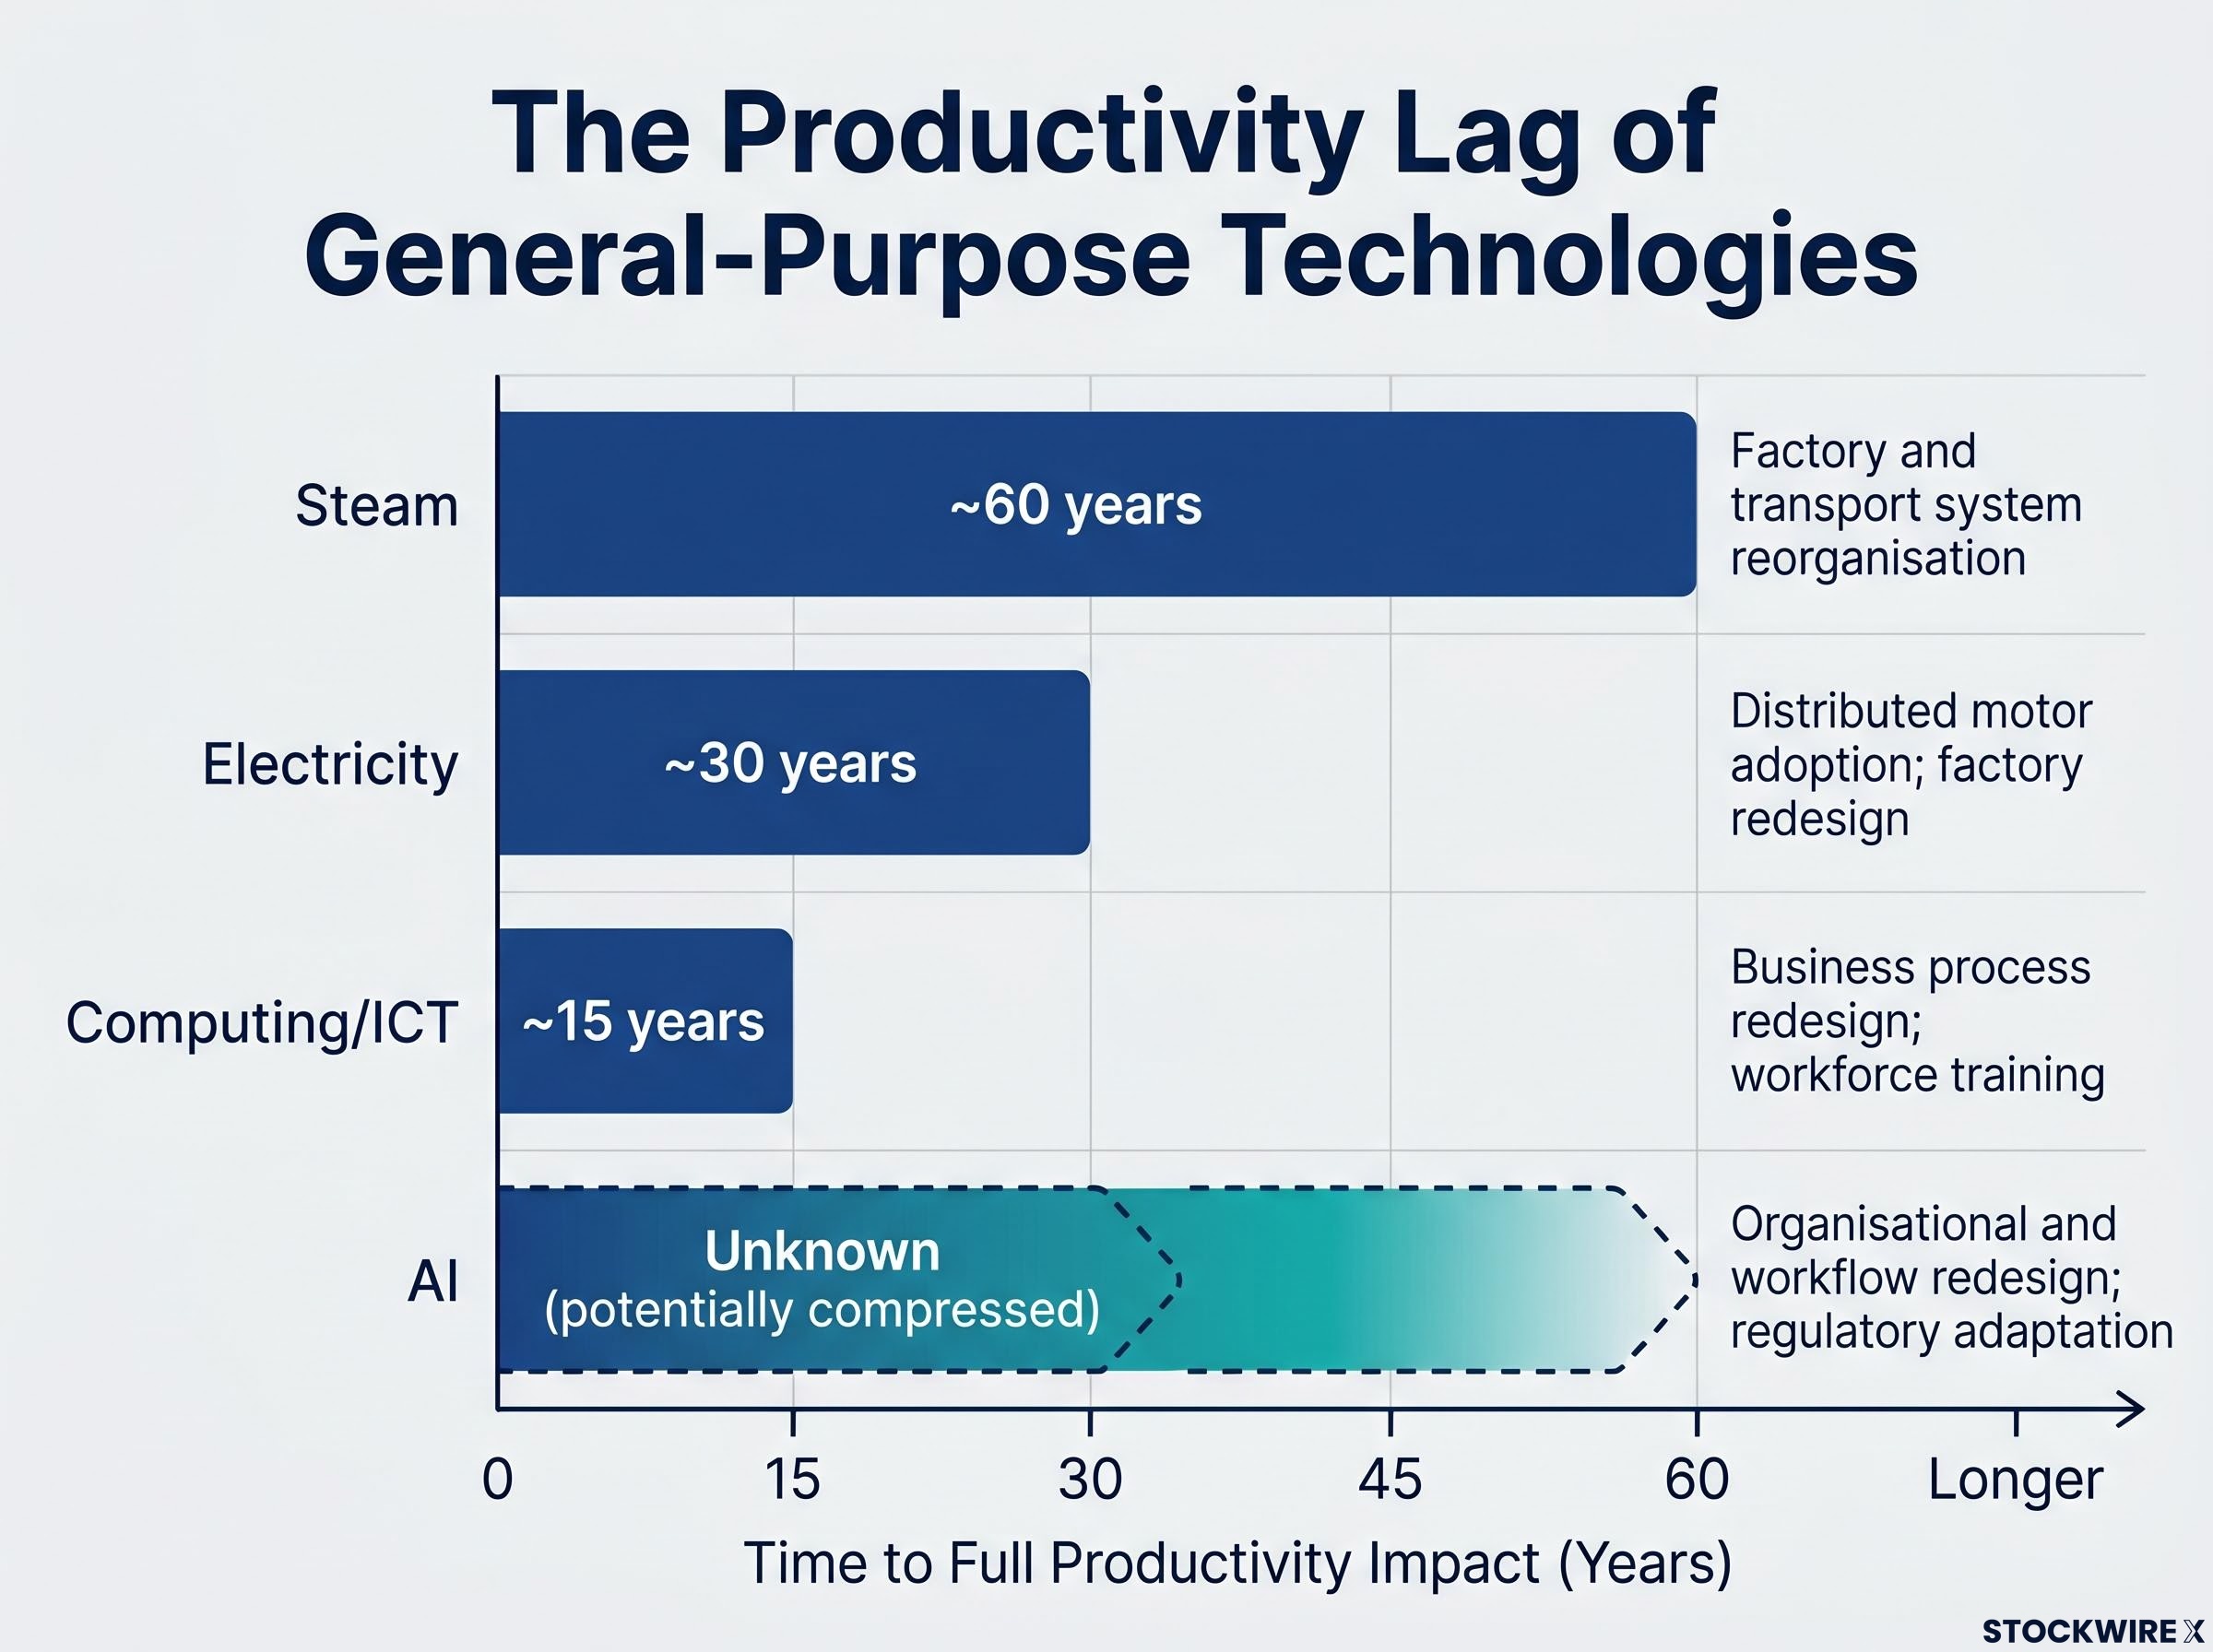
| Technology | Approximate productivity lag | Adoption friction |
|---|---|---|
| Steam | ~60 years | Factory and transport system reorganisation |
| Electricity | ~30 years | Distributed motor adoption; factory redesign |
| Computing/ICT | ~15 years | Business process redesign; workforce training |
| AI | Unknown (potentially compressed) | Organisational and workflow redesign; regulatory adaptation |
The trend suggests compression, from 60 years to 30 to 15. AI may compress the lag further given digital distribution advantages. But “further” still implies a significant gap between current capital deployment and realised productivity gains.
NVIDIA CEO Jensen Huang acknowledged internally that employees were using AI intensively in ways that consumed tokens without meaningfully improving productivity, framing early inefficient usage as normal technology adoption behaviour.
That admission is not a failure. It is the electricity-motor-in-the-old-factory stage of AI adoption. The gains require organisational redesign that has barely begun across most industries.
Enterprise AI adoption mirrors the electricity-motor pattern almost precisely: an estimated 70-80% of pilots fail or stall at the substitution stage, where the new tool is inserted into an unchanged process, while the small minority redesigning operations around AI are already projecting 3x the ROI of surface-level counterparts by 2027.
The current AI buildout exhibits characteristics consistent with prior GPT overbuild phases. Elevated asset prices in AI-adjacent equities, data centre construction running ahead of confirmed demand, chipmaking capacity expansion on speculative projections, and widespread enthusiasm that treats the technology’s long-run potential as near-term certainty: these are the same features visible in railways in the 1840s and fibre optics in the 1990s.
AI spending as a share of GDP has now surpassed the late-1990s dot-com peak, with US IT hardware and software investment reaching 4.9% in Q1 2026, a threshold that capital cycle analysts have historically associated with the later, more fragile stages of a technology investment wave.
The pattern fits strongly enough to take seriously as a risk framework.
Where the analogy breaks is in who is writing the cheques. The 1990s fibre-optic overbuild was funded by thinly capitalised carriers using speculative debt. When demand failed to materialise, the resulting defaults cascaded through credit markets.
The current AI buildout is predominantly funded by large, profitable incumbents deploying cash flow from strong balance sheets. That structural difference does not eliminate the risk of significant equity repricing; valuations can still compress if AI revenue growth disappoints. It does, however, reduce the likelihood of a cascading credit crisis.
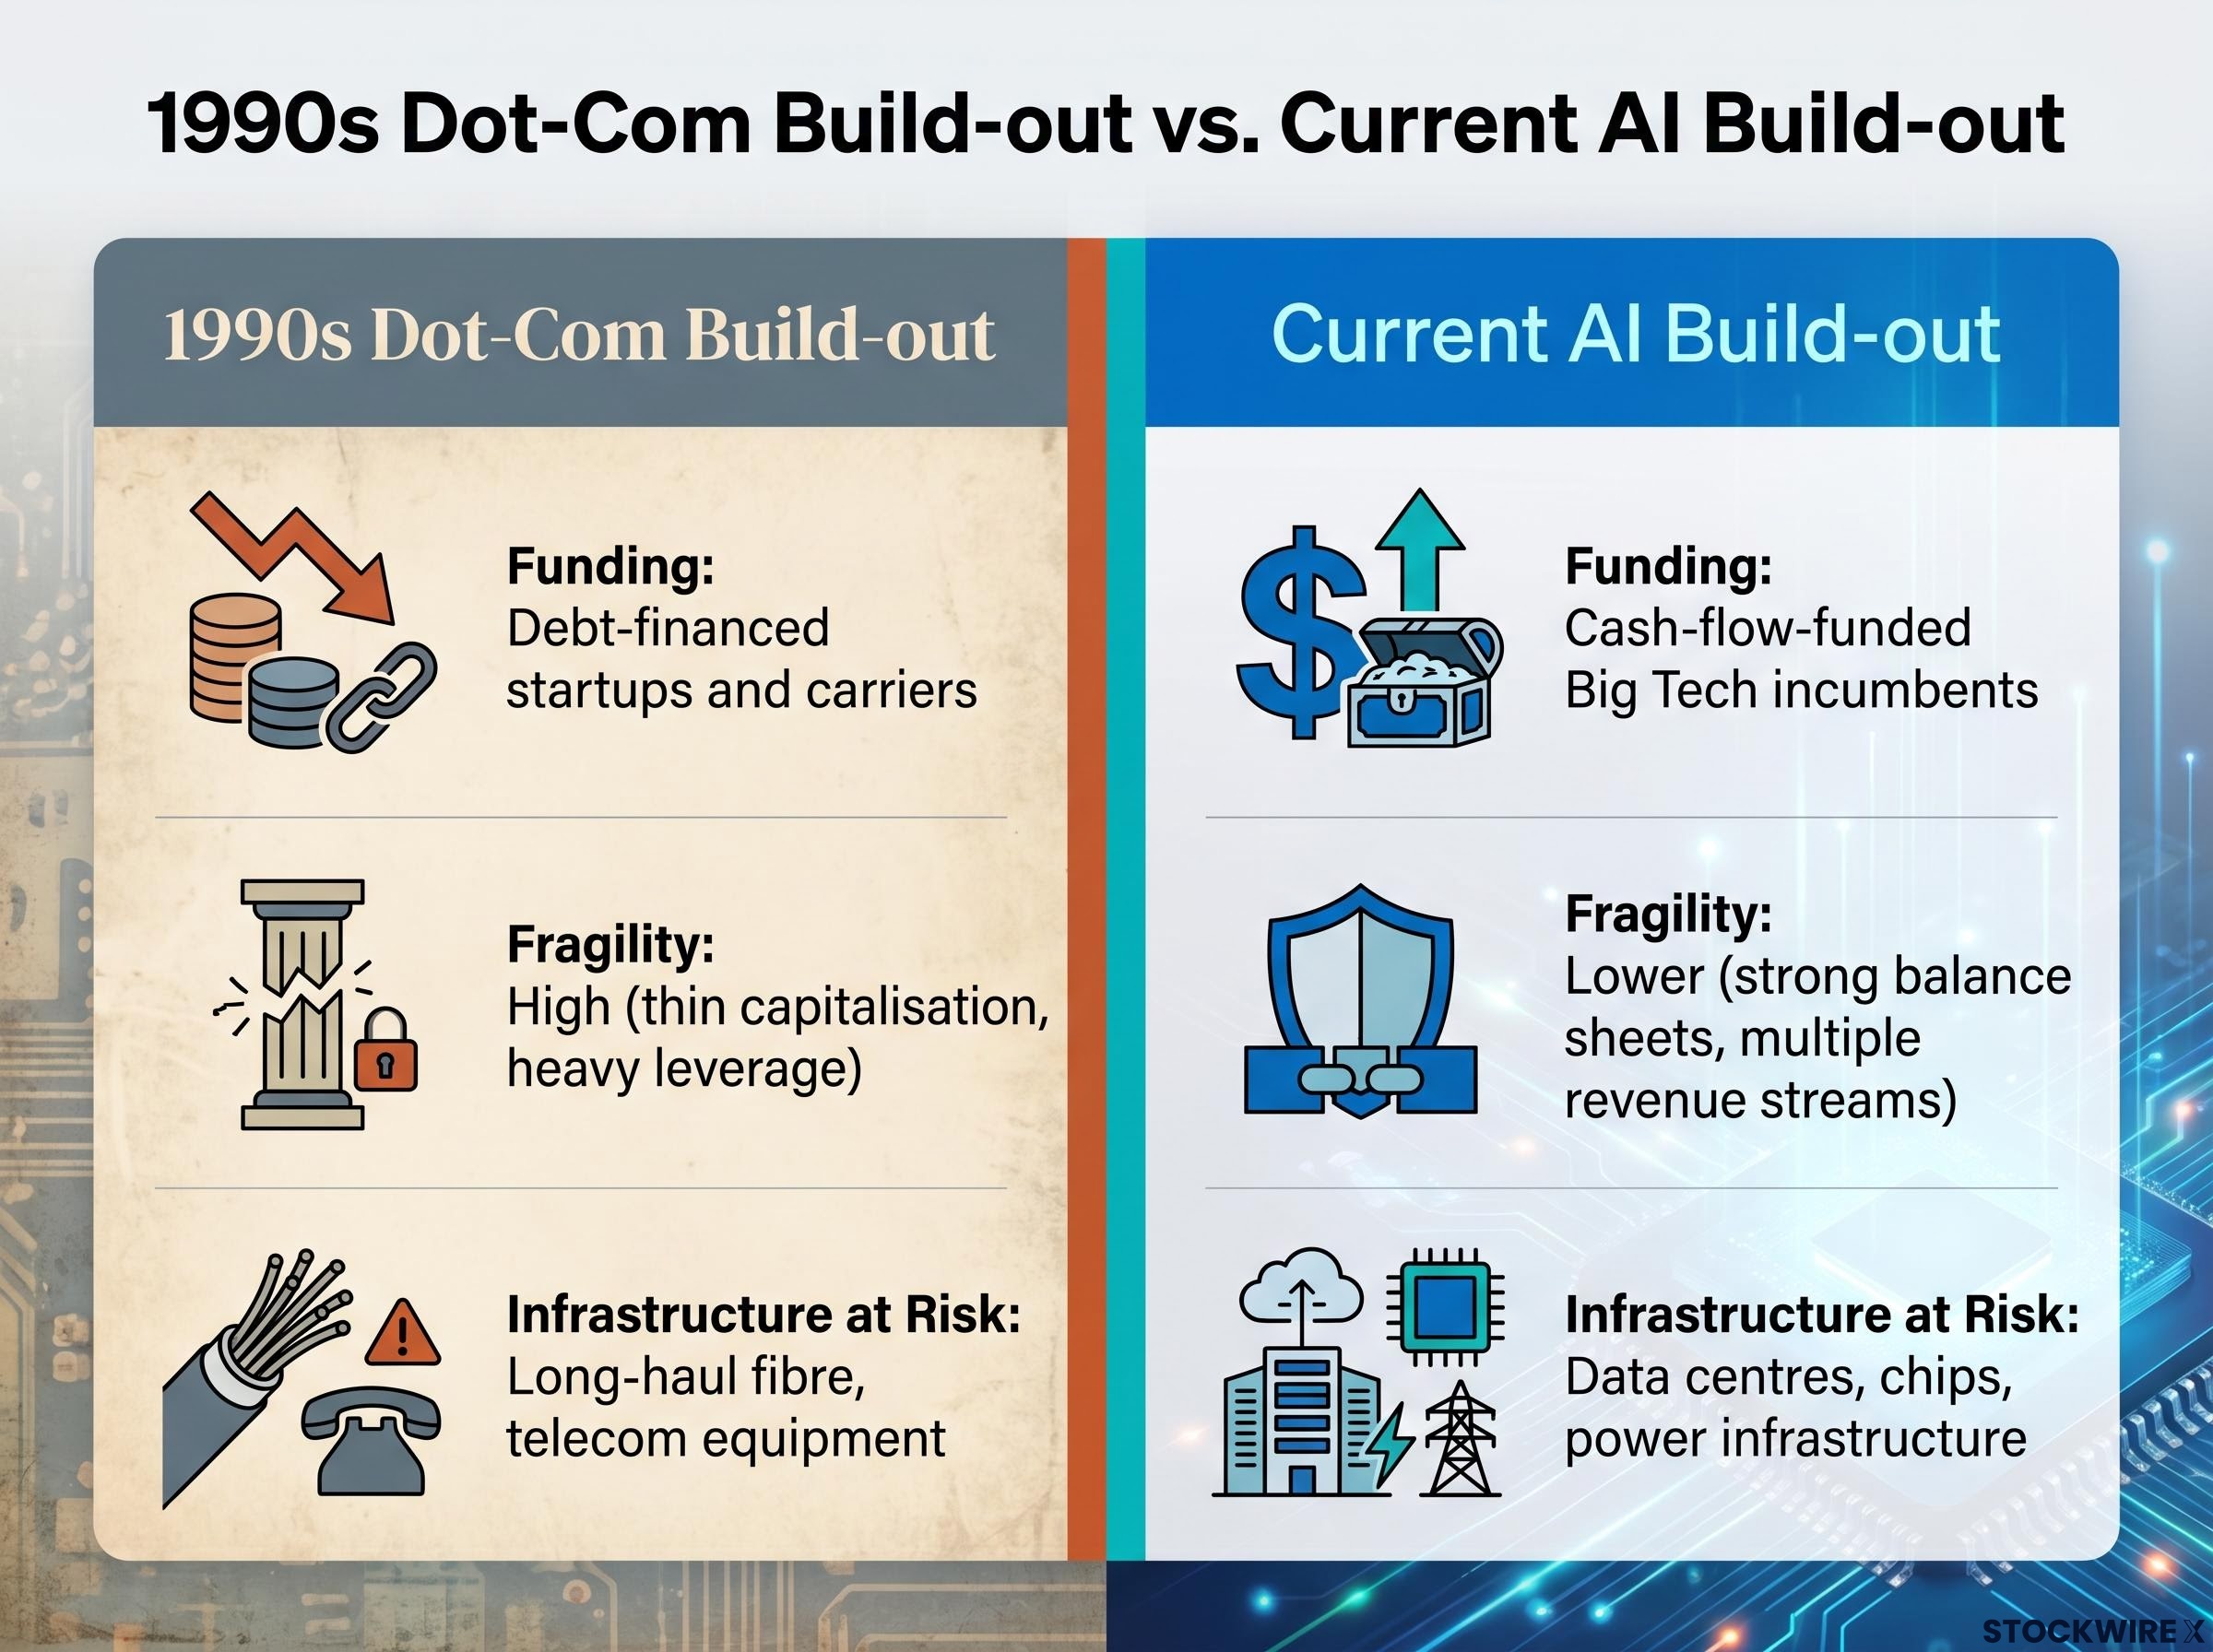
| Dimension | 1990s dot-com build-out | Current AI build-out |
|---|---|---|
| Funding source | Debt-financed startups and carriers | Cash-flow-funded Big Tech incumbents |
| Financial fragility | High; thin capitalisation, heavy leverage | Lower; strong balance sheets, multiple revenue streams |
| Demand certainty | Speculative projections | Early enterprise adoption visible but scale uncertain |
| Infrastructure at risk | Long-haul fibre, telecom equipment | Data centres, chips, power infrastructure |
Digital distribution, existing cloud infrastructure, and software-centric complements could compress the diffusion timeline relative to past GPTs. Organisational change and regulatory friction remain real constraints. The honest assessment is that the shape of a potential correction may differ from the dot-com collapse, even if some degree of overbuilding proves inevitable.
The historical record does not offer a timing signal. It offers a structural framework for thinking about exposure.
History suggests the application layer, where durable moats from data, integration, and network effects accumulate, is where the most scalable long-run value has historically concentrated.
Low index-level volatility in AI-heavy benchmarks is masking a dangerous distributional divergence, where large opposing moves by individual winners and losers cancel each other out, leaving investors exposed to single-stock risk they may believe they have diversified away through passive allocation.
The pattern established across three-quarters of historical GPT booms returns the reader to the paradox this piece opened with. The infrastructure being built today may power decades of economic value creation. That does not mean the investors funding it today will be the ones who benefit.
As journalist Derek Thompson framed it in his November 2025 newsletter, AI could be the railroad of the 21st century. The weight of that analogy cuts both ways. Railroads built nations. They also bankrupted the people who paid for the tracks.
The historical record does not argue against AI’s potential to reshape economies. It argues for separating the civilisational bet from the investment sizing decision. The orienting question is not whether AI will prove to be a general-purpose technology on the scale of electricity or computing. History suggests it likely will. The question is whether a given portfolio is sized to survive the correction that history says usually precedes that transformation.
Investors wanting to trace the downstream macro implications of uneven AI diffusion will find our full explainer on AI adoption and neutral interest rates, which examines how Goldman Sachs and JP Morgan project diverging equilibrium rate paths across fast and slow adopter economies and what that means for fixed income and equity discount rate assumptions over a 10-15 year horizon.
This article is for informational purposes only and should not be considered financial advice. Investors should conduct their own research and consult with financial professionals before making investment decisions. Past performance does not guarantee future results, and the historical patterns discussed are subject to variation based on market conditions and structural differences between technology cycles.
An AI tech bubble refers to a period of speculative overinvestment in artificial intelligence infrastructure and equities that outpaces near-term demand, similar to the 1990s fibre-optic overbuild and 1840s British Railway Mania, both of which destroyed enormous investor capital before delivering long-run economic value.
Carriers such as Global Crossing and Level 3 used speculative debt to overbuild fibre capacity, and when demand failed to materialise, approximately US$5 trillion in tech sector market value was wiped out between 2000 and 2002, with the NASDAQ falling roughly 78% from its peak.
Historical lags have been substantial: roughly 60 years for steam, 30 years for electricity, and 15 years for computing and ICT, with each lag driven by the need for complementary investments, workforce retraining, and organisational redesign before macro-level gains appear.
The 1990s overbuild was financed by thinly capitalised, heavily leveraged startups and carriers, creating cascading credit risk when demand disappointed; today's AI buildout is largely funded by large, profitable technology companies with strong balance sheets, which reduces systemic credit contagion risk even if equity valuations compress.
History suggests separating the long-run civilisational thesis from near-term portfolio sizing: investors who held concentrated positions through prior GPT busts suffered permanent capital losses, while those who sized for survival through volatility preserved the ability to benefit from the eventual productivity arc.