Piper Sandler Says the US Fiscal Crisis Has Already Begun
56 mins ago

North American companies report a 70% AI usage rate; Asia-Pacific trails at 63%. That seven-point gap looks modest today. Bank of America projects it will compound into one of the most consequential macroeconomic divergences of the coming decade.
A growing body of research from the IMF, BIS, Goldman Sachs, JP Morgan, and PIMCO now converges on a striking implication: uneven AI adoption is not just a competitiveness story. It is a rates story. Economies that move quickly on AI are expected to generate investment-driven upward pressure on neutral interest rates. Economies that lag may see no comparable shift. For investors managing international portfolios, rate-sensitive assets, or currency exposure, the geographic distribution of AI adoption is increasingly material.
This analysis maps the adoption gap as it currently stands, explains the mechanism connecting AI adoption to neutral interest rates, identifies which economies sit on which side of the divide, and translates the findings into specific portfolio positioning implications.
Bank of America’s May 2026 thematic research puts global AI usage at 64% of organisations, with North America at 70%, EMEA at 65%, and APAC at 63%. McKinsey’s 2025 survey broadly corroborates those figures, placing North America at approximately 70% and Europe in the mid-60s percent range.
The averages, however, flatten a more uneven reality. Within APAC, China and Singapore sit well above the regional figure, while much of South and Southeast Asia remains far below it. Within Europe, the Nordics, the Netherlands, Ireland, and the UK are consistent outliers, with enterprise AI adoption exceeding 35-40% of firms in information-intensive sectors according to the OECD’s 2024 AI Outlook. Meanwhile, European Commission data from 2024 show fewer than 10-15% of EU SMEs report using AI tools in several sectors.
| Region | Adoption Rate | Leaders | Laggards |
|---|---|---|---|
| North America | 70% | US (Big Tech, deep VC ecosystem) | Few significant laggards |
| Europe / EMEA | 65% | Nordics, Netherlands, Ireland, UK | Southern and Eastern Europe |
| Asia-Pacific | 63% | China, Singapore, South Korea, Taiwan | South and Southeast Asia |
| Global | 64% | US, China, Singapore, Nordics | Most EMEs, EU SME sector |
North America’s lead rests on structural advantages:
For macro investors, the within-region divergence is where the actionable signal sits. Regional averages will systematically misread which specific economies are positioned to benefit from AI-driven structural tailwinds.
Task-level impact: Bank of America reports a 55% productivity uplift in software development and 40% in writing-related tasks from AI tools.
Those task-level results have not yet translated to the macro level. Economy-wide productivity is currently expanding at just 0.1% annually, according to Bank of America’s May 2026 research. The gap between micro-level gains and macro-level outcomes is wide, and it is structural.
Four barriers explain the disconnect:
Headline adoption rates, however, conflate surface-level deployments with genuine operational embedding; enterprise AI adoption that reaches the infrastructure layer, where unified data systems feed self-improving models, represents only 12-20% of firms according to converging research from Gartner, McKinsey, and Forrester, and this distinction matters enormously for projecting which economy’s productivity numbers will actually move.
Bank of America projects AI could add approximately 1 percentage point to annual global growth over the next decade, potentially lifting the rate from roughly 3.5% to approximately 4.5%. Goldman Sachs’s May 2024 estimate is more aggressive: generative AI could raise global labour productivity by approximately 1.5 percentage points per year over a ten-year adoption window.
The IMF’s April 2025 World Economic Outlook warns that economies without policy support on skills and infrastructure risk falling into a “low-innovation trap,” where the micro-level gains never compound into macro-level growth.
This gap is not evidence that AI’s economic impact is overhyped. It is the gap that makes the divergence between fast and slow adopters so consequential over a decade-long horizon, and the central reason the story has not yet been fully priced into rate markets.
The neutral interest rate, often denoted r*, is the rate at which monetary policy is neither stimulating nor restraining growth. It is determined largely by expected productivity growth and investment demand across an economy.
When AI adoption raises expected productivity, it increases the anticipated returns on capital investment. That higher expected return draws more business investment, which bids up the price of capital in the adopting economy. The BIS’s March 2024 Quarterly Review describes this directly: a major AI productivity shock would “raise equilibrium interest rates in economies at the technological frontier by boosting investment demand.” The IMF’s April 2024 analysis flags AI-driven productivity as a potential upside risk to r* in advanced economies that adopt quickly.
The BIS Quarterly Review on AI and natural rates establishes the transmission channel directly: a major AI productivity shock raises equilibrium interest rates in frontier economies by boosting investment demand, providing the foundational empirical grounding for the divergence thesis that drives current institutional portfolio positioning.
ECB Executive Board member Isabel Schnabel stated in March 2025 that if AI delivers sizeable productivity gains, “the natural rate of interest in advanced economies at the technology frontier could rise as firms increase investment to adopt AI,” while “economies where AI adoption remains slow may not experience a similar upward shift in r-star and could see interest rate differentials vis-à-vis the US widen.”
Goldman Sachs’s May 2024 research projects US neutral real rates could be 25-50 basis points higher over the next 10-15 years under a meaningful AI adoption scenario. JP Morgan’s October 2024 analysis arrives at a similar range: AI could lift US equilibrium real rates by 30-60 basis points over the next decade versus a no-AI baseline.
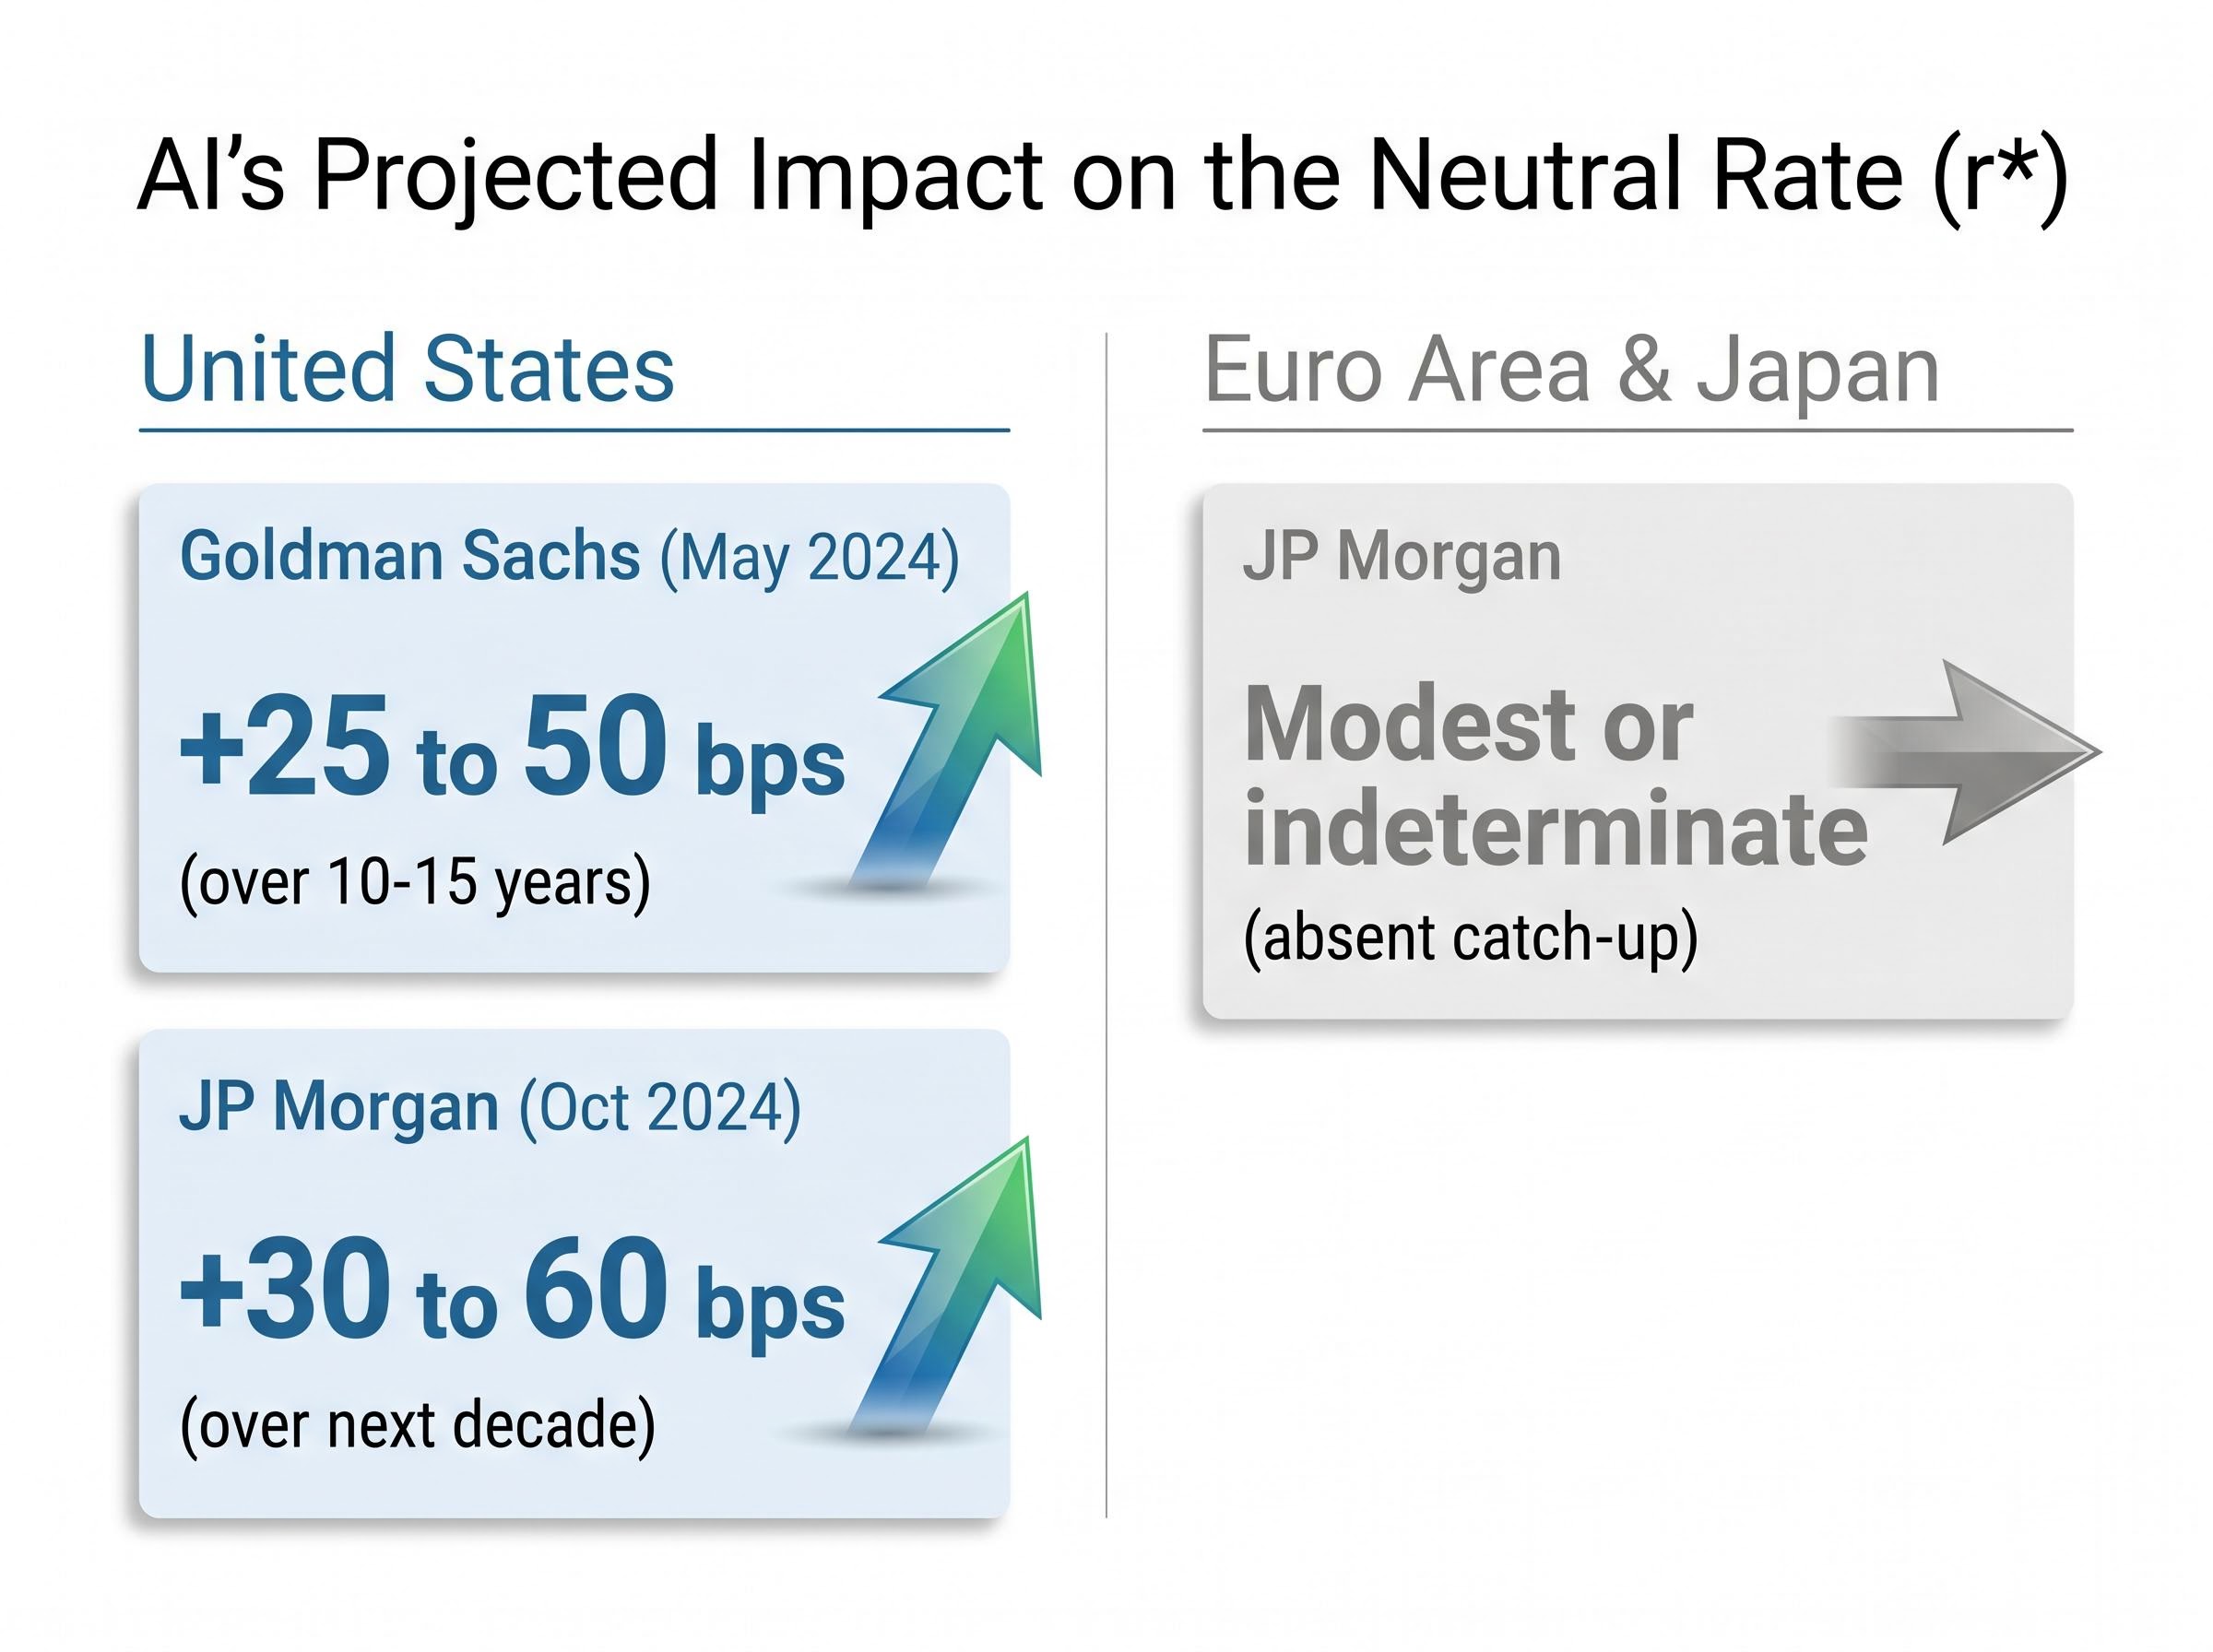
Bank of America’s directional view aligns with these estimates, projecting upward r pressure in early-adopting economies, though the bank has not published a precise basis-point figure. For the euro area and Japan, JP Morgan describes the r impact as “modest or indeterminate” absent catch-up in adoption and structural reform. This is the analytical hinge: today’s adoption survey data is feeding directly into tomorrow’s neutral rate differentials across sovereign bond markets.
The mechanism translates into a specific geographic map. Bank of America’s May 2026 research projects that early-adopting economies, including the US and China, could see neutral rates pushed higher by AI-driven investment demand, while “in slower-adopting regions we do not expect a comparable upward shift in neutral rates in this decade.”
| Economy / Region | Adoption Tier | Expected r* Direction | Key Caveat |
|---|---|---|---|
| United States | Frontier | Upward (+25-60 bps) | Valuation and regulatory risk |
| China | Frontier | Upward (magnitude uncertain) | US chip export controls constrain advanced capability |
| Nordics, Netherlands, Ireland, UK | Frontier | Moderately upward | Smaller economies; r* partially imported from ECB/global conditions |
| Singapore, South Korea, Taiwan | Frontier | Upward | Hardware-weighted; consumer AI adoption varies |
| Continental Europe (south/east) | Lagging | Flat to minimal shift | SME digitisation gap; EU AI Act uncertainty |
| Emerging Markets (broad) | Lagging | No comparable shift expected | Infrastructure and skills deficits; AI investment below 1% of GDP |
China’s position requires individual assessment. Bloomberg reported in January 2025 that Chinese AI infrastructure and data-centre investment reached the equivalent of more than $50 billion in 2024 despite US chip export controls. China is an AI powerhouse in consumer AI, computer vision, and industrial applications, but constrained access to the most advanced semiconductor nodes creates a more complex r* outlook than a simple “frontier” label implies.
China’s AI investment timeline adds a further layer of complexity to the frontier classification: while Chinese AI infrastructure spending exceeded $50 billion in 2024, Morgan Stanley’s CIO survey data shows 47% of Chinese technology buyers are targeting 2027 for initial AI project rollouts, driven by GPU supply constraints and domestic compute readiness gaps that push meaningful revenue recognition roughly 12 months beyond current market pricing.
OECD analysis from November 2025 suggests countries lagging on AI adoption may see potential growth rates undershoot the OECD average by 0.3-0.6 percentage points annually over 10-15 years. The divide is not simply US-versus-everyone-else; it runs within regions, and it is the within-region leaders that will drive the rate differentials that matter for multi-asset portfolio construction.
Europe’s within-region divide carries a mirror-image implication for equity investors: the same HSBC framework that identifies Nordic and Irish outperformance also maps AI disruption risk across nearly 2,000 business categories, with Austria facing a projected 30% revenue loss under the severe scenario and broader European indices flipping sharply negative once financial services and healthcare software disruption is included.
Three positioning themes emerge from the framework, each grounded in institutional research. These are decade-horizon structural views, not near-term tactical calls, and adoption timelines carry significant uncertainty.
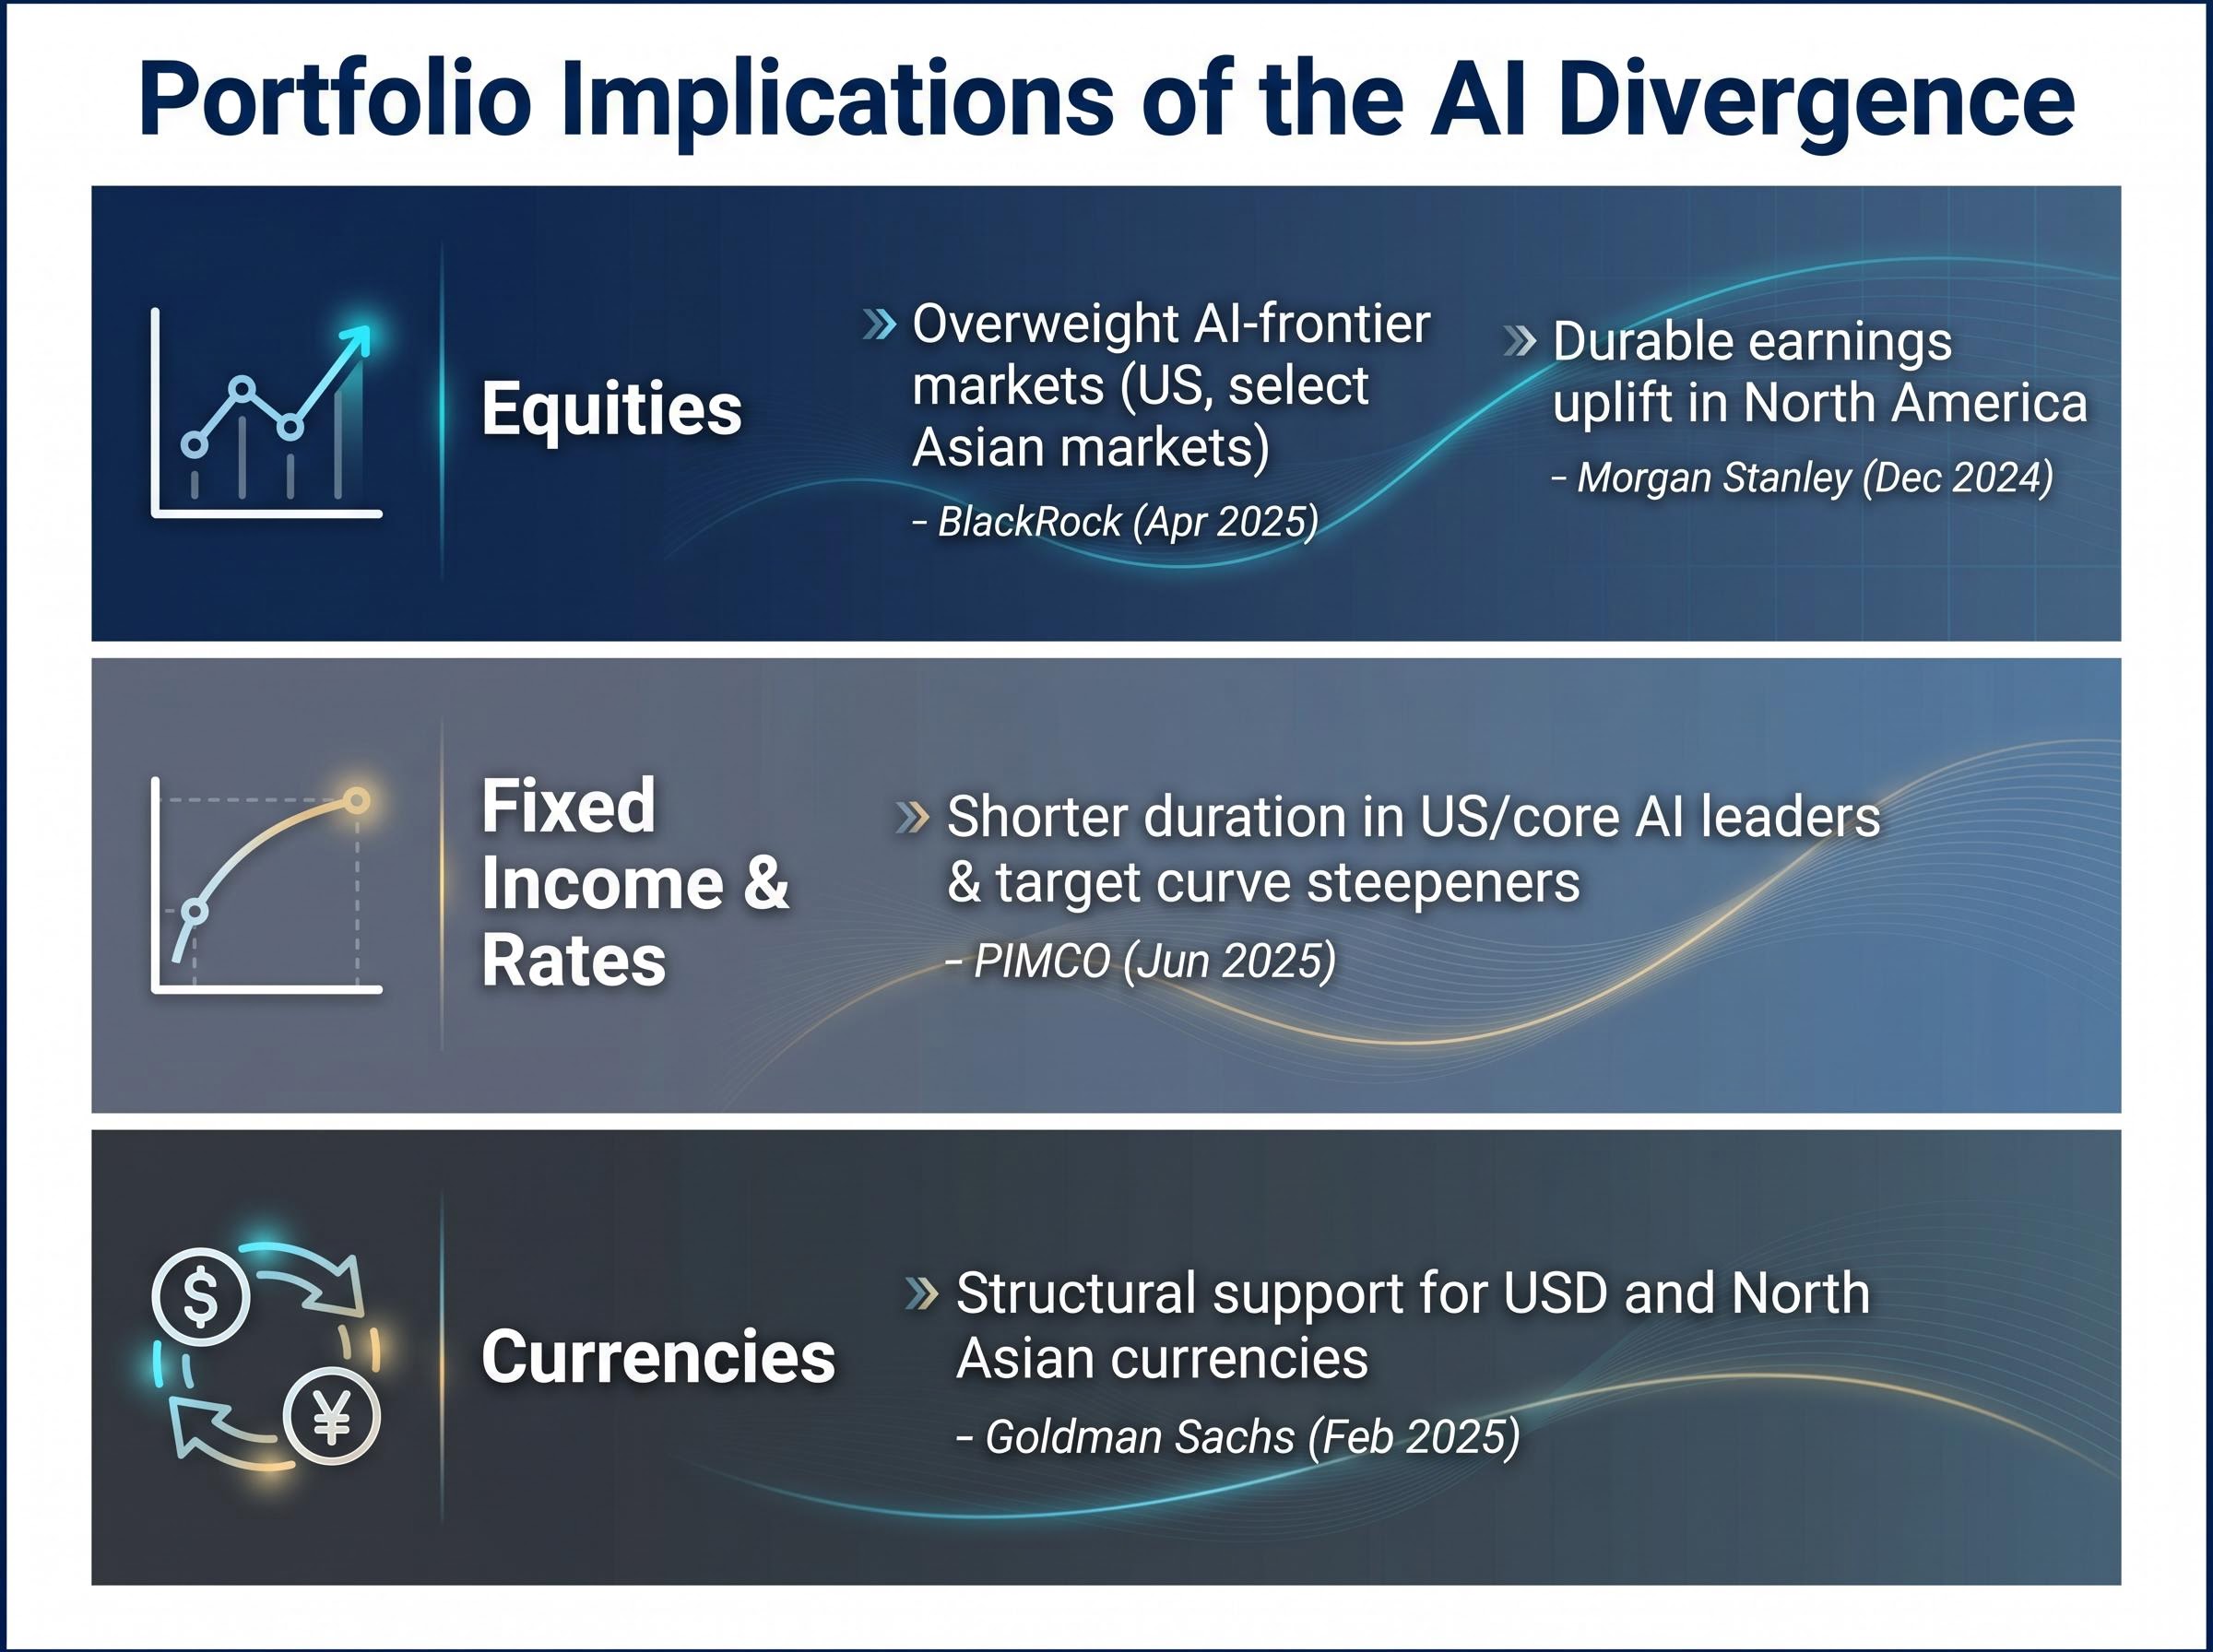
PIMCO’s June 2025 secular outlook recommends somewhat shorter duration in US and core AI-leading sovereigns and highlights curve steepener opportunities where AI-driven capex and productivity raise long-term yields more than central banks initially raise short rates.
Investors wanting to translate the AI divergence thesis into a complete multi-asset framework will find our full explainer on regime-aware portfolio construction, which covers Bridgewater Co-CIO Bob Prince’s analysis of AI and modern mercantilism as twin structural forces, the breakdown of the traditional 60/40 portfolio under sticky inflation and positive equity-bond correlation, and the institutional consensus on real assets, alternatives, and active currency hedging as structural responses.
The barriers defining the laggard position are structural, and they differ by region.
Europe:
Emerging markets:
Closing the gap would require digital infrastructure investment at scale, skills and retraining programmes, AI governance frameworks that support rather than constrain deployment, and deeper capital markets for AI-related financing.
The gap is compounding. Bank of America’s projection that early adopters will sustain productivity advantages over time implies that the macro divergence in r* and growth is front-loaded in uncertainty but back-loaded in impact. The ECB’s research warns that the euro area’s slower AI uptake could “cement a structural productivity gap vis-à-vis the United States” without policy action.
If a lagging economy credibly closes the adoption gap, the r* and growth outlook would shift in ways that reverse some of the portfolio positions outlined above. Understanding what closing the gap requires is therefore not academic; it is a stress test for the divergence thesis. Investors who wait for the divergence to be fully visible in GDP data before repositioning are likely to be late.
Regional AI adoption gaps are not soft competitiveness indicators. They are the early-stage inputs to the neutral rate differentials that will define global rate markets over the next decade. The mechanism connecting a corporate adoption survey to a structural shift in sovereign bond yields is understood; the estimates from Goldman Sachs, JP Morgan, the BIS, and the ECB point in the same direction, even where the precise magnitudes differ.
The portfolio implications span equities, duration, curve positioning, and currency exposure. The divergence is durable, but not immutable. Adoption timelines, policy responses, and AI capability trajectories all carry uncertainty; investors should hold these positions as structural tilts rather than high-conviction short-horizon bets.
This article is for informational purposes only and should not be considered financial advice. Investors should conduct their own research and consult with financial professionals before making investment decisions. Past performance does not guarantee future results. Financial projections are subject to market conditions and various risk factors.
The neutral interest rate (r*) is the rate at which monetary policy neither stimulates nor restricts growth; when AI adoption raises expected productivity, it increases anticipated returns on capital investment, which boosts business investment demand and pushes r* higher in adopting economies.
North America leads at 70% organisational AI usage, followed by EMEA at 65% and Asia-Pacific at 63%; within those regions, the US, China, Singapore, and the Nordic countries are frontier adopters, while most emerging markets and Southern and Eastern Europe are lagging significantly.
Goldman Sachs projects US neutral real rates could be 25-50 basis points higher over the next 10-15 years under a meaningful AI adoption scenario, while JP Morgan estimates a 30-60 basis point lift versus a no-AI baseline over the next decade.
PIMCO's June 2025 secular outlook recommends somewhat shorter duration in US and core AI-leading sovereigns and highlights curve steepener opportunities, as AI-driven capital expenditure and productivity are expected to raise long-term yields more than central banks initially raise short rates.
Bank of America reports 55% productivity gains in software development at the task level, but economy-wide productivity is expanding at just 0.1% annually because of integration friction, skills shortages, regulatory constraints, and the fact that only 12-20% of firms have embedded AI at the infrastructure layer where gains compound into macro-level outcomes.