
Why an 11% Yield Fund Left Investors $20,000 Behind
10 hrs ago
Not all S-REITs are created equal in 2026, and the gap between the best and worst-positioned sub-sectors is widening in ways that matter directly to distribution stability and total return. Singapore’s REIT market has matured into a genuinely differentiated landscape where property type, asset quality, geographic diversification, and the structural forces reshaping how space is used are pulling sub-sectors in sharply different directions. A blanket “buy REITs for yield” posture misses the real decision facing investors: which property fundamentals are working right now, and which are working against them. This analysis maps the structural tailwinds and headwinds across every major S-REIT sub-sector, drawing on property fundamentals research to identify where underlying real estate is positioned for strength, where cyclical risk is elevated, and where the added complexity of overseas portfolios changes the calculus.
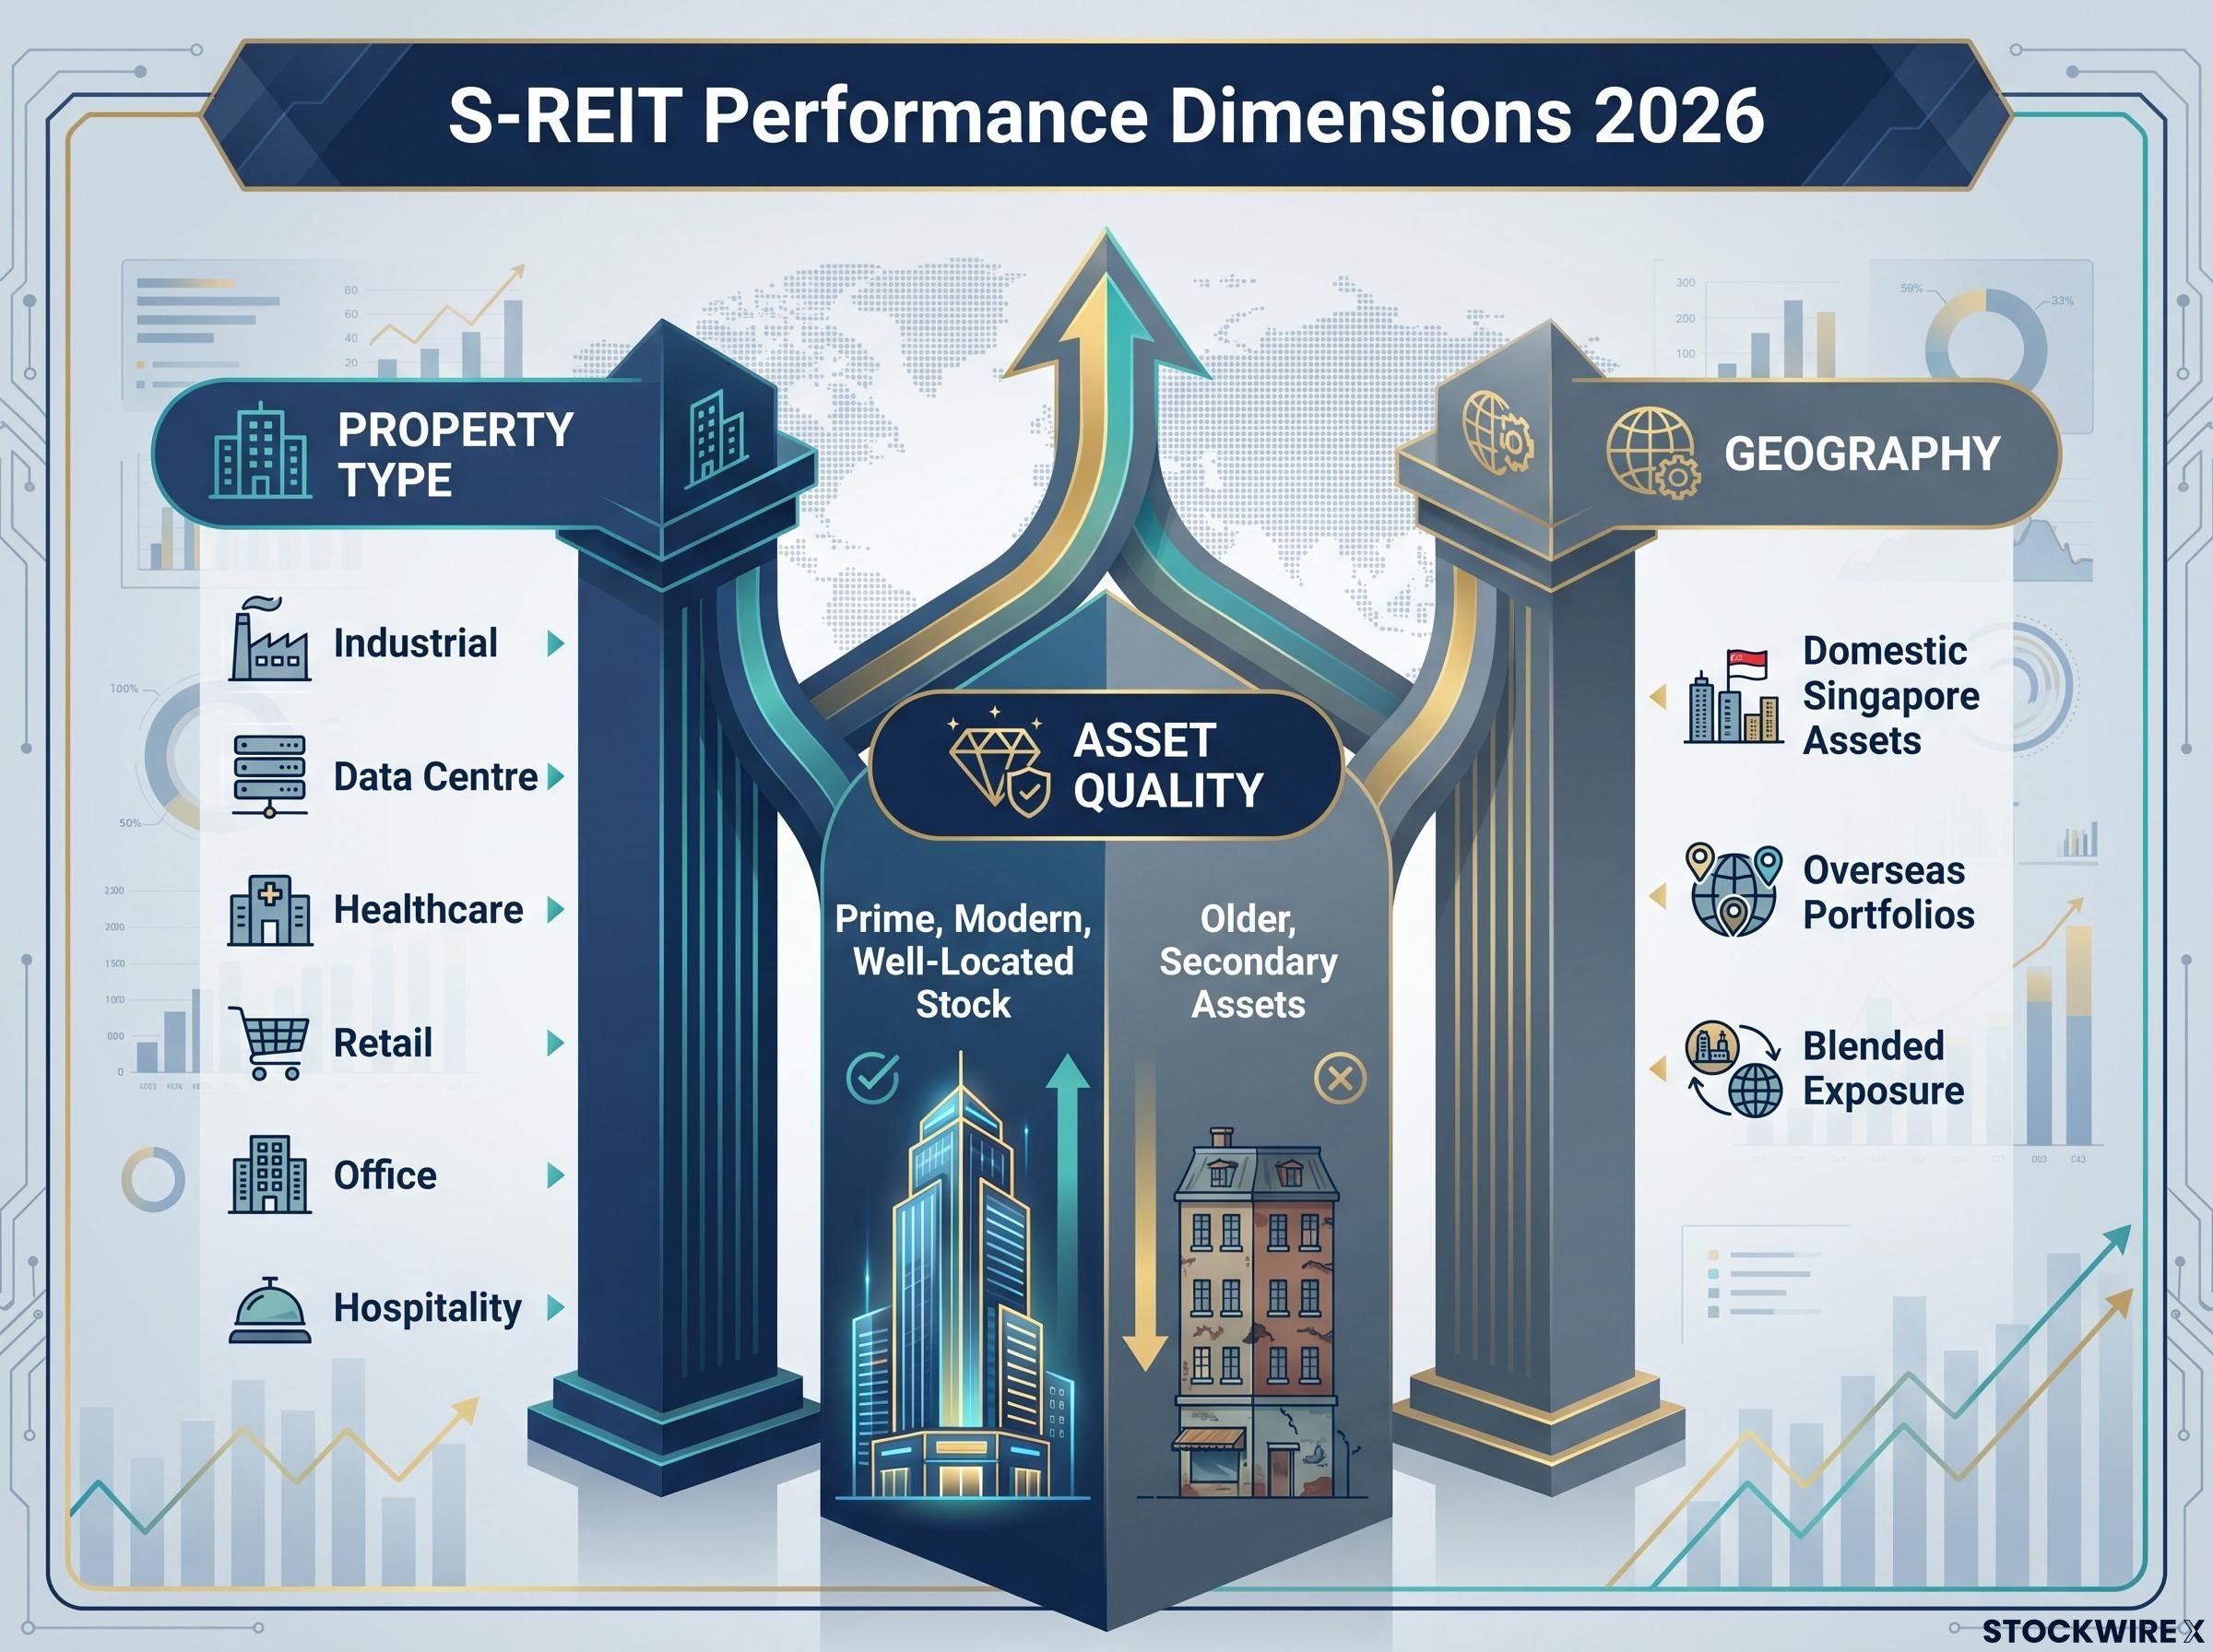
S-REITs are not a single asset class. They are a matrix of three intersecting dimensions, and performance in 2026 is diverging along each one:
High occupancy rates across major S-REITs continue to support rental income predictability, but that aggregate picture conceals meaningful variation beneath the surface. Two REITs carrying the same sector label can deliver very different distribution trajectories depending on where they sit across these three dimensions.
Sub-sector fundamentals do not operate in isolation from the broader rate environment; the interest rate transmission channels that connect monetary policy to REIT valuations, including the discount rate effect on future cashflows, debt financing costs, and yield competition with government bonds, shape the absolute return environment within which sub-sector tilts play out.
The distinction between structural and cyclical headwinds shapes the appropriate investor response. Structural forces, such as e-commerce substitution eroding physical retail demand or hybrid work reducing office space requirements per employee, affect long-term demand curves. These headwinds are harder to recover from and require selective allocation within challenged sub-sectors.
Cyclical headwinds, such as a tourism slowdown or a temporary pullback in corporate travel, affect near-term earnings but can reverse with the macro environment. Sub-sectors exposed primarily to cyclical risk may offer contrarian opportunity when pricing compensates sufficiently for that volatility. The investor who conflates the two is likely to either overpay for stability or avoid genuinely compensated risk positions.
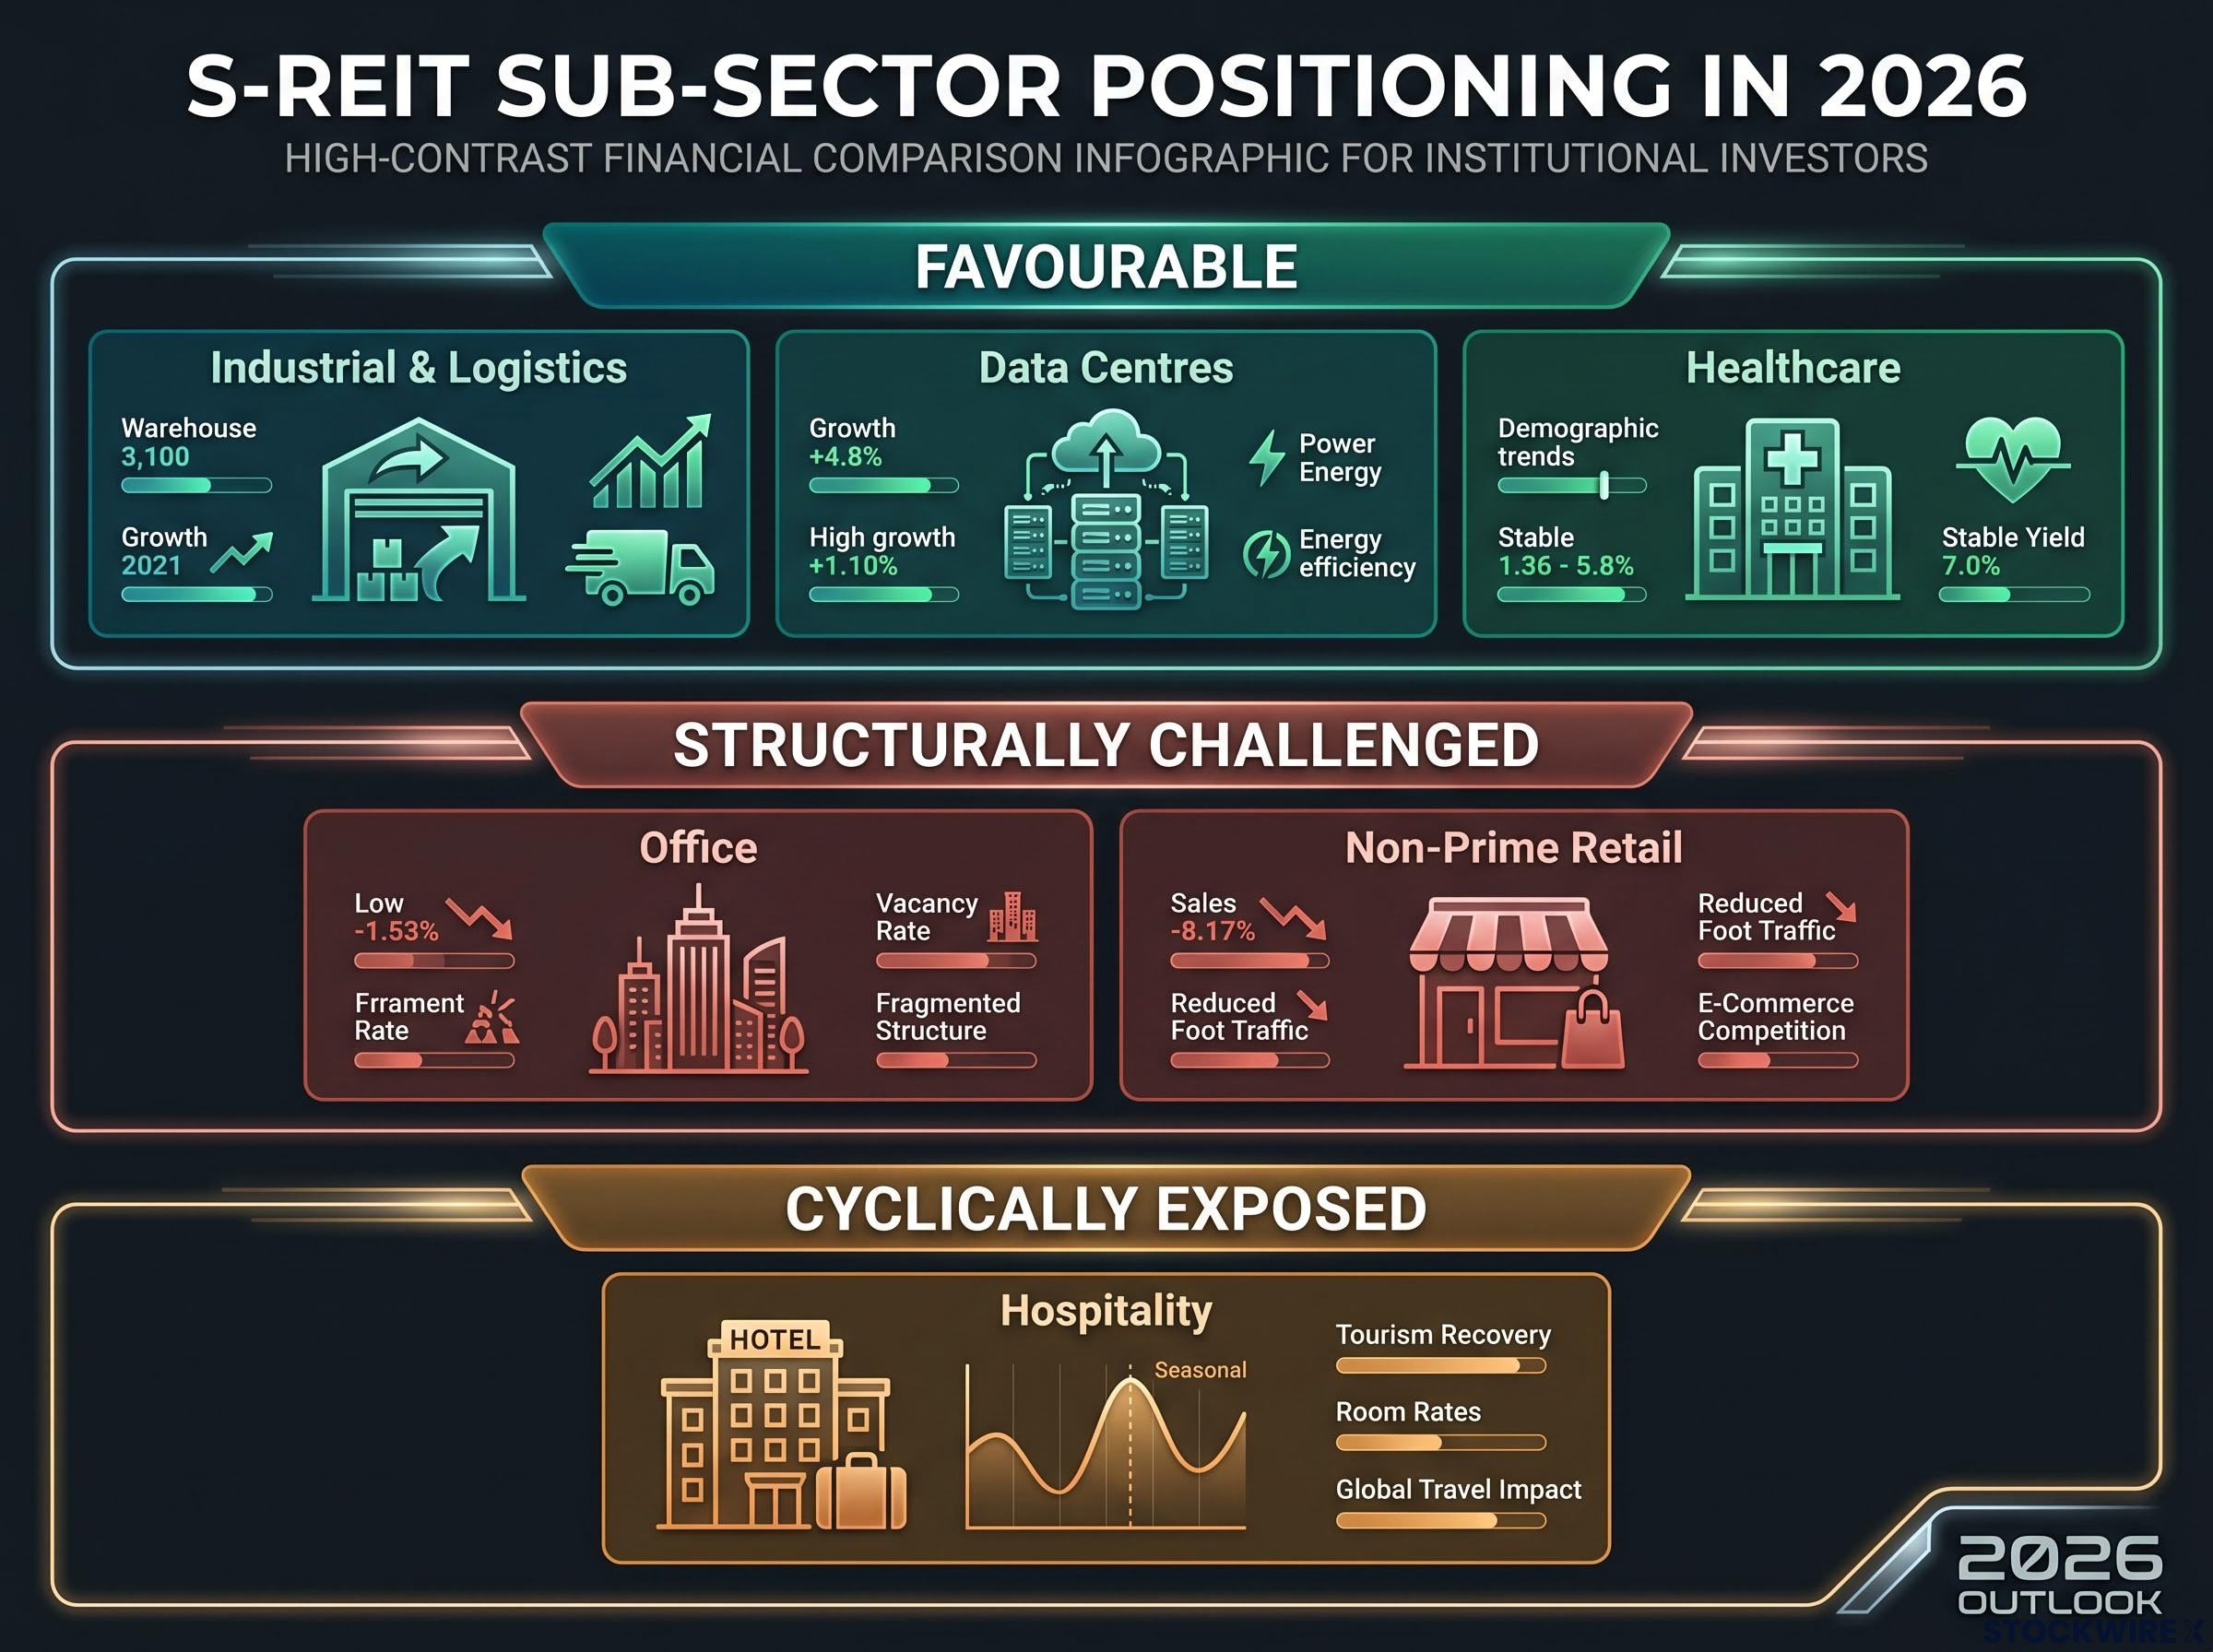
Three S-REIT sub-sectors carry the clearest structural advantages heading into the second half of 2026, though each tailwind operates through a distinct demand mechanism.
Industrial and logistics REITs occupy the strongest position. Demand is underpinned by sustained e-commerce volumes, supply chain reconfiguration favouring regional hubs like Singapore, and near-shoring trends that have increased appetite for modern logistics facilities. According to research from PhillipCapital, these drivers represent a “new normal” rather than a one-off pandemic spike, which supports durable occupancy and landlord pricing power on lease renewals.
Data centre REITs benefit from accelerating cloud computing adoption, AI workloads, and general data growth. Singapore’s position as a regional data hub supports long-term leasing from hyperscalers and enterprise customers. The constraints here are real, however: power availability, government policy on new data centre land, and energy allocation all shape the domestic growth ceiling. These same constraints, notably, reinforce the pricing power of existing assets.
Healthcare REITs anchor the defensive end of the spectrum. Ageing populations across Singapore and Asia-Pacific provide a durable demand floor, while long-lease structures with healthcare operators deliver visible, predictable cashflows. This is a compounding story, not a high-growth one; the floor is firm, but the ceiling is relatively modest compared with the strongest industrial and data-centre names.
Singapore Ministry of Health ageing projections indicate the country is on track to attain super-aged status in 2026, with one in four citizens expected to be aged 65 or above by 2030, a demographic trajectory that underpins the durable demand floor for healthcare REIT operators across the region.
| Sub-Sector | Core Demand Drivers | Key Risk to Watch |
|---|---|---|
| Industrial & Logistics | E-commerce, supply chain reconfiguration, near-shoring | Older, low-spec stock lagging high-spec peers |
| Data Centres | Cloud computing, AI workloads, regional data hub status | Power and land constraints; government policy risk |
| Healthcare | Ageing demographics, long-lease structures | Relatively modest growth ceiling |
Sub-sector tailwinds are not uniformly distributed across all assets within a category.
Modern, high-spec logistics assets are capturing the structural tailwind; older, low-spec stock risks lagging on rent growth and incentives.
The industrial tailwind is concentrated in high-tech, high-spec facilities serving advanced manufacturing and technology tenants. Data-centre growth may increasingly flow to offshore locations as domestic capacity constraints bind. Healthcare stability depends on long lease duration and operator quality. Within each winner, asset selection still determines whether the structural tailwind translates into actual distribution performance.
Suburban retail carries a reputation problem it may not entirely deserve. The broader “retail” label conjures images of e-commerce disruption and falling foot traffic, but community-embedded malls anchored by necessity tenants tell a different story.
The resilience rests on three specific conditions:
According to PhillipCapital research, domestic everyday spending provides a more reliable demand base than discretionary or tourist-dependent revenue streams.
Retail occupancy dynamics in comparable markets support this reading: suburban and convenience-anchored retail formats operating at near-full occupancy are achieving positive leasing spreads at renewal, demonstrating that the necessity-anchor model translates into measurable landlord pricing power rather than merely resilient footfall.
The upside ceiling is honest, though. Competition for prime suburban nodes limits expansion opportunities, rent push capacity is constrained without overburdening tenants, and fully built-out catchments offer limited incremental growth. For investors seeking distribution stability rather than capital appreciation, this profile may be underappreciated relative to the more talked-about industrial and data-centre themes.
The relevant question is not “retail versus other sectors.” It is whether a specific asset has the location, tenant mix, and catchment characteristics that support resilient footfall. Community-anchored daily-needs suburban malls sit in a fundamentally different position from discretionary destination malls in weaker locations, which face structural headwinds from e-commerce substitution and shifting consumer behaviour.
The structural analysis above operates within a market that provides investors with unusually reliable visibility into REIT financial performance and portfolio quality. Singapore’s regulatory framework, overseen by the Monetary Authority of Singapore (MAS), establishes three governance mechanisms that support investor analysis regardless of sub-sector:
The MAS leverage requirements for REITs, updated in November 2024, set a single aggregate leverage limit of 50% and a minimum interest coverage ratio of 1.5 times, alongside enhanced disclosure obligations that give investors a clearer view of balance sheet risk across the S-REIT universe.
Regulatory caps on leverage help ensure S-REIT balance sheets remain comparatively conservative relative to many international property markets.
These mechanisms do not eliminate sub-sector risk. An office REIT facing structural demand headwinds still faces those headwinds regardless of how well it is governed. What the framework does provide is confidence that the financial data investors use to assess each sub-sector position is reliable, and that excessive balance-sheet risk-taking is structurally constrained.
Three sub-sectors face the most pronounced headwinds in 2026, but the nature of each headwind, and the appropriate investor response, differs meaningfully.
Office REITs are navigating a demand reset, not a collapse. Hybrid work continues to drive space rationalisation, with many occupiers requiring less space per employee than pre-pandemic norms. The headwind is concentrated in secondary and fringe locations, where vacancy rates are higher and leasing activity slower.
What matters is not just that an office REIT owns CBD assets, but whether those assets have transit connectivity, modern specifications, and credible green credentials.
Prime Grade-A CBD stock with strong amenities and sustainability credentials is relatively more resilient, reflecting a pronounced flight-to-quality dynamic. The challenge for investors is that rent growth forecasts carry higher uncertainty over multi-year horizons, even for well-positioned portfolios.
Hospitality REITs represent high-beta cyclical exposure rather than a structurally impaired sector. Earnings are tied directly to visitor arrivals, room rates, and travel sentiment. Recovery can be derailed by regional slowdowns, geopolitical shocks, or health scares. Distributions swing materially with the macro cycle, making these names better suited as tactical positions than defensive income anchors.
Non-prime retail faces the most structural headwinds of any sub-sector. Properties lacking strong locations, necessity anchors, or compelling food and beverage concepts suffer from ongoing e-commerce substitution and weaker tenant demand. Rent growth is constrained, and incentives or fit-out contributions may need to rise to retain tenants.
| Sub-Sector | Headwind Type | Key Risk Factor | Quality Tier Most Affected |
|---|---|---|---|
| Office | Structural | Space rationalisation from hybrid work | Secondary and fringe locations |
| Hospitality | Cyclical | Earnings volatility tied to travel sentiment | Sector-wide (all quality tiers) |
| Non-Prime Retail | Structural | E-commerce substitution; weaker tenant demand | Malls without necessity anchors or strong locations |
Identifying whether each headwind is structural or cyclical, and whether it is concentrated at certain quality tiers or sector-wide, allows investors to avoid indiscriminate sector exclusions. A hospitality REIT priced for recession-level earnings may offer a genuinely compensated risk position. A non-prime retail REIT facing structural tenant erosion may not, regardless of yield.
The portfolio-level logic behind cyclical and defensive allocation across economic phases applies directly to S-REIT construction: hospitality and select industrial names function as cyclical tilts, while healthcare and suburban retail serve a defensive anchor role, and the appropriate weighting between them shifts as the macro environment evolves.
Even if a REIT holds the right property type, geographic diversification can decouple distribution outcomes from underlying property performance in ways that many investors underestimate.
Many S-REITs layer international exposure on top of their sub-sector positioning, holding industrial assets in Australia, offices in the UK, or data centres in the US. This introduces three additional dimensions of complexity:
Currency risk is not theoretical. FX moves between the SGD and the currencies in which a REIT earns its rental income can materially affect the distributions investors receive. REITs that do not employ active currency hedging strategies may face greater variability in their earnings and distributions, according to PhillipCapital analysis.
Investors should look for disclosed hedging policies in annual reports and investor presentations. Active hedging reduces FX-driven distribution volatility but may introduce hedging costs that affect net yield. The distinction between REITs with stated hedging programmes and those with unhedged foreign income streams is a practical indicator of distribution stability that sits alongside, and sometimes overrides, sub-sector fundamentals.
The S-REIT decision is not “REITs yes or no.” It is which combination of property type, geography, asset quality, and governance structure serves an investor’s objectives.
| Sub-Sector | 2026 Structural Positioning | Core Demand Drivers | Key Fundamental Risk |
|---|---|---|---|
| Industrial & Logistics | Favourable | E-commerce, supply chain redesign | Older/low-spec assets lag high-spec peers |
| Data Centres | Favourable | Digitalisation, cloud, AI compute | Power/land constraints; policy risk |
| Healthcare | Favourable (defensive) | Ageing demographics, long leases | Growth ceiling relatively modest |
| Suburban Retail | Neutral to favourable | Local, everyday spending | Limited upside where catchments built out |
| Office | Structurally challenged | White-collar demand with hybrid work | Space rationalisation; demand uncertainty |
| Hospitality | Cyclically exposed | Tourism, corporate travel | High earnings volatility across cycles |
| Non-Prime Retail | Structurally challenged | Discretionary physical shopping | E-commerce competition; weaker tenant demand |
Sub-sector analysis, currency awareness, and regulatory context together provide a substantially more complete picture than yield metrics alone. The investor’s analytical unit is property type, geography, and quality considered together, not any single metric in isolation.
REIT sector dispersion in recent years has exceeded 34 percentage points across sub-categories in a single year, a range that confirms the primacy of sub-sector and asset quality selection over any blanket macro narrative about rates or yield compression.
The distinction between structural and cyclical headwinds remains the most useful tool for filtering S-REIT sub-sector noise and identifying where genuine risk-adjusted value sits.
This article is for informational purposes only and should not be considered financial advice. Investors should conduct their own research and consult with financial professionals before making investment decisions. Past performance does not guarantee future results. Sub-sector positioning assessments are subject to change based on market developments, regulatory shifts, and macroeconomic conditions.
S-REIT sector analysis examines how different Singapore REIT sub-sectors, including industrial, data centre, healthcare, retail, office, and hospitality, perform based on their underlying property fundamentals. It matters because two REITs carrying the same sector label can deliver very different distribution trajectories depending on property type, geography, and asset quality.
Industrial and logistics, data centre, and healthcare REITs carry the clearest structural advantages in 2026, driven respectively by e-commerce and supply chain reconfiguration, cloud computing and AI workload growth, and ageing demographics across Singapore and Asia-Pacific.
Structural headwinds, such as hybrid work reducing office demand or e-commerce eroding non-prime retail footfall, affect long-term demand curves and are harder to recover from. Cyclical headwinds, such as a tourism slowdown affecting hospitality REITs, are tied to the macro environment and can reverse, potentially offering contrarian opportunity when pricing compensates sufficiently for the volatility.
S-REITs holding foreign assets earn rental income in currencies like the Australian dollar, British pound, or US dollar, and FX moves against the SGD can amplify or dampen distributions independent of how the underlying property is performing. Investors should check whether a REIT discloses an active hedging programme, as unhedged foreign income streams carry greater distribution variability.
The Monetary Authority of Singapore sets a single aggregate leverage limit of 50%, a minimum interest coverage ratio of 1.5 times, and enhanced disclosure obligations, providing investors with reliable financial data and structurally constraining excessive balance-sheet risk-taking across the S-REIT universe.


