Trump Signs Preliminary Iran Deal, Stocks Rally and Oil Falls
8 hrs ago

JPMorgan strategists estimate that up to $165 billion in equity selling pressure could hit global markets before June 30, 2026, driven entirely by the calendar rather than any change in the market outlook. A JPMorgan analysis note published on 18 June 2026 identifies quarter-end portfolio rebalancing by the world’s largest institutional investors as the source of a concentrated, near-term technical headwind for equities. The estimate ranks among the larger quarter-end rebalancing figures in recent memory, a direct consequence of equities outperforming bonds sharply during Q2.
What follows is a breakdown of who is selling, how much each institution is expected to offload, what the net market impact looks like, and how to interpret price action in the days ahead without misreading a mechanical flow as a macro signal.
JPMorgan estimates approximately $165 billion in gross equity selling pressure into June 30, 2026, making this one of the larger quarter-end rebalancing events in recent memory.
The number is large. It is not, however, a bearish signal.
A strong Q2 for global equities caused institutional portfolio weights to drift above their target allocations. Pension funds, sovereign wealth vehicles, and insurers that entered the quarter at, say, 60% equities now sit several percentage points above that mark. Their mandates require them to sell back to target. The selling is rules-based, automatic, and entirely disconnected from any view on where markets are heading.
The mechanics driving the $165 billion institutional figure are structurally identical to the challenge facing individual investors: portfolio drift after equity gains silently pushes allocations beyond their intended risk level, creating a mandatory correction regardless of the investor’s market view.
Balanced mutual funds, which tend to rebalance monthly rather than quarterly, are expected to provide a partial offset of approximately $15 billion in net equity purchases. That reduces the gross $165 billion figure to roughly $145-150 billion in net selling pressure into quarter-end. The scale is meaningful. The source is mechanical, not directional.
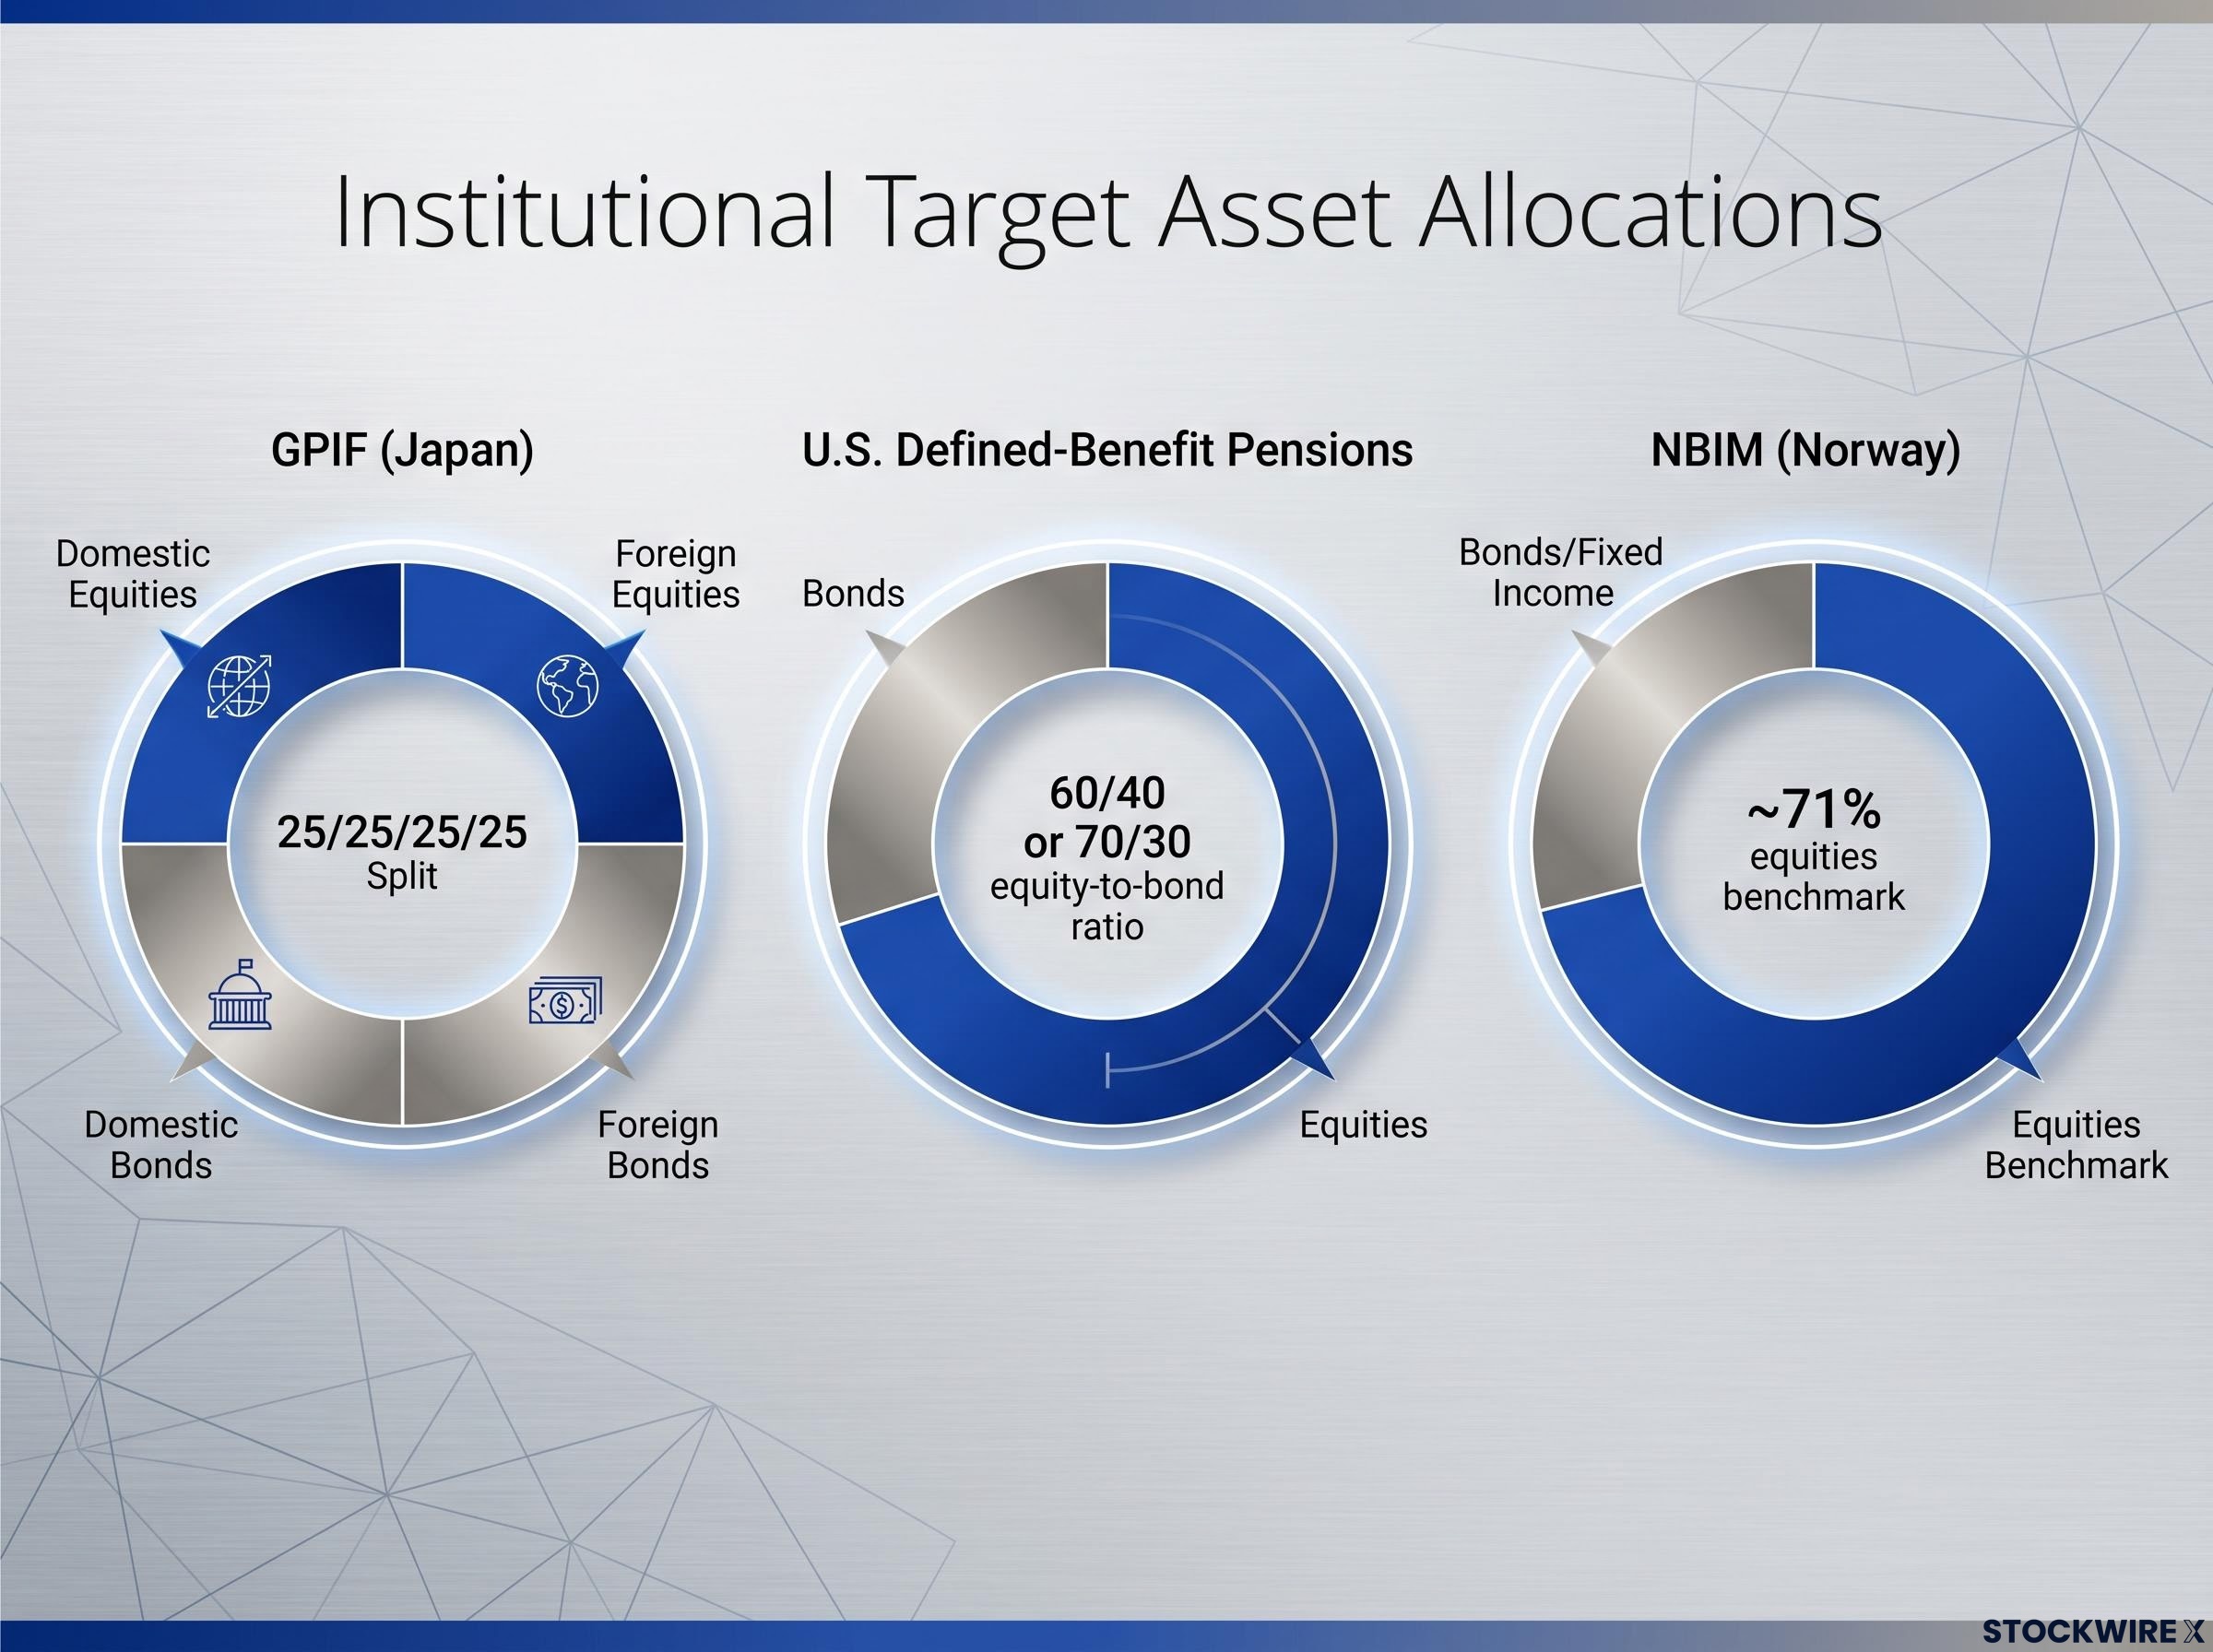
The world’s largest pools of capital operate under fixed asset-allocation mandates. Japan’s Government Pension Investment Fund (GPIF) runs a 25/25/25/25 split across domestic equities, foreign equities, domestic bonds, and foreign bonds. Many U.S. defined-benefit pension plans target a 60/40 or 70/30 equity-to-bond ratio. Norway’s sovereign wealth fund benchmarks near 71% equities. These targets are not suggestions; they are governance-level commitments with defined tolerance bands.
Fixed-ratio mandates like the 60/40 and 70/30 frameworks are governance-level commitments rather than flexible guidelines, meaning the institutions operating under them cannot simply decide to let drift run when markets move in one direction.
GPIF’s policy asset mix guidelines confirm that the 25/25/25/25 split across domestic equities, foreign equities, domestic bonds, and foreign bonds remains in effect from April 2025, with defined deviation limits that trigger mandatory rebalancing when any asset class drifts beyond its tolerance band.
When equities outperform bonds over a quarter, the equity weight drifts above target. Once the drift breaches the tolerance band, the fund has a non-discretionary obligation to act:
This clustering is what transforms gradual drift into a concentrated flow event. The institutions are not expressing a view on markets. They are complying with a rule. That distinction matters, because it means the selling pressure has a defined endpoint: once the trades clear, the technical headwind disappears.
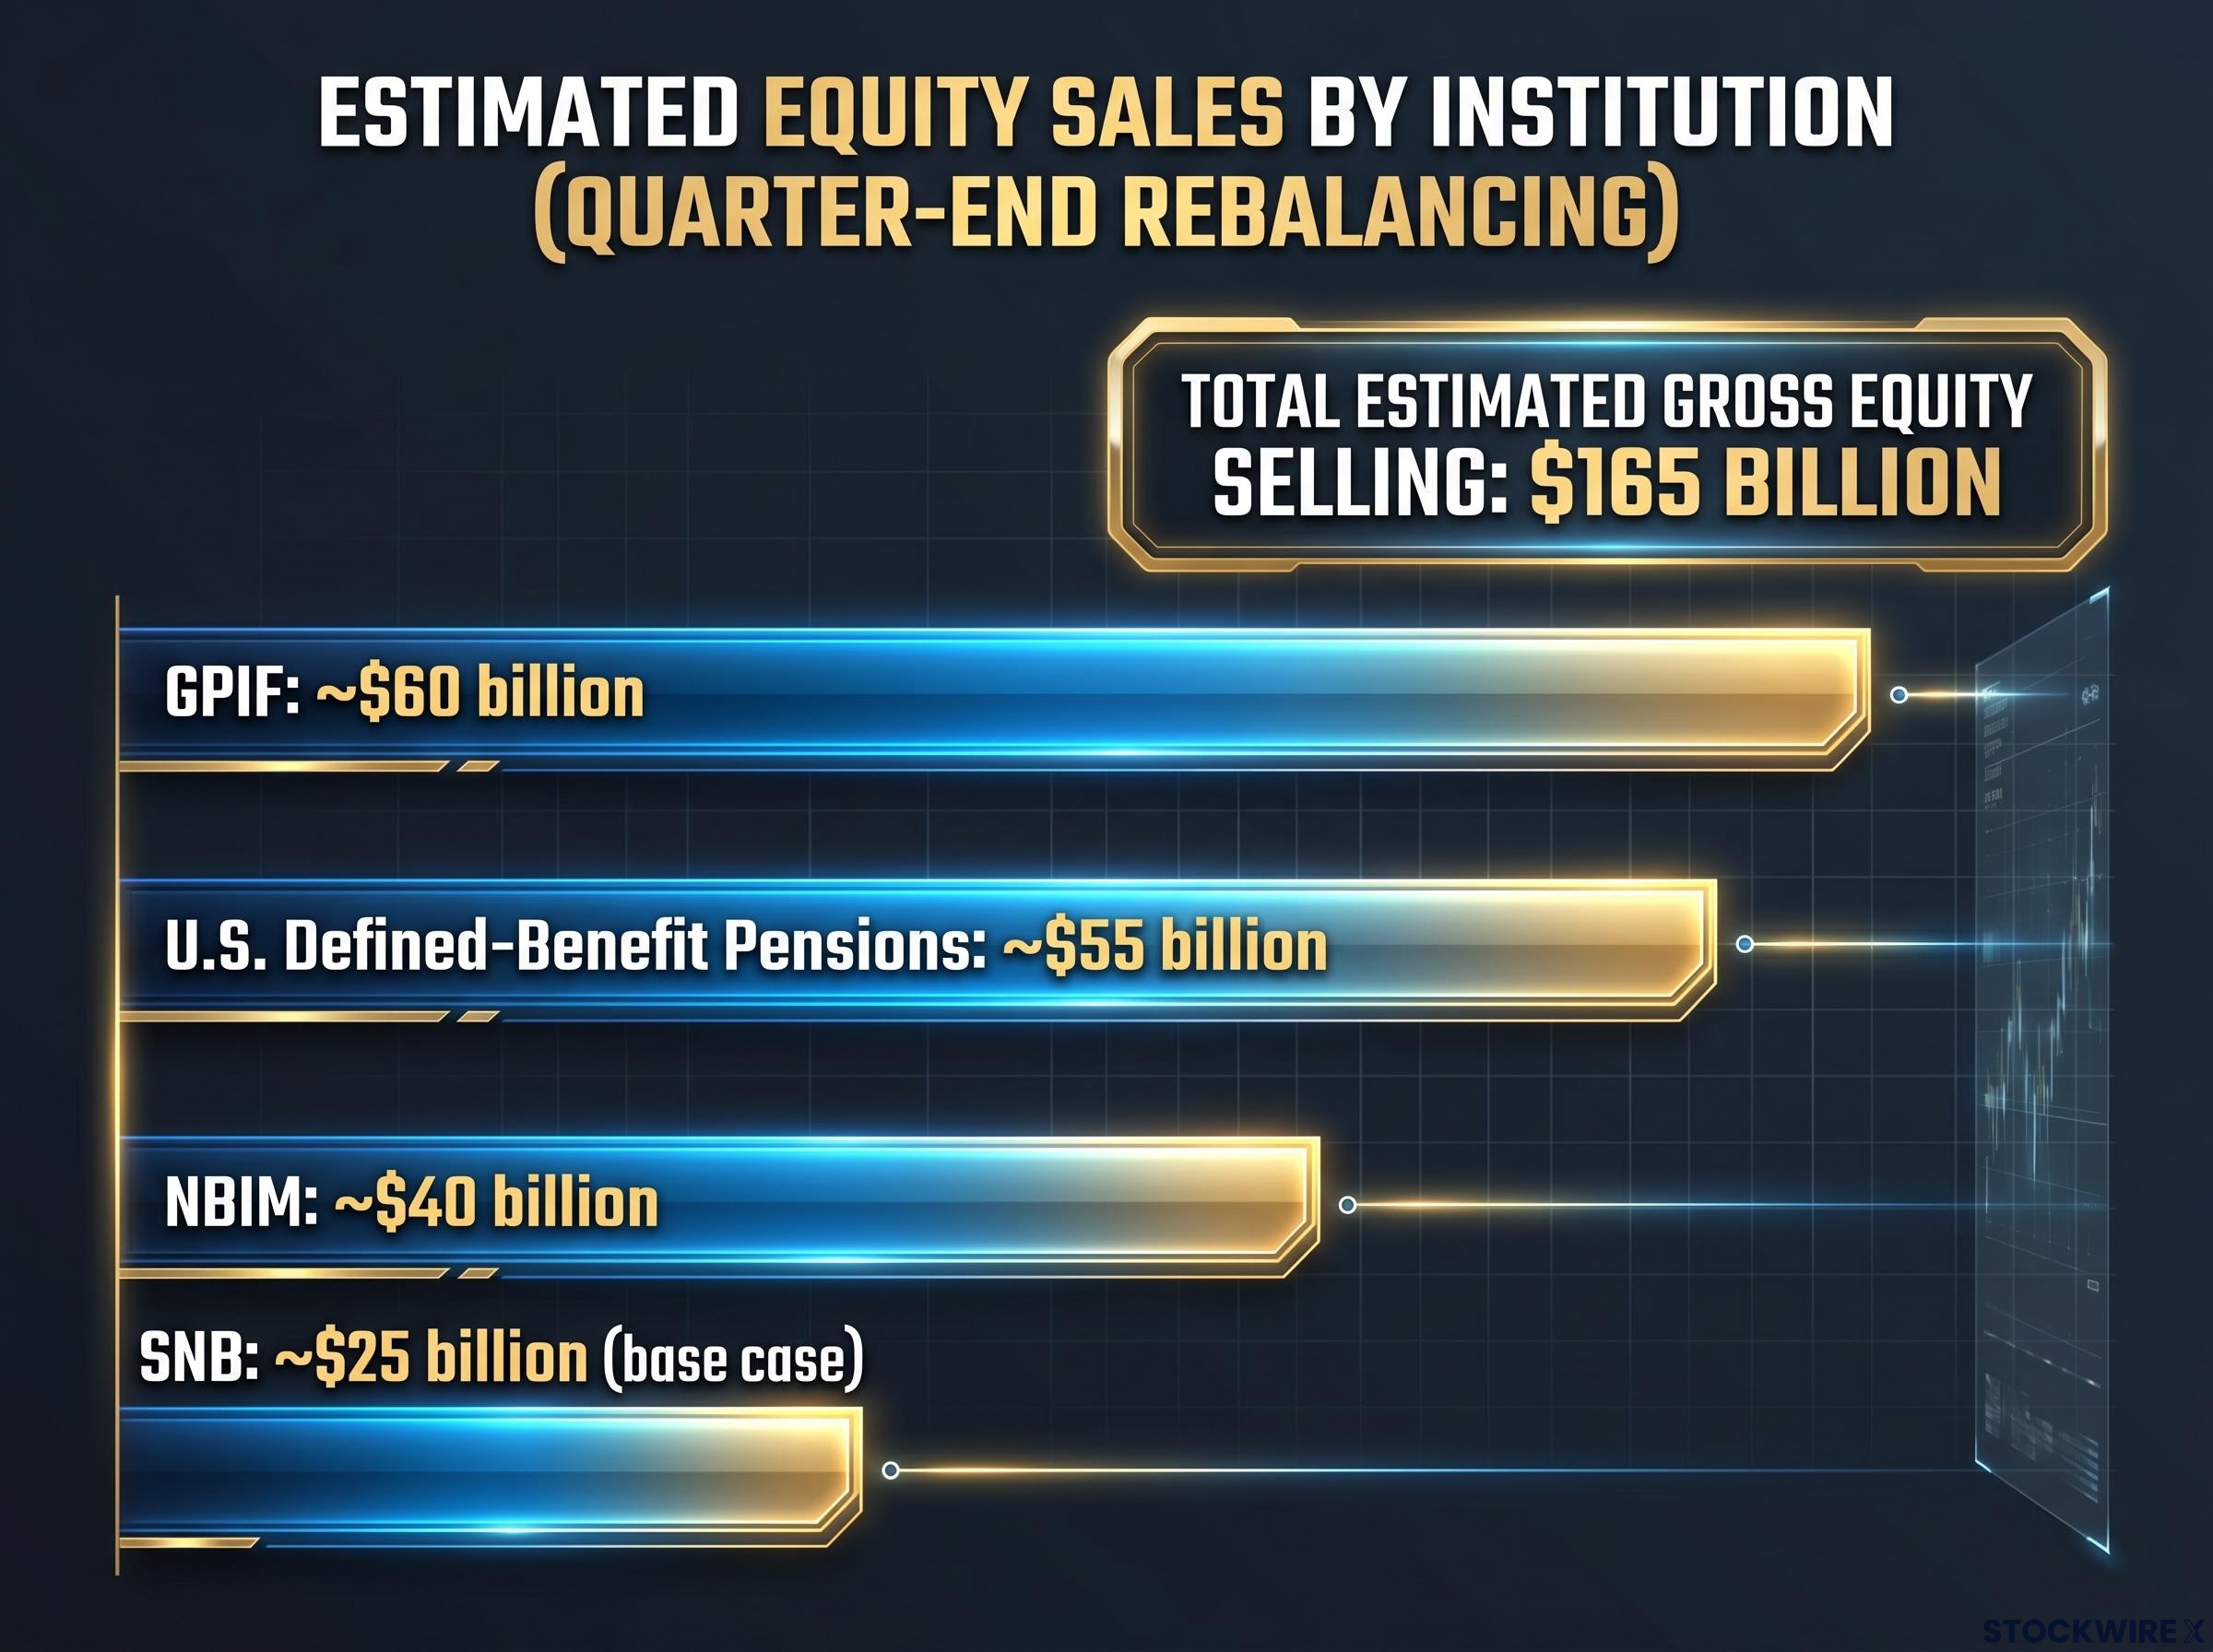
The $165 billion gross figure is not an opaque aggregate. JPMorgan’s analysis attributes it to four identifiable institutional sellers, each with a specific estimated contribution.
| Institution | AUM (approx.) | Estimated Equity Sales | Key Caveat |
|---|---|---|---|
| GPIF (Japan) | $1.9 trillion | ~$60 billion | Strict 25/25/25/25 mandate with defined bands |
| U.S. Defined-Benefit Pensions | $13 trillion+ | ~$55 billion | JPMorgan applied a ~1/6 participation assumption; not all plans rebalance simultaneously |
| NBIM (Norway) | $2.2 trillion | ~$40 billion | ~71% equity benchmark; even modest drift on this scale produces large flows |
| SNB (Switzerland) | N/A (central bank reserves) | ~$25 billion (base case) | If formal equity target is raised to 30%, estimated sales drop to ~$8 billion |
The Swiss National Bank entry is the most conditional component. The SNB’s equity share climbed to approximately 28% of foreign currency reserves during Q1 2026, up from a previously stable level of roughly 25%. At the current target, that drift implies significant trimming. However, if the SNB raises its formal equity target to 30%, the current allocation would sit below target, and estimated sales shrink to approximately $8 billion.
Balanced mutual funds, representing an estimated $4 trillion in assets, partially offset the institutional selling. These funds rebalance monthly, and with equity returns roughly flat and bond returns modestly positive month-to-date in June, many are actually underweight equities versus target. The result: approximately $15 billion in net equity buying.
Typical daily U.S. equity notional volume runs between $400-500 billion. Against that benchmark, $150 billion spread across multiple sessions, time zones, and asset classes is material but not overwhelming. The flows span U.S., European, Japanese, and other Asian markets, which further distributes the impact.
The impact of quarter-end rebalancing scales with the degree of prior equity outperformance, which is precisely why this quarter’s estimate is particularly large.
Where the effect concentrates is in specific windows. Many institutional portfolios target execution near market closes to minimise tracking error, meaning late-session trading and market-on-close auctions absorb a disproportionate share of the flow. Historical patterns show mild equity underperformance into quarter-end following strong equity quarters, paired with a simultaneous technical bid for Treasuries and high-grade credit that does not reflect a macro shift in yield expectations.
Bond yield dynamics across major sovereign markets add a layer of complexity to interpreting the expected Treasury bid: when rebalancing-driven bond buying arrives alongside already-elevated yield levels, the price signal in fixed income can briefly obscure whether the move reflects institutional mechanics or a genuine macro shift in rate expectations.
Cross-border dimensions add a layer. GPIF’s and NBIM’s transactions interact with currency hedging programmes, creating potential spillovers into JPY and NOK around rebalancing dates.
Four market signposts to monitor into June 30:
Rebalancing flows signal one thing: mechanical compliance with allocation rules. They do not signal a new bearish macro view from sophisticated institutional sellers. These institutions are not choosing to sell equities because they expect markets to fall; they are selling because their mandates require it.
What this information is useful for:
What to avoid doing with it:
Rebalancing flows compete with corporate buybacks, discretionary active managers, retail flows, options hedging, and macro-driven trading. They produce a skew in returns, not an automatic sell-off.
The $165 billion JPMorgan estimate reflects the scale of Q2 equity outperformance, not a deterioration in the fundamental outlook held by any of the institutions involved. The net effect is a temporary technical headwind for equities and a mild tailwind for bonds through June 30, which normalises as rebalancing orders clear.
The reusable insight is straightforward: investors who understand the rebalancing mechanism are better positioned to interpret every future quarter-end, particularly after quarters of strong equity performance. When prices move without news, the calendar is often the explanation.
Investors wanting to place this rebalancing event within the broader institutional positioning context will find our full explainer on the record bond inflows and defensive repositioning of early June 2026 useful, as it covers the $39 billion all-time bond inflow, the sustained BofA sell signal at 8.7, and the rotation from US growth equities into large-cap and fixed income that was already underway before quarter-end flows arrive.
This article is for informational purposes only and should not be considered financial advice. Investors should conduct their own research and consult with financial professionals before making investment decisions.
Quarter end rebalancing is the process by which large institutional investors such as pension funds and sovereign wealth funds sell equities and buy bonds to restore their portfolios to fixed target allocations after market movements have caused their weights to drift. It is rules-based and mandatory, meaning the selling reflects compliance with governance mandates rather than any bearish view on markets.
JPMorgan estimates approximately $165 billion in gross equity selling pressure into June 30, 2026, which reduces to roughly $145-150 billion net after accounting for an estimated $15 billion in offsetting equity purchases from balanced mutual funds.
The four main sources identified by JPMorgan are Japan's Government Pension Investment Fund (approximately $60 billion), U.S. defined-benefit pension plans (approximately $55 billion), Norway's NBIM sovereign wealth fund (approximately $40 billion), and the Swiss National Bank (approximately $25 billion under the base case scenario).
Investors should treat late-session equity softness and a simultaneous bond bid into June 30 as likely mechanical rebalancing flows rather than evidence of deteriorating fundamentals, since the selling source is identified, calendar-driven, and has a defined endpoint once rebalancing orders clear.
JPMorgan's analysis and financial commentators caution against front-running these flows because they are widely anticipated by sophisticated market participants, and slippage, timing risk, and concurrent news can easily overwhelm any perceived edge for individual investors.