Why Drug Reformulation Carries Less Risk Than Investors Price in
3 hrs ago

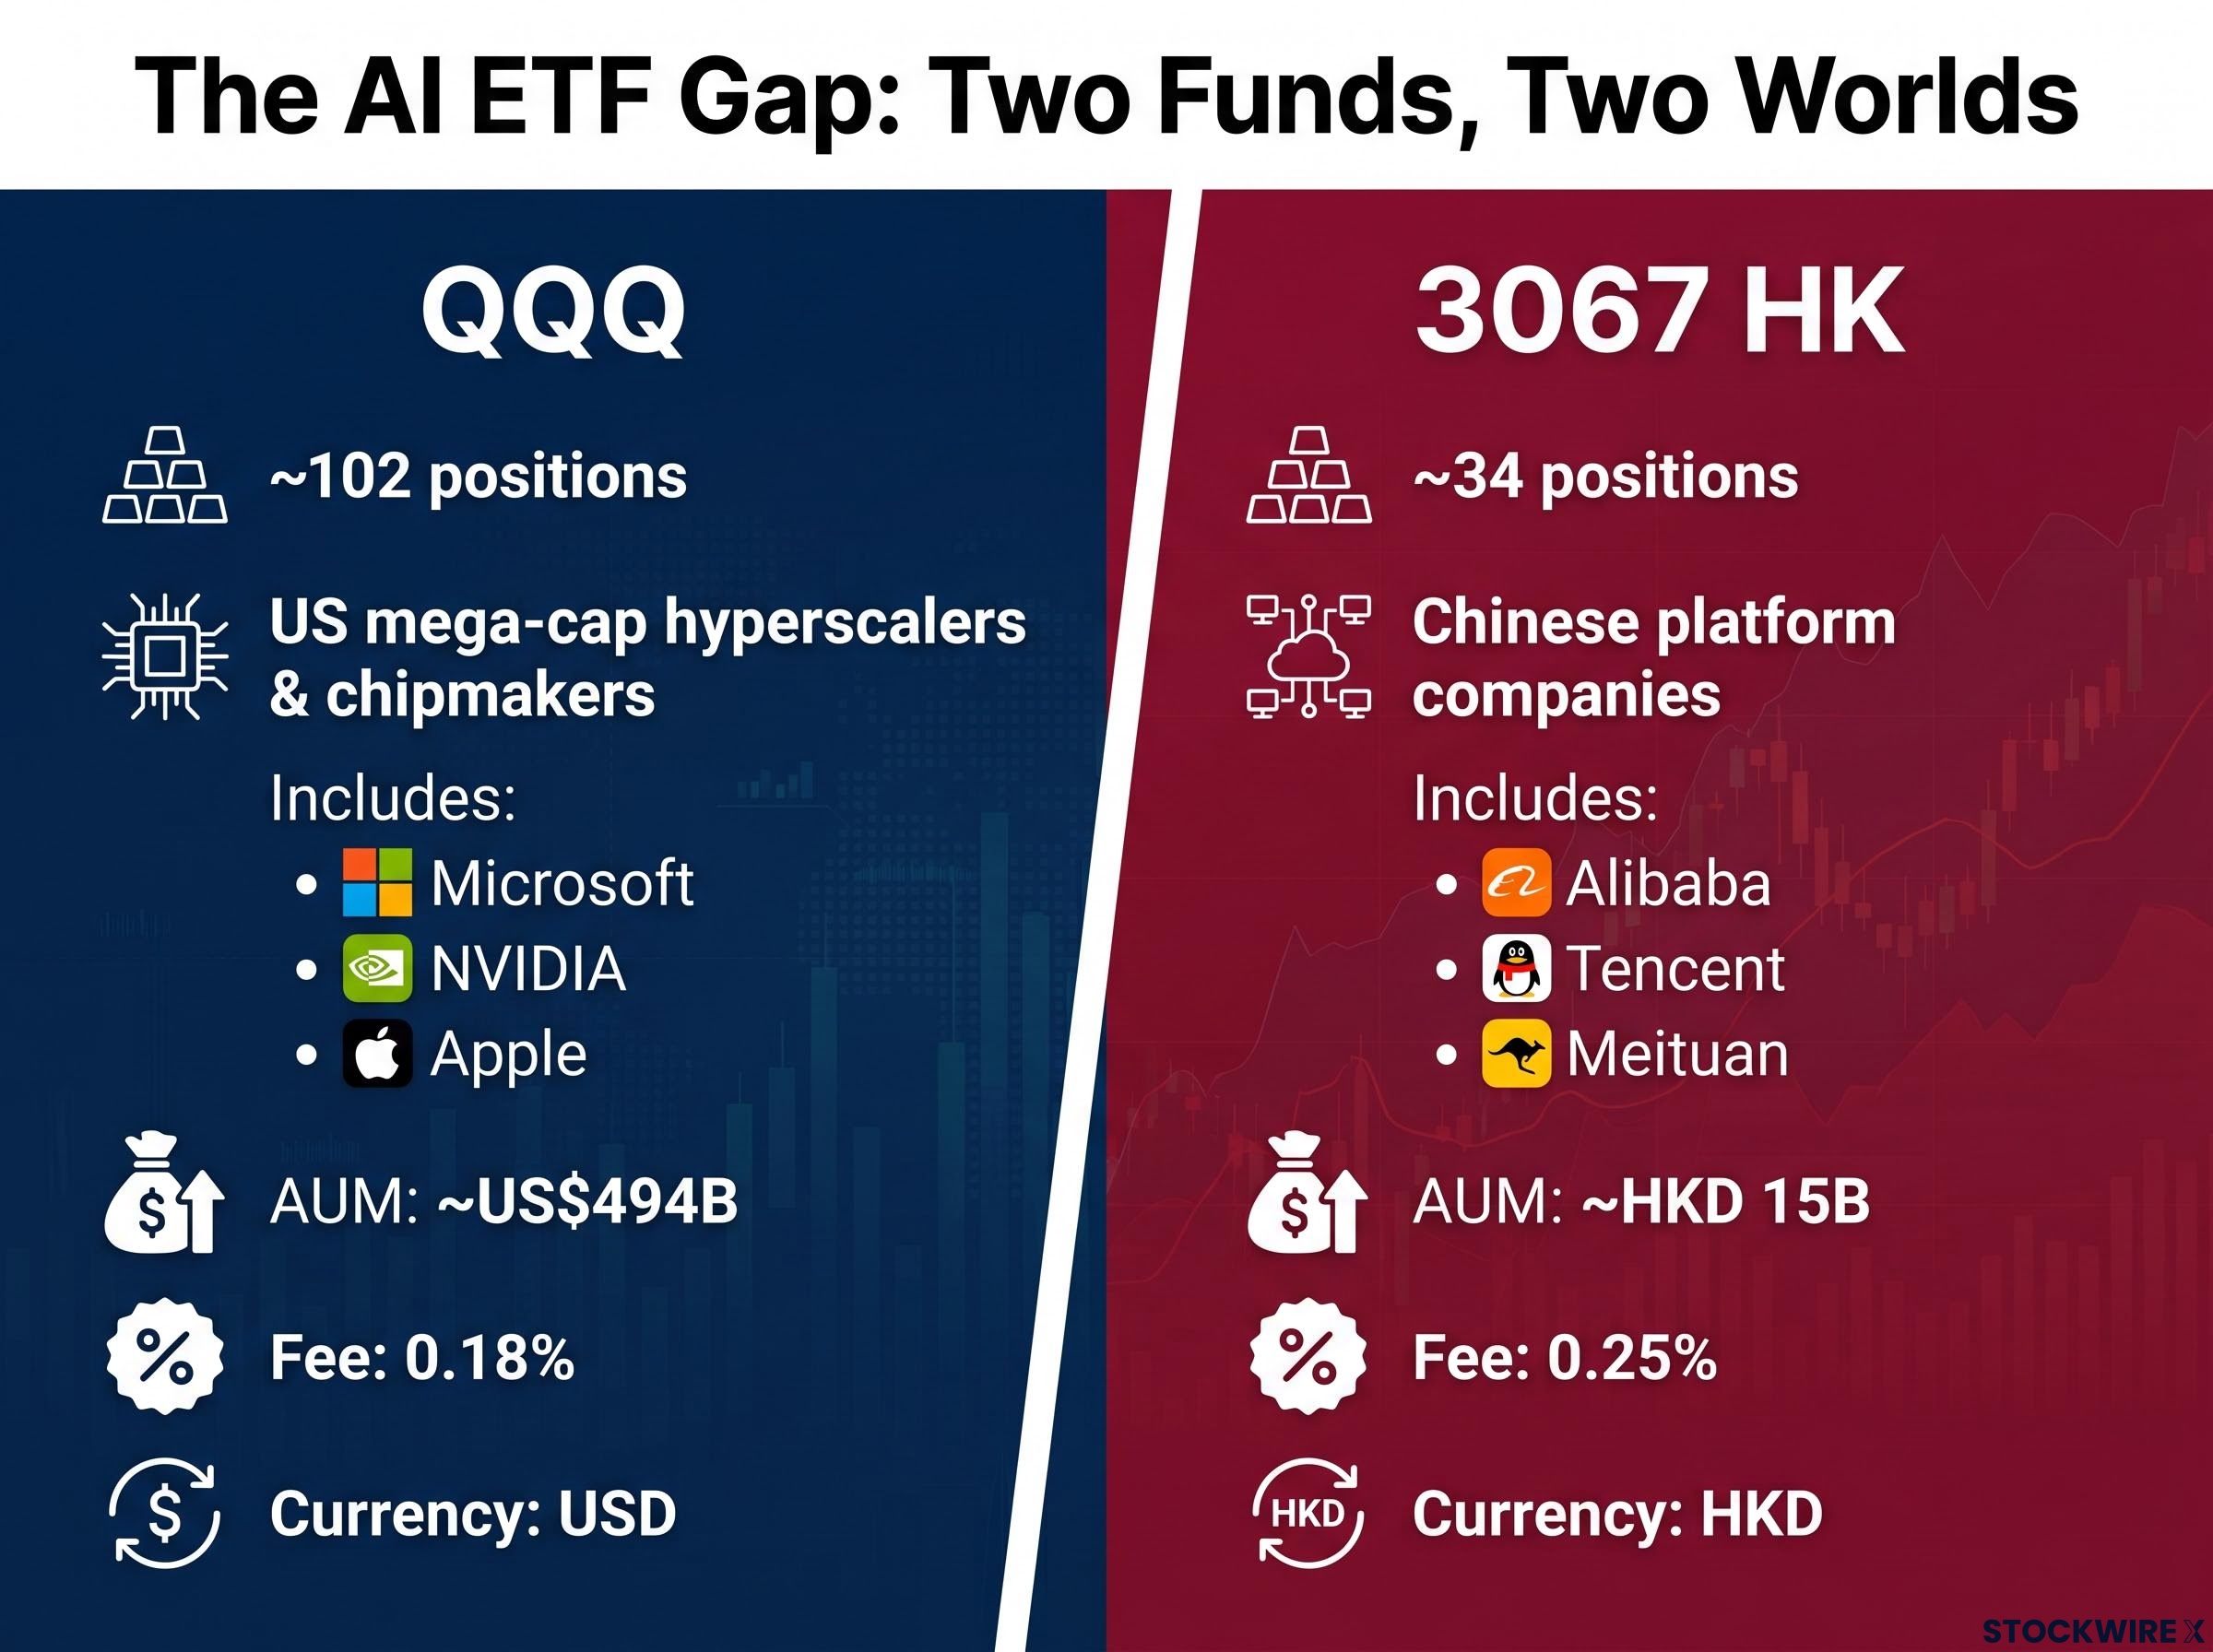
Two ETFs can both carry the word “technology” in their name, yet offer investors almost nothing in common. One holds approximately 102 positions anchored in US mega-cap platforms, manages roughly US$494 billion in assets, and charges 0.08% per year. Another holds 34 names concentrated in Chinese platform companies, trades in Hong Kong dollars, and carries a layer of regulatory risk that the first fund never encounters. Both are marketed under AI or technology labels.
As capital continues flowing into AI-themed funds in mid-2026, the number of ETFs sold under these labels has grown to the point where surface-level comparisons mislead more than they inform. Readers evaluating the best AI ETFs are typically choosing between specific funds, not deciding whether to invest in the theme at all. What follows is a five-criteria screening framework applied directly to five widely traded funds: QQQ, XLK, QQQJ, WITS, and 3067 HK. The framework is designed to be repeatable, meaning it works on any AI-focused ETF a reader encounters, not just the five profiled here.
“AI ETF” is a marketing label, not a standardised category. Two funds carrying that label can differ in holding count, geographic concentration, value-chain positioning, expense ratio, and currency denomination, yet sit side by side on a broker’s thematic search page as though they were interchangeable.
Consider the gap between QQQ and 3067 HK. QQQ holds approximately 102 positions dominated by US mega-cap hyperscalers and chipmakers. 3067 HK holds approximately 34 positions across Chinese platform companies including Alibaba, Tencent, and Meituan, trading in HKD on the Hong Kong Stock Exchange. Both offer exposure to companies deploying AI at scale. The concentration profile, the regulatory environment, and the currency risk are entirely different.
The label tells a reader the theme. The five criteria that follow tell them almost everything else. Before applying those criteria, it helps to know the four broad fund archetypes competing for attention in this space:
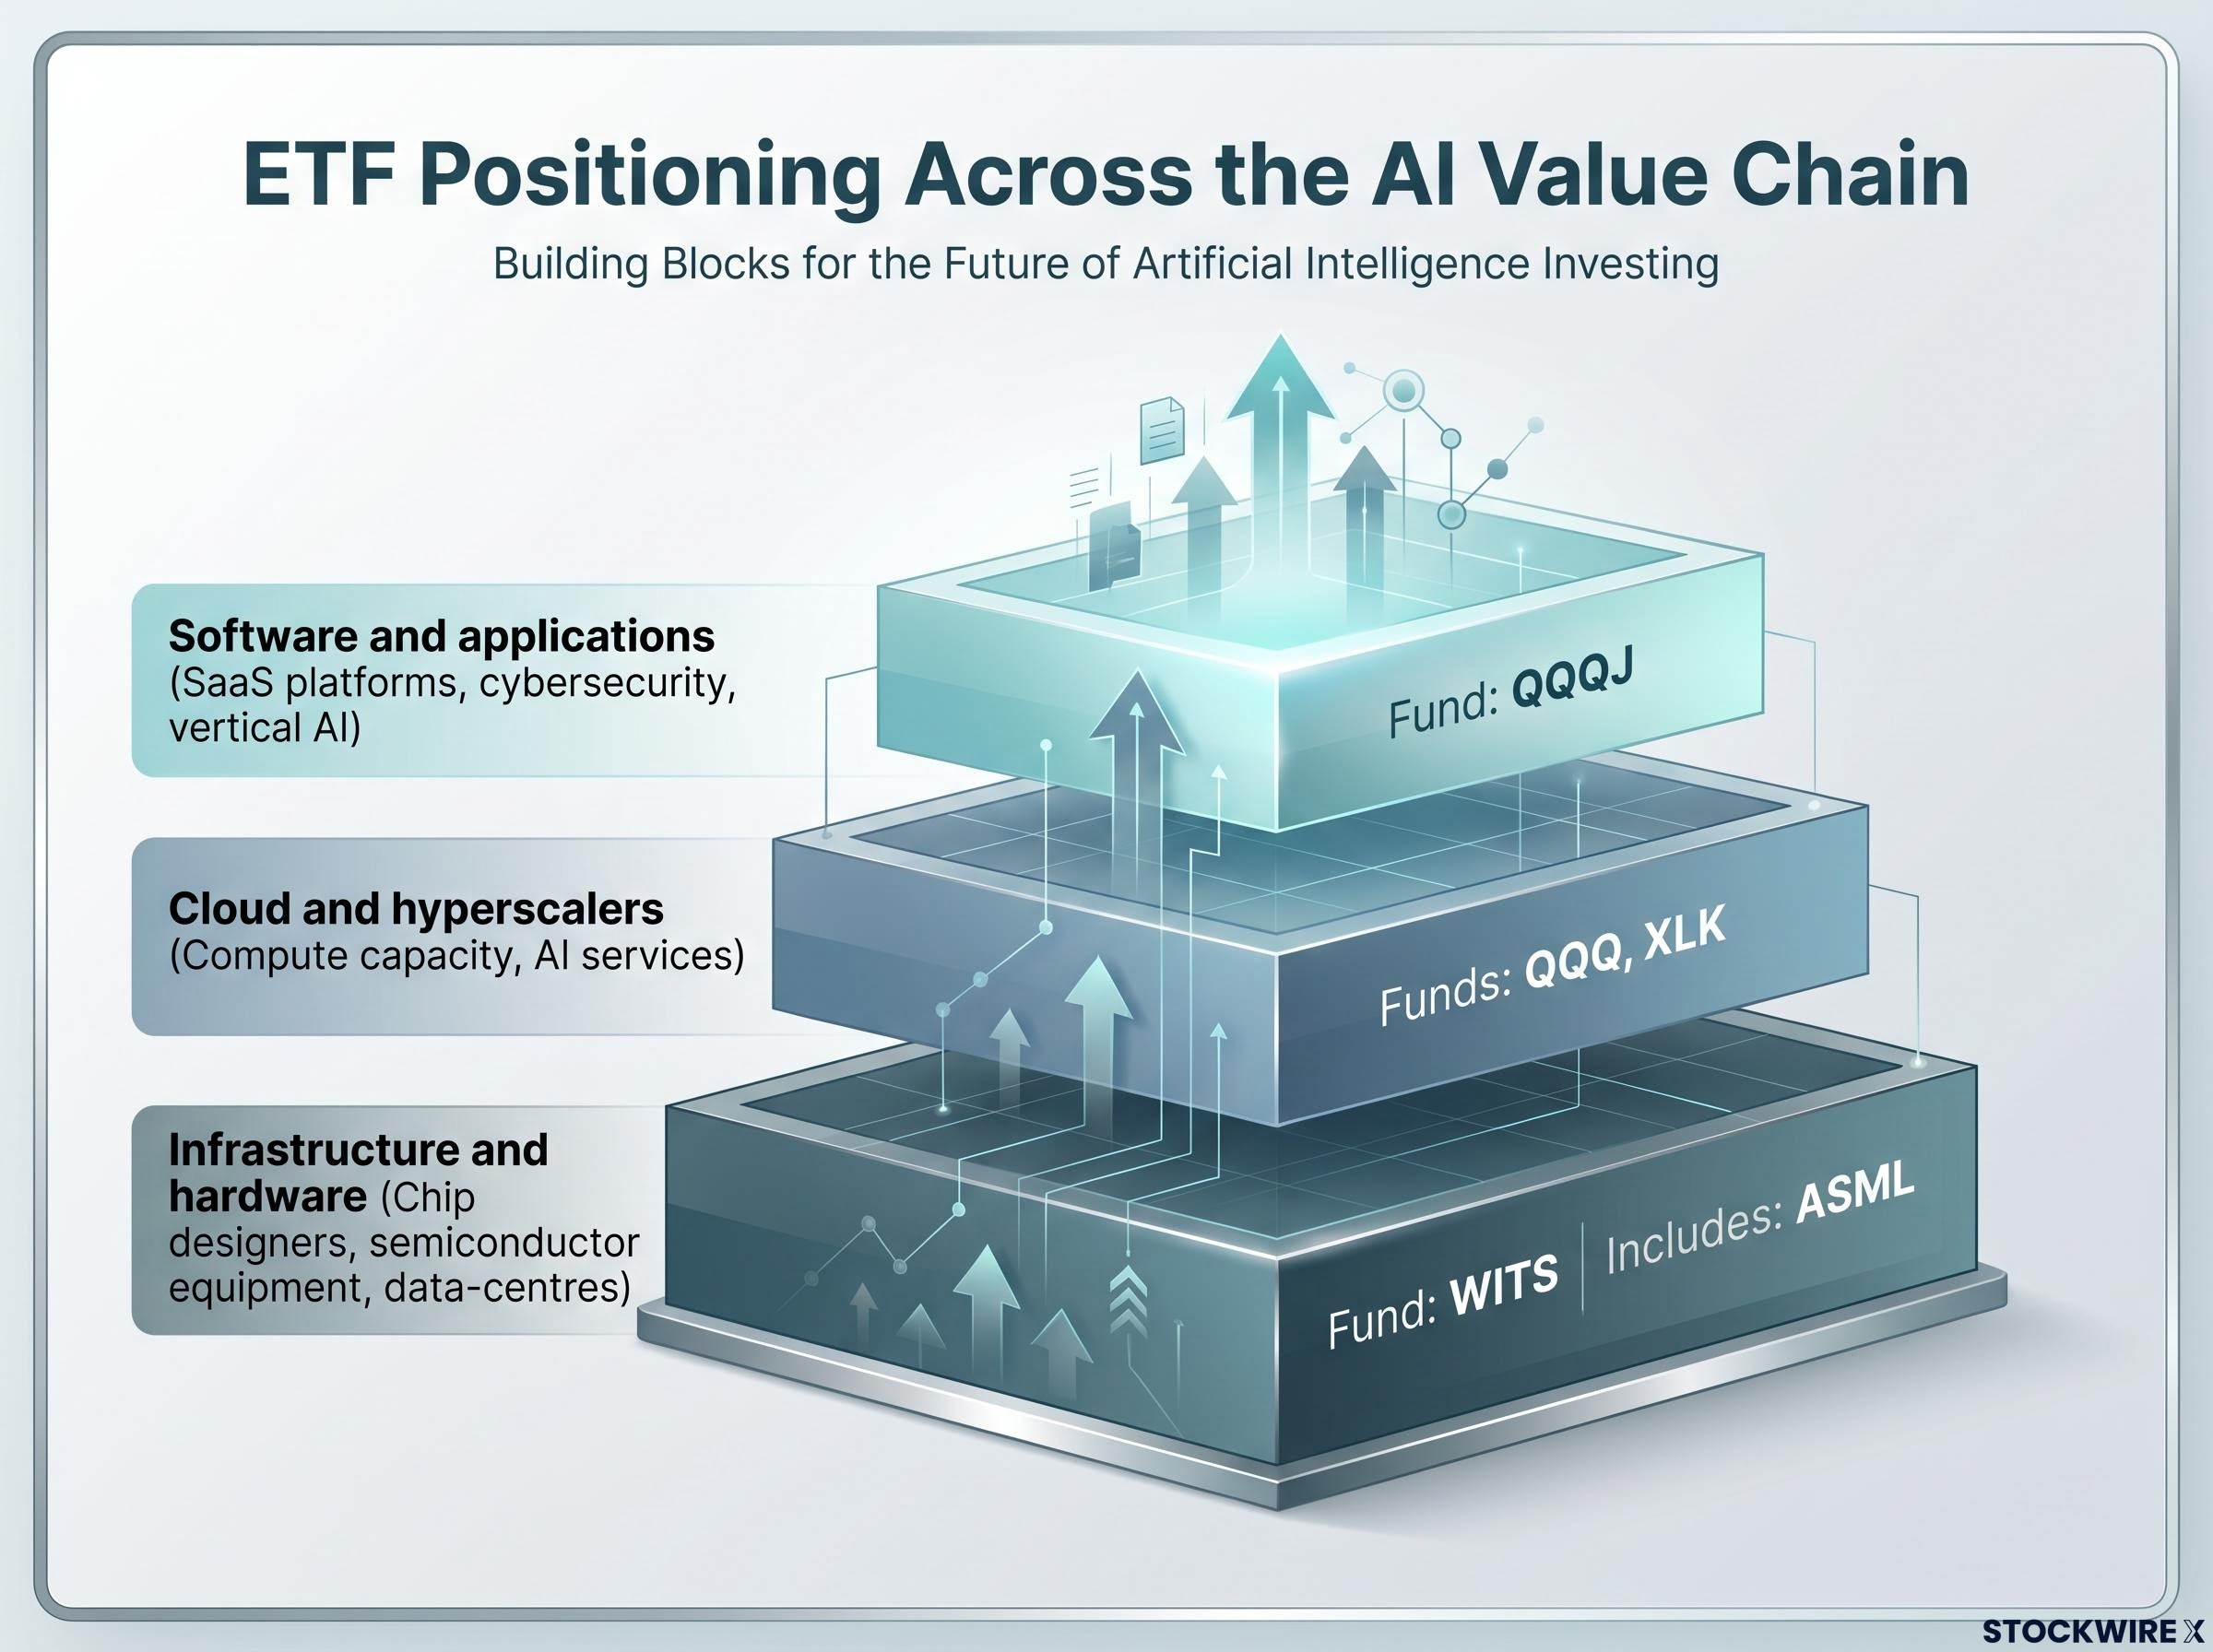
Before comparing individual funds, it helps to understand the technology stack that underpins every AI-labelled ETF. Where a fund sits on this value chain determines what kind of AI exposure an investor is actually buying, regardless of the fund’s name or marketing materials.
The AI value chain breaks into three layers:
Some funds straddle multiple layers; others concentrate in one. Neither approach is inherently superior. What matters is whether the positioning matches the investor’s conviction about where AI value will be created. A reader who believes the largest returns will come from application-layer companies needs a different fund from one who believes infrastructure providers will capture the majority of AI spending.
Investors building an AI investment framework across hardware, cloud, and software layers tend to reach the same structural conclusion that institutional allocators at J.P. Morgan Asset Management and BlackRock have independently published: each layer carries a distinct risk profile, and mixing them without intention produces a portfolio whose actual exposure is difficult to interpret.
China’s platform companies, available through 3067 HK, represent a distinct category: AI-adjacent application exposure across e-commerce, fintech, and logistics that does not overlap with US or European-focused funds.
A fund with 102 holdings sounds diversified. A fund with 34 holdings sounds concentrated. The reality is less straightforward.
What matters is not how many names a fund holds but how much weight the top five or ten positions carry. When a handful of US mega-caps account for a large share of a fund’s assets, single-stock events, whether earnings misses, regulatory actions, or executive changes, can move the entire ETF materially. Industry data suggests that some technology ETFs have their top five holdings representing 40-60% of total assets, a concentration level that surprises investors who assumed diversification was automatic.
Two funds can both claim “over 100 holdings” while carrying very different effective concentration in their top names. The holding count is the headline; the weight distribution is the story.
The overlap question compounds this. Holding multiple AI or tech ETFs that share the same top names amplifies concentration rather than reducing it. Checking for portfolio overlap before adding a new position takes minutes and can change the risk picture materially.
| Fund | Ticker | Approx. Holdings | Concentration Profile |
|---|---|---|---|
| Invesco QQQ Trust | QQQ | ~102 | Mega-cap US; heavy weight in AI platforms and chipmakers (Microsoft, NVIDIA, Apple) |
| Technology Select Sector SPDR | XLK | ~75 | US mega-cap tech; strong top-name concentration |
| Invesco NASDAQ Next Gen 100 | QQQJ | ~104 | Mid-cap US; broader spread across smaller innovators |
| iShares MSCI World IT UCITS ETF | WITS | ~135 | Global multi-cap; broadest holding count of the five |
| iShares Hang Seng TECH ETF | 3067 HK | ~34 | China platform companies; highly concentrated by count |
Three evaluation criteria are each individually important but become most useful when viewed side by side across funds. Together, they reveal whether a higher fee or lower liquidity is justified by genuinely differentiated exposure, or whether an investor is simply paying a thematic premium for holdings available more cheaply elsewhere.
Sub-sector tilt maps each fund to its primary value-chain position. QQQ and XLK sit in the infrastructure and mega-cap layer. QQQJ tilts toward the application layer: SaaS, cybersecurity, and vertical AI among smaller and mid-cap companies. WITS spans the global supply chain, including non-US semiconductor names such as ASML. 3067 HK captures China’s platform ecosystem.
The practical stakes of sub-sector tilt became measurable in 2026, when hardware and software divergence inside the technology sector reached more than 70 percentage points: semiconductor equipment indices gained nearly 48% while software applications indices fell more than 22%, a spread that would produce materially different outcomes for a fund concentrated in each layer.
Expense ratios across the five funds range from 0.08% to 0.25%, and all fall below the 0.50% threshold commonly used as a benchmark for passively managed ETFs. European AI ETFs, by comparison, commonly charge 0.30-0.75% per year, according to industry data.
XLK charges 0.08% per year, the lowest of the five funds compared. For investors whose primary interest is large-cap US technology exposure, the fee differential between XLK and a dedicated AI-themed fund charging three to five times as much is worth examining closely, particularly if the underlying holdings overlap substantially.
| Fund | Ticker | Sub-Sector Focus | Expense Ratio | AUM |
|---|---|---|---|---|
| Invesco QQQ Trust | QQQ | US mega-cap AI leaders and hyperscalers | 0.18% | ~US$494B |
| Technology Select Sector SPDR | XLK | US mega-cap technology | 0.08% | ~US$124B |
| Invesco NASDAQ Next Gen 100 | QQQJ | Mid-cap SaaS, cybersecurity, vertical AI | 0.15% | ~US$1B |
| iShares MSCI World IT UCITS ETF | WITS | Global IT including non-US names (ASML) | 0.18% | ~US$1.04B |
| iShares Hang Seng TECH ETF | 3067 HK | China platform AI ecosystem | 0.25% | ~HKD 15B |
Assets under management serve as a proxy for secondary market depth. The practical difference between a US$494 billion fund and a US$1 billion fund is not academic; it affects bid-ask spreads, execution speed, and the cost of entering or exiting larger positions.
For active traders who need tight spreads consistently, QQQ and XLK are among the most liquid equity ETFs in the world. For buy-and-hold investors, spreads matter primarily at the entry and exit points, making the liquidity demands less stringent, though still worth verifying for larger position sizes.
3067 HK trades on HKEX, introducing considerations that do not apply to NYSE Arca or NASDAQ-listed funds: broker access to the Hong Kong exchange, trading-hour differences, and exchange-specific transaction costs. International investors should confirm these logistics before committing capital.
An investor’s actual return from any ETF is the product of two moving parts: the performance of the fund’s underlying holdings, and the exchange rate movement between the fund’s trading currency and the investor’s home currency over the holding period.
A strong equity return can still translate into a weak result in an investor’s home currency if the fund’s denominating currency depreciates during the holding period. Currency risk is structural, not incidental.
The five funds profiled here trade across three currencies:
Singapore dollar investors, as a concrete example, face both USD and HKD cross-rate considerations depending on which combination of these funds they select. Checking whether a currency-hedged share class exists adds less than a minute to due diligence and can change the fund selection decision entirely.
For investors wanting to model the specific return impact of currency movements on their fund selection, our full explainer on hedged versus unhedged ETF structures walks through a concrete example where AUD appreciation created a 13-percentage-point performance gap between two funds holding identical underlying positions, illustrating exactly how large the FX layer can become relative to the equity return.
Regardless of which fund a reader selects, technology-focused ETFs share a set of category-level risks that shape the overall portfolio impact:
China ETF regulatory constraints extend beyond what headline fund documents disclose: Chinese companies are legally required to prioritise central government directives over shareholder interests, a structural governance feature that applies to every position inside 3067 HK and does not diminish with time or improved financial performance.
Understanding these risks before selecting a fund helps investors calibrate position sizing and time horizon expectations in advance, not after experiencing a drawdown.
The five criteria covered in this guide compress into a portable checklist that works on any AI or technology ETF, not just the five funds profiled. The “best” AI ETF is the one whose holdings, cost, liquidity, and currency profile align with a reader’s own portfolio context. There is no universal ranking.
Two funds with identical marketing labels can carry fundamentally different concentration, currency, liquidity, and sector risk profiles. The five-criteria framework in this guide is designed to surface those differences in minutes, before capital is committed rather than after.
As the AI ETF space continues to expand, the number of funds carrying the label will keep growing while the quality of differentiation between them will vary widely. The checklist becomes more useful, not less. Apply it to any shortlist before making a selection decision.
This article is for informational purposes only and should not be considered financial advice. Investors should conduct their own research and consult with financial professionals before making investment decisions. Past performance does not guarantee future results.
An AI ETF is a fund marketed around artificial intelligence themes, but the label is not standardised; two funds carrying it can differ in holding count, geographic concentration, value-chain positioning, expense ratio, and currency denomination, making direct comparison essential before investing.
Apply a five-criteria framework: review top holding concentration, identify where the fund sits on the AI value chain (infrastructure, cloud, or applications), compare expense ratios, assess liquidity via AUM and bid-ask spreads, and confirm the trading currency and any available hedged share classes.
XLK charges 0.08% per year, the lowest of the five funds compared, while QQQ charges 0.18% per year; for investors seeking large-cap US technology exposure, this fee differential is worth examining closely if the underlying holdings overlap substantially.
An investor's actual return is the product of both the fund's equity performance and the exchange rate movement between the fund's trading currency and the investor's home currency; in one documented example, currency appreciation alone created a 13-percentage-point performance gap between two funds holding identical underlying positions.
China-focused funds carry regulatory risk not present in US or European alternatives; Chinese companies are legally required to prioritise central government directives over shareholder interests, a structural governance feature that applies to every position inside 3067 HK regardless of financial performance.