
The Commercial Space Economy Is Infrastructure, Not a Frontier Bet
1 hr ago

A single sector, concentrated in eleven cities, added five times its recent monthly average in jobs during May, and markets sold off hard on the headline. The May 2026 jobs report, released on 5 June, delivered a nonfarm payrolls gain of 172,000, nearly double the consensus forecast of roughly 90,000. The Nasdaq fell 3.3% and the S&P 500 dropped 2.4% across the two sessions that followed, per Global X ETFs analysis. Rate-cut positioning, which had been heavily crowded heading into the print, was rapidly unwound.
The market read the number as evidence of a re-accelerating labour market. That reading may have been premature. What follows is a sector-by-sector, city-by-city breakdown of where those jobs actually came from, why the FIFA World Cup explains the geography of the surge, and what the reversal risk looks like for the June and July prints. The analytical framework applies well beyond this single release.
The scale of the miss was difficult to overstate. Forecasters had clustered in the 80,000-120,000 range, with the Global X estimate sitting at approximately 90,000. The actual print came in at 172,000.
Consensus versus actual: Forecasters expected roughly 90,000 jobs. The economy added 172,000.
Equities responded immediately. The Nasdaq shed 3.3% across two sessions; the S&P 500 gave back 2.4% over the same window. Rate-hike expectations shifted toward mid-2027, a material repricing for a market that had been positioned for cuts.
The May 2026 payrolls report also recorded an April revision from 115,000 to 179,000, a 64,000 upward swing that compounded the hawkish read and reinforced why rate-cut positioning unwound as sharply as it did across the two sessions following the release.
Yet the broader labour market heading into June offered little to support the acceleration thesis. Hires and layoffs rates remained depressed. The share of long-term unemployed stood at 27.5%, well above pre-pandemic norms, according to Indeed Hiring Lab. The economy was still operating in the low-hire, low-fire pattern that had defined most of 2026. A 172,000 headline print, against that backdrop, was less a confirmation of strength and more a question: where exactly did those jobs come from?
The answer sits in the sector breakdown. One line item dominates the table.
| Sector | Jobs added/lost (May 2026) | Vs. trend |
|---|---|---|
| Leisure and hospitality | +70,000 | ~5x its 12-month average |
| Government | +52,000 | In line with recent pace |
| Private education and health services | +40,000 | In line with recent pace |
| Construction | +17,000 | Modest |
| Manufacturing | +7,000 | Modest |
| Professional and business services | +6,000 | Subdued |
| Financial activities | -22,000 | Contracting |
| Wholesale trade | -3,700 | Contracting |
| Information | -2,000 | Contracting |
Leisure and hospitality alone accounted for roughly 41% of total job gains. The 12-month average monthly pace for the sector heading into May was approximately 14,000 positions, per Global X ETFs analysis.
Private-sector composition mattered in April for the same reason it matters in May: the total headline figure obscured the fact that federal government employment had been contracting while services-led private hiring was carrying the gains, a structural split that makes single-month headline readings systematically unreliable as economy-wide signals.
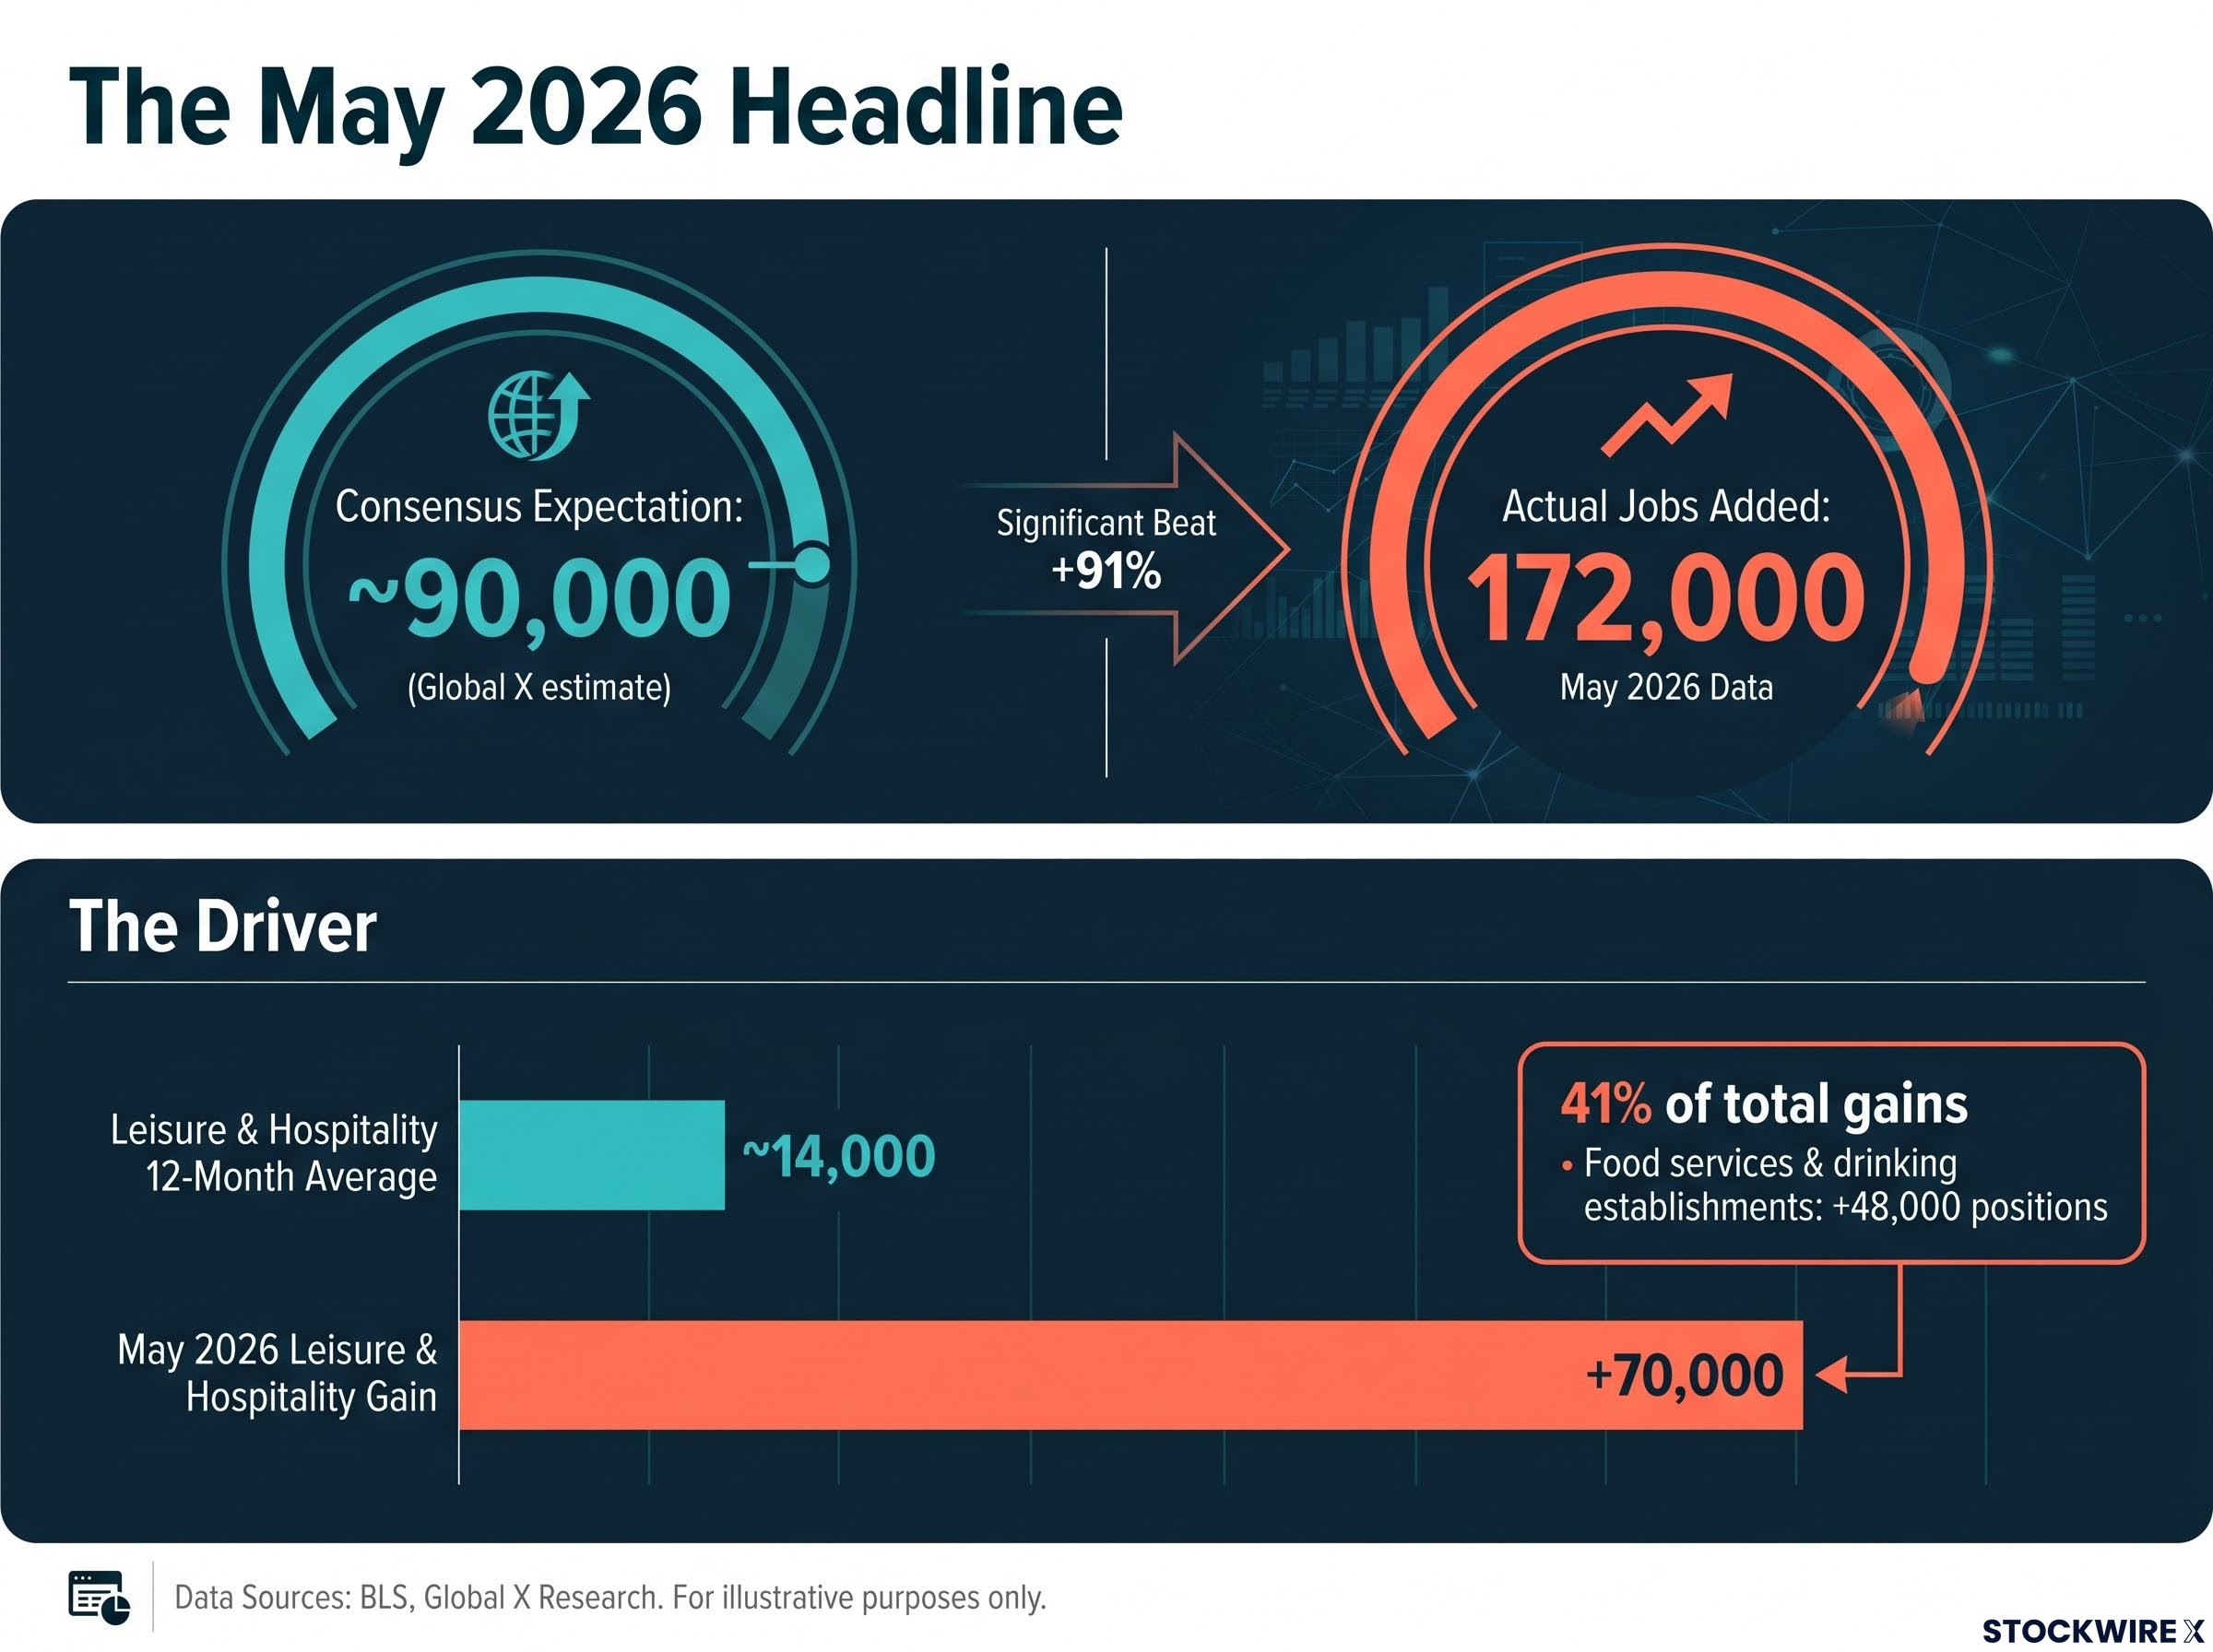
The anomaly: Leisure and hospitality averaged roughly 14,000 jobs per month over the prior year. In May, it added 70,000.
Within that 70,000, food services and drinking establishments contributed 48,000 positions, per the same Global X analysis. The profile of the gains, bartenders, servers, restaurant and bar staff, pointed toward something more specific than a broad-based hiring wave.
The 2026 FIFA World Cup was set to kick off in US host cities in mid-June, just after the period covered by the May payrolls survey. The BLS reference week captured the pay period including 12 May. Restaurants, bars, hotels, and event venues had to staff up ahead of the tournament, so the hiring wave showed up in the May data rather than during matches themselves.
The sharpest piece of evidence comes from the geographic split. Hospitality job postings in the 11 US World Cup host metros rose 30.3% in May versus the January-April 2026 average. Non-host US markets saw hospitality hiring decline 23.8% over the same comparison period.
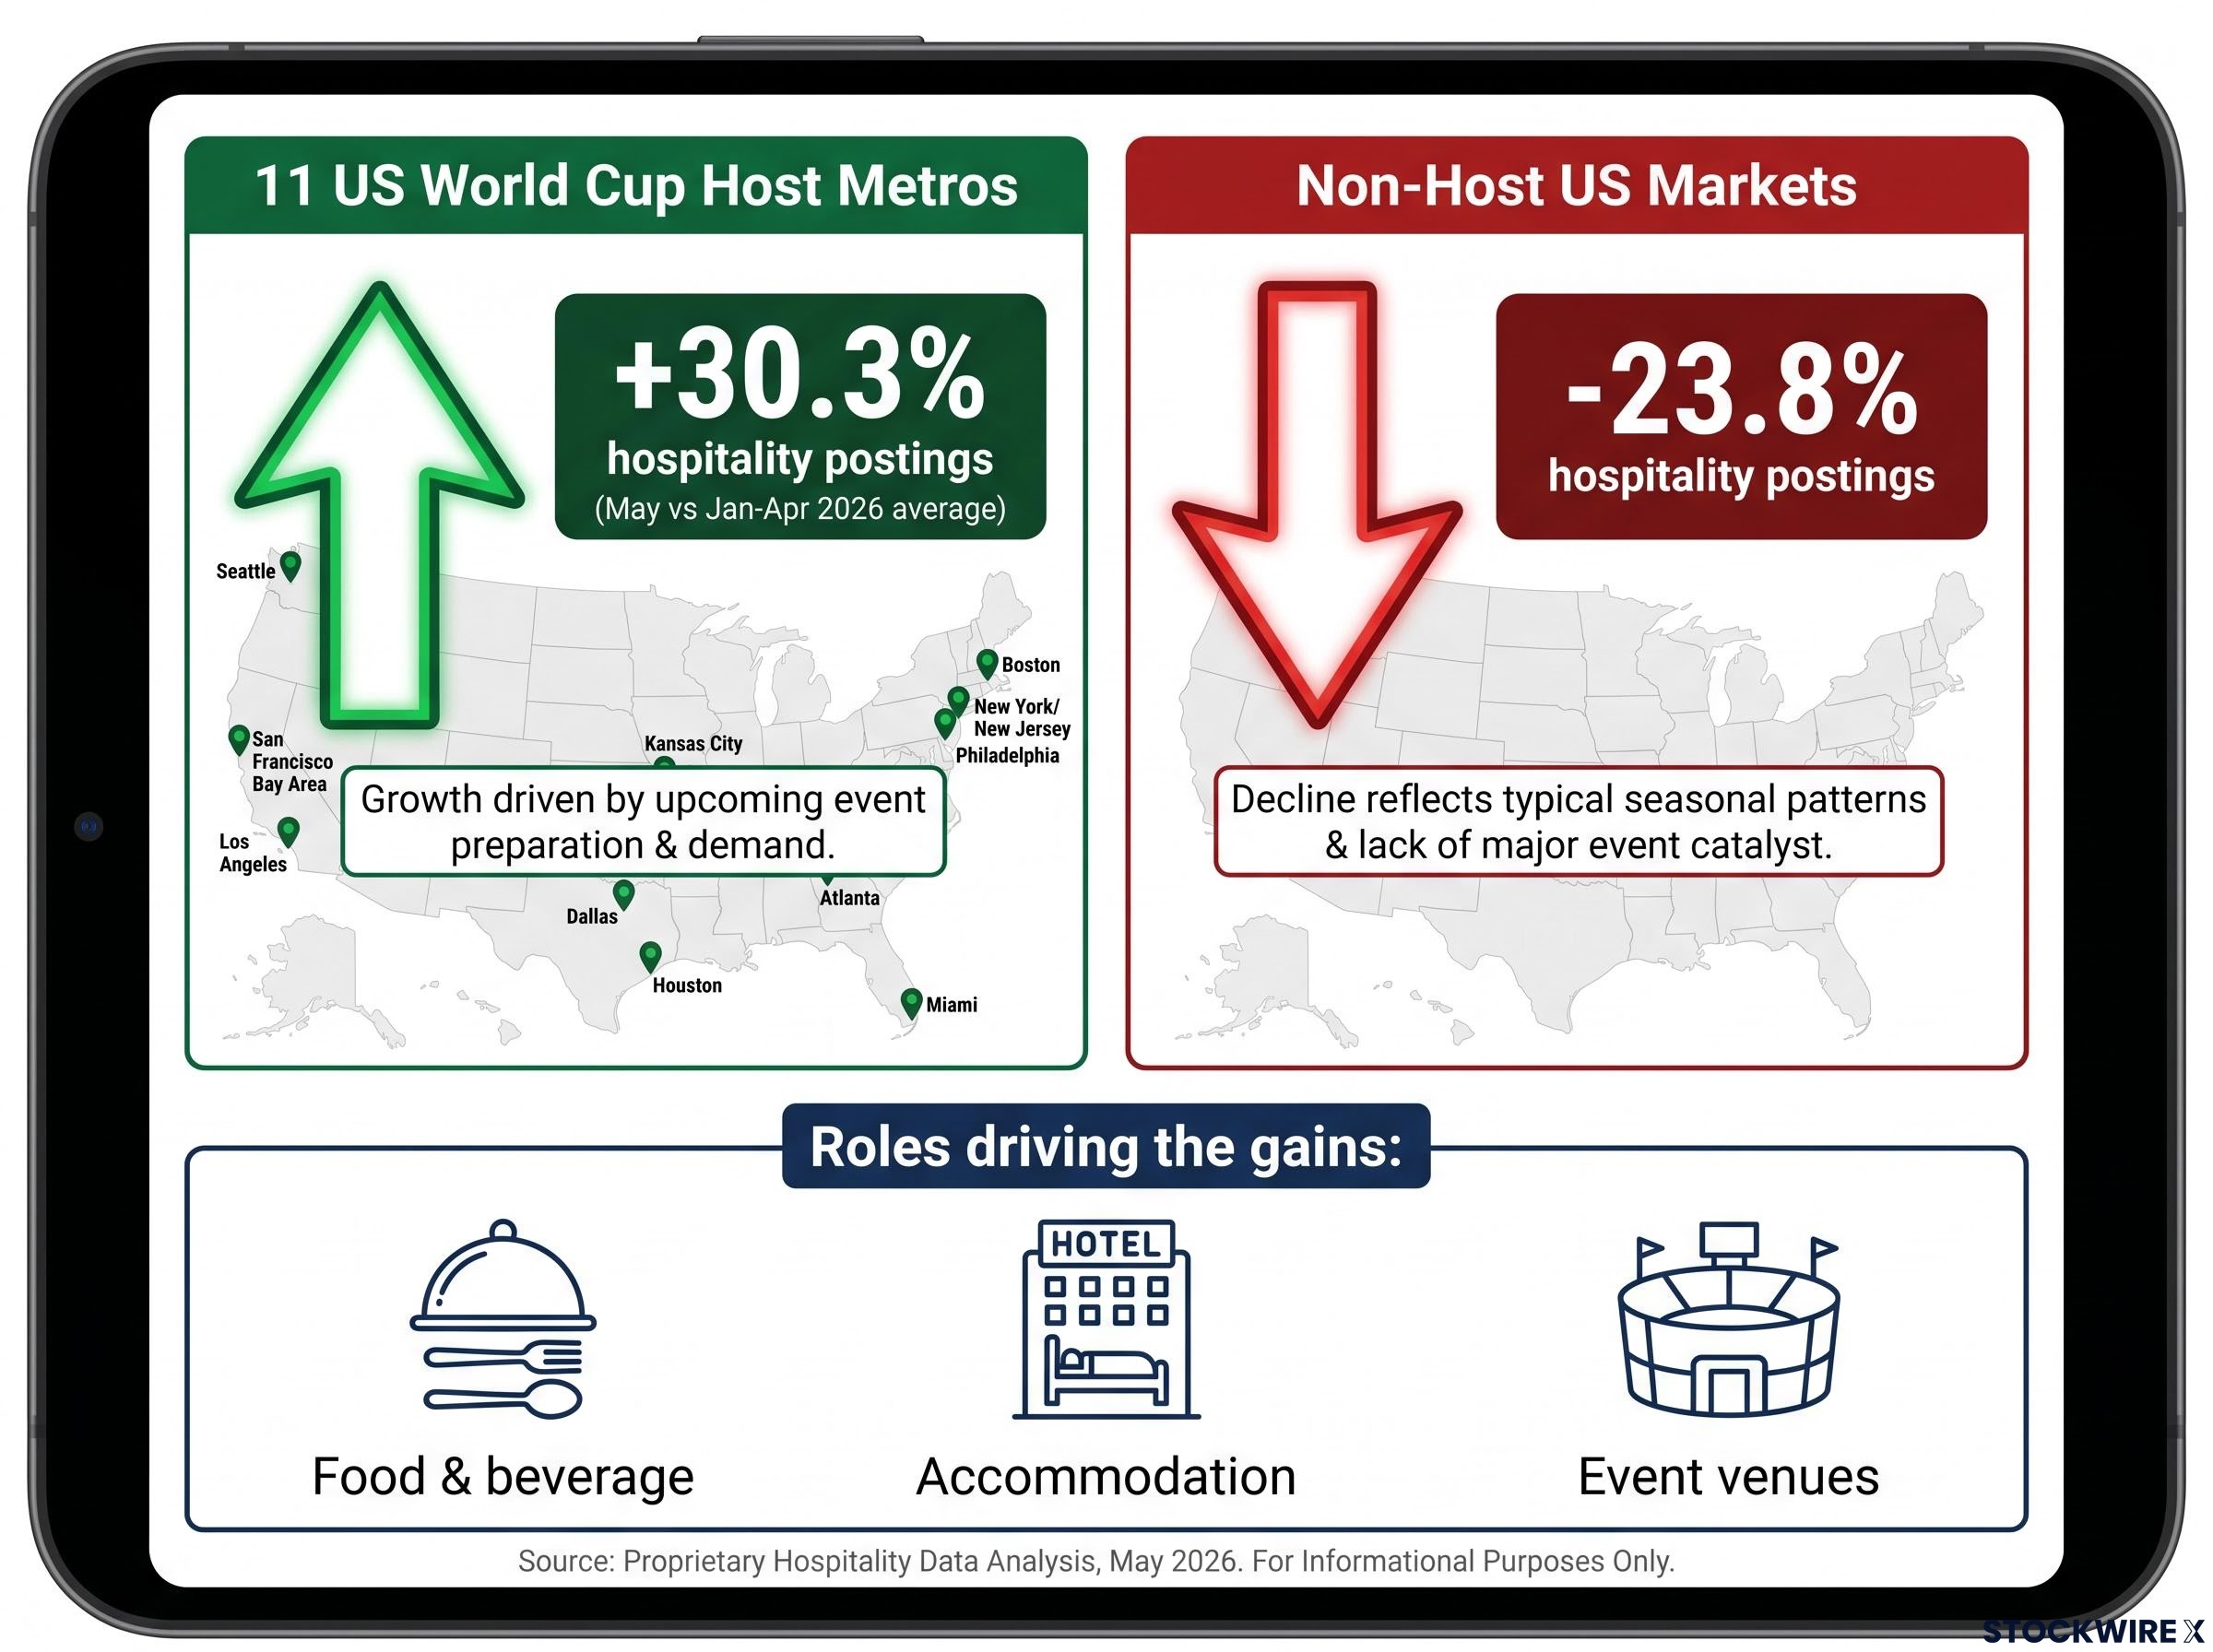
Host metros: +30.3% in hospitality postings versus January-April average Non-host markets: –23.8% over the same period
Bloomberg explicitly linked the hospitality surge to the United States and Canada “gearing up to host the FIFA World Cup starting the following week.” The role types driving the gains reinforced the tournament-demand profile:
A genuine broad re-acceleration of the US labour market would not produce a simultaneous surge in host metros and contraction in non-host markets. That geographic bifurcation is the pattern of localised, event-driven demand, not underlying economic momentum.
Academic research on the 1994 World Cup employment effects found no statistically significant positive impact on employment in host metropolitan areas and even identified a negative effect in retail trade, a historical precedent that supports scepticism about lasting labour market gains from mega-event hosting.
Nonfarm payrolls counts the total number of paid workers in the US economy, excluding farm employees, private household workers, and certain government employees. The Bureau of Labor Statistics (BLS) conducts its survey during the pay period that includes the 12th of each month. The resulting headline figure is an economy-wide aggregate, which means a concentrated burst of hiring in a single sector or region can move the number substantially without reflecting broader conditions.
Nonfarm payrolls is a lagging indicator: it confirms where the economy has already been rather than where it is heading, which is why equity markets often reprice before the data arrives and then partially reverse once the full composition is understood.
Applying a structured approach to each monthly release separates signal from noise. The May 2026 report provides a live example at every step.
When the headline and the ancillary indicators diverge this sharply, the headline is typically the less reliable signal. The May report is a case study in why that check matters.
Event-driven hiring follows a mechanical pattern. Demand drawn forward into May to prepare for a June tournament creates a natural basis for softer prints in the months that follow.
Three factors define the reversal risk:
If June or July payrolls prints disappoint, particularly in leisure and hospitality, the appropriate interpretation is payback from a May distortion, not a new signal of deterioration. The crowded positioning that amplified the May selloff creates symmetric risk on the downside if the next release underwhelms.
Investors who re-priced aggressively on the May beat face the prospect of having to re-price again in the opposite direction. Understanding the distortion in advance allows for more calibrated positioning.
For investors wanting to model the rate path implications in more depth, our deep-dive into the Fed rate cut timeline for 2026-2027 examines the Goldman Sachs and Bank of America forecast revisions, the core PCE trajectory, and the precise thresholds that would need to shift before the FOMC considers easing.
The May report was not purely noise. Government added 52,000 jobs. Private education and health services contributed 40,000. Indeed Hiring Lab noted that growth was “more broad-based in May than we have seen in recent months.” That breadth was genuine.
The argument is narrower: the anomalous component, the piece that transformed a consensus-range print into a 172,000 beat, was concentrated in a single sector, in specific cities, ahead of a specific event. Leisure and hospitality’s 70,000 gain against a 12-month trend of approximately 14,000 per month is the statistical signature of World Cup preparation, not a shift in underlying labour demand.
The broader labour market picture has not changed. Hires and layoffs rates remain subdued. Long-term unemployment sits at 27.5%. The economy is still operating in the low-hire, low-fire pattern that preceded the May print.
Indeed Hiring Lab’s May 2026 analysis characterised the broader jobs market as a low-hire, low-fire environment with long-term unemployment at 27.5%, well above pre-pandemic norms, reinforcing the case that the headline beat reflected an isolated sector surge rather than a structural acceleration in labour demand.
One payrolls release, even a strong one, does not reset the macro narrative. The June and July prints will be the true test of whether underlying momentum has shifted, or whether May was the outlier the sector data suggests it was.
Markets regularly overreact to single data points. The investors who calibrate more effectively over time are those who can distinguish between genuine regime changes and event-driven noise embedded in headline figures.
This article is for informational purposes only and should not be considered financial advice. Investors should conduct their own research and consult with financial professionals before making investment decisions. Past performance does not guarantee future results. Financial projections are subject to market conditions and various risk factors.
The May 2026 jobs report showed nonfarm payrolls rose by 172,000, nearly double the consensus forecast of roughly 90,000, with leisure and hospitality accounting for approximately 41% of total gains at 70,000 jobs added in a single month.
The outsized gain was largely driven by FIFA World Cup preparation, as restaurants, bars, hotels, and event venues in the eleven US host cities staffed up ahead of the tournament, producing a 30.3% surge in hospitality job postings in host metros versus a 23.8% decline in non-host markets.
The Nasdaq fell 3.3% and the S&P 500 dropped 2.4% across the two sessions following the release, as rate-cut positioning was rapidly unwound and rate-hike expectations shifted toward mid-2027.
Because the May surge was driven by event-specific hiring in World Cup host cities, temporary roles are expected to roll off after the tournament ends, meaning June and July prints could disappoint as hospitality payrolls mean-revert, a pattern investors should interpret as payback rather than new deterioration.
Analysts should check sector composition, compare sector gains to trend rates, look for geographic concentration, cross-check with hires and layoffs rates, and review the long-term unemployment share, because when these ancillary indicators diverge sharply from the headline, the headline is typically the less reliable signal.