
SRG Global surged 16.6% in a single session on 3 June 2026, held those gains through the week, closed at $3.80 on 12 June, and delivered a 148.4% return to investors who held for twelve months. That data point alone would make for a compelling stock story. But SRG Global was not an outlier. It was one of six ASX Industrials sector constituents to reach fresh 52-week highs during Week 25, while zero Industrials names recorded new lows. The S&P/ASX 200 gained 2.0% for the week, though the advance was uneven, powered largely by previously out-of-favour sectors rather than broad-based momentum. Against that backdrop, the Industrials sector’s dominance of the highs list was not a coincidence but the visible output of converging structural tailwinds. This analysis examines what is driving the sector’s outperformance, profiles the six stocks at new highs, explores adjacent M&A and capital raising activity that the formal highs list does not capture, and distils what the Week 25 data means for investors watching the ASX industrials sector.
Industrials claimed every sector high while posting zero lows in Week 25
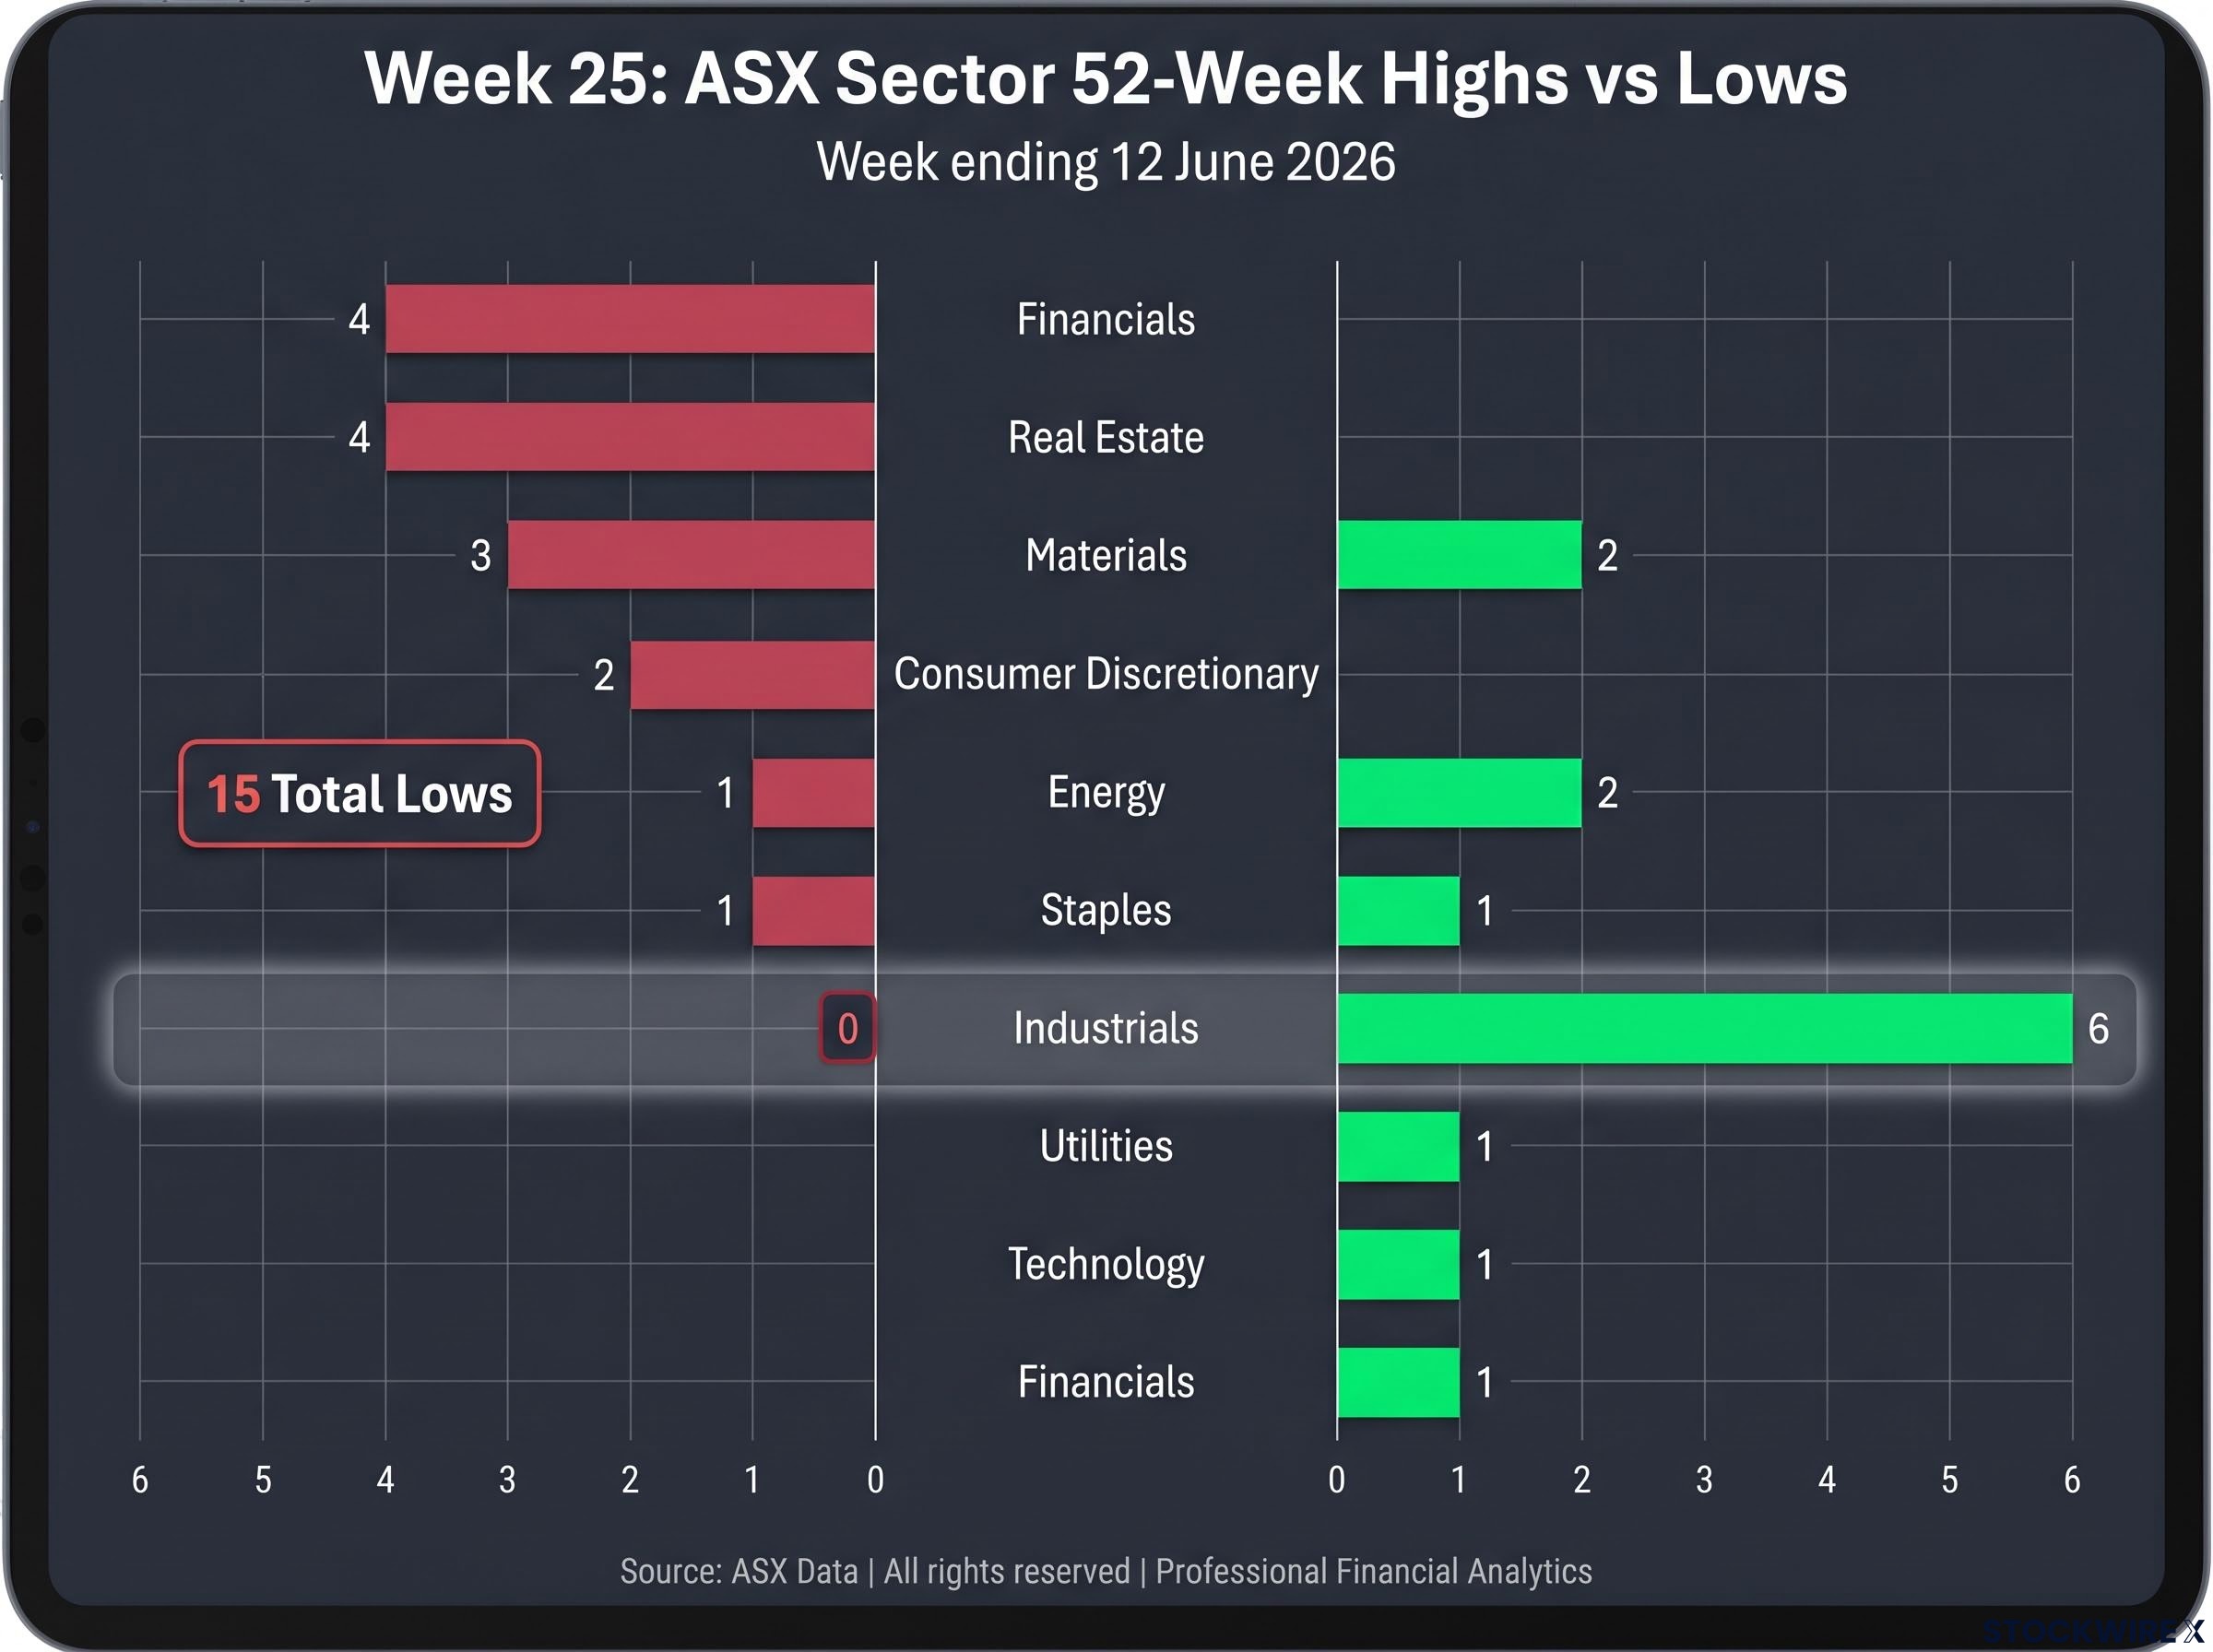
Six Industrials stocks at new 52-week highs. Zero at new lows. No other sector came close to that ratio during the week ending 12 June 2026.
The broader highs list tells the contrast clearly:
- Industrials: 6 new highs
- Energy: 2
- Materials: 2
- Utilities: 1
- Technology: 1
- Staples: 1
- Financials: 1
On the other side of the ledger, 15 stocks touched new 52-week lows, spread across six sectors:
- Financials: 4 new lows
- Real Estate: 4
- Materials: 3
- Consumer Discretionary: 2
- Energy: 1
- Staples: 1
The lows were dispersed. The highs were concentrated. That concentration matters because the six Industrials names span genuinely different sub-industries, from contracting and toll roads to freight rail and port logistics. A single thematic trade does not explain it.
| Stock (ASX Code) | Sub-industry | Week Close | Weekly Change | 12-Month Change |
|---|---|---|---|---|
| SRG Global (SRG) | Contracting | $3.80 | +16.6% | +148.4% |
| Ventia Services (VNT) | Infrastructure services | $6.50 | +4.5% | +30.8% |
| Dalrymple Bay Infrastructure (DBI) | Port logistics | $5.89 | +4.8% | +52.6% |
| Transurban (TCL) | Toll roads | $15.61 | +4.1% | +8.4% |
| Aurizon (AZJ) | Freight rail | $4.36 | +0.7% | +40.7% |
| Qube Holdings (QUB) | Diversified logistics and ports | $5.07 | +1.4% | +18.7% |
When big ASX news breaks, our subscribers know first
The structural forces behind the Industrials rally
The six highs are not the product of a single catalyst. They are the output of four structural tailwinds that have been building independently and are now reinforcing each other.
- Infrastructure spending cycles. Federal and state capital expenditure programmes in transport, water, and social infrastructure remain elevated, with project pipelines supporting order books into the late 2020s.
- Defence contracting acceleration. Australia’s expanding defence commitments, including AUKUS-related procurement, are flowing through to listed maintenance, engineering, and logistics contractors.
- Data centre construction. Demand for AI-ready data centre capacity has triggered a wave of construction contracts, particularly for specialist electrical and mechanical contractors.
- Earnings upgrade dynamics. Several Industrials names have entered a positive guidance revision cycle, with conservative initial forecasts being upgraded as contract wins exceed expectations.
AI-driven data centre construction has become one of the more consequential demand sources for specialist electrical and mechanical contractors, with global hyperscalers committing over US$150 billion in combined capital expenditure during 2024 and Australia’s grid regulator formally identifying data centres as a structural electricity demand driver through the early 2030s.
Infrastructure Australia’s national project pipeline, covering a five-year Major Public Infrastructure commitment valued at approximately $242 billion, provides the capital expenditure foundation that is sustaining order book visibility for listed contractors well into the late 2020s.
Each of these tailwinds would be sufficient, on its own, to support improved earnings visibility for listed contractors and infrastructure operators. Together, they compress the gap between contract announcements and guidance upgrades.
Companies like SRG Global are now pairing record contract wins with immediate guidance upgrades, rather than allowing analysts to model through the impact over time. That compression is amplifying share price reactions when newsflow lands.
The sector’s re-rating, viewed through this lens, reflects overlapping, self-reinforcing drivers rather than a single catalyst that could reverse quickly.
What SRG Global’s 16.6% session tells us about the current tape
The mechanics of SRG Global’s 3 June 2026 announcement are worth reconstructing, because they reveal how the market is pricing contract newsflow right now.
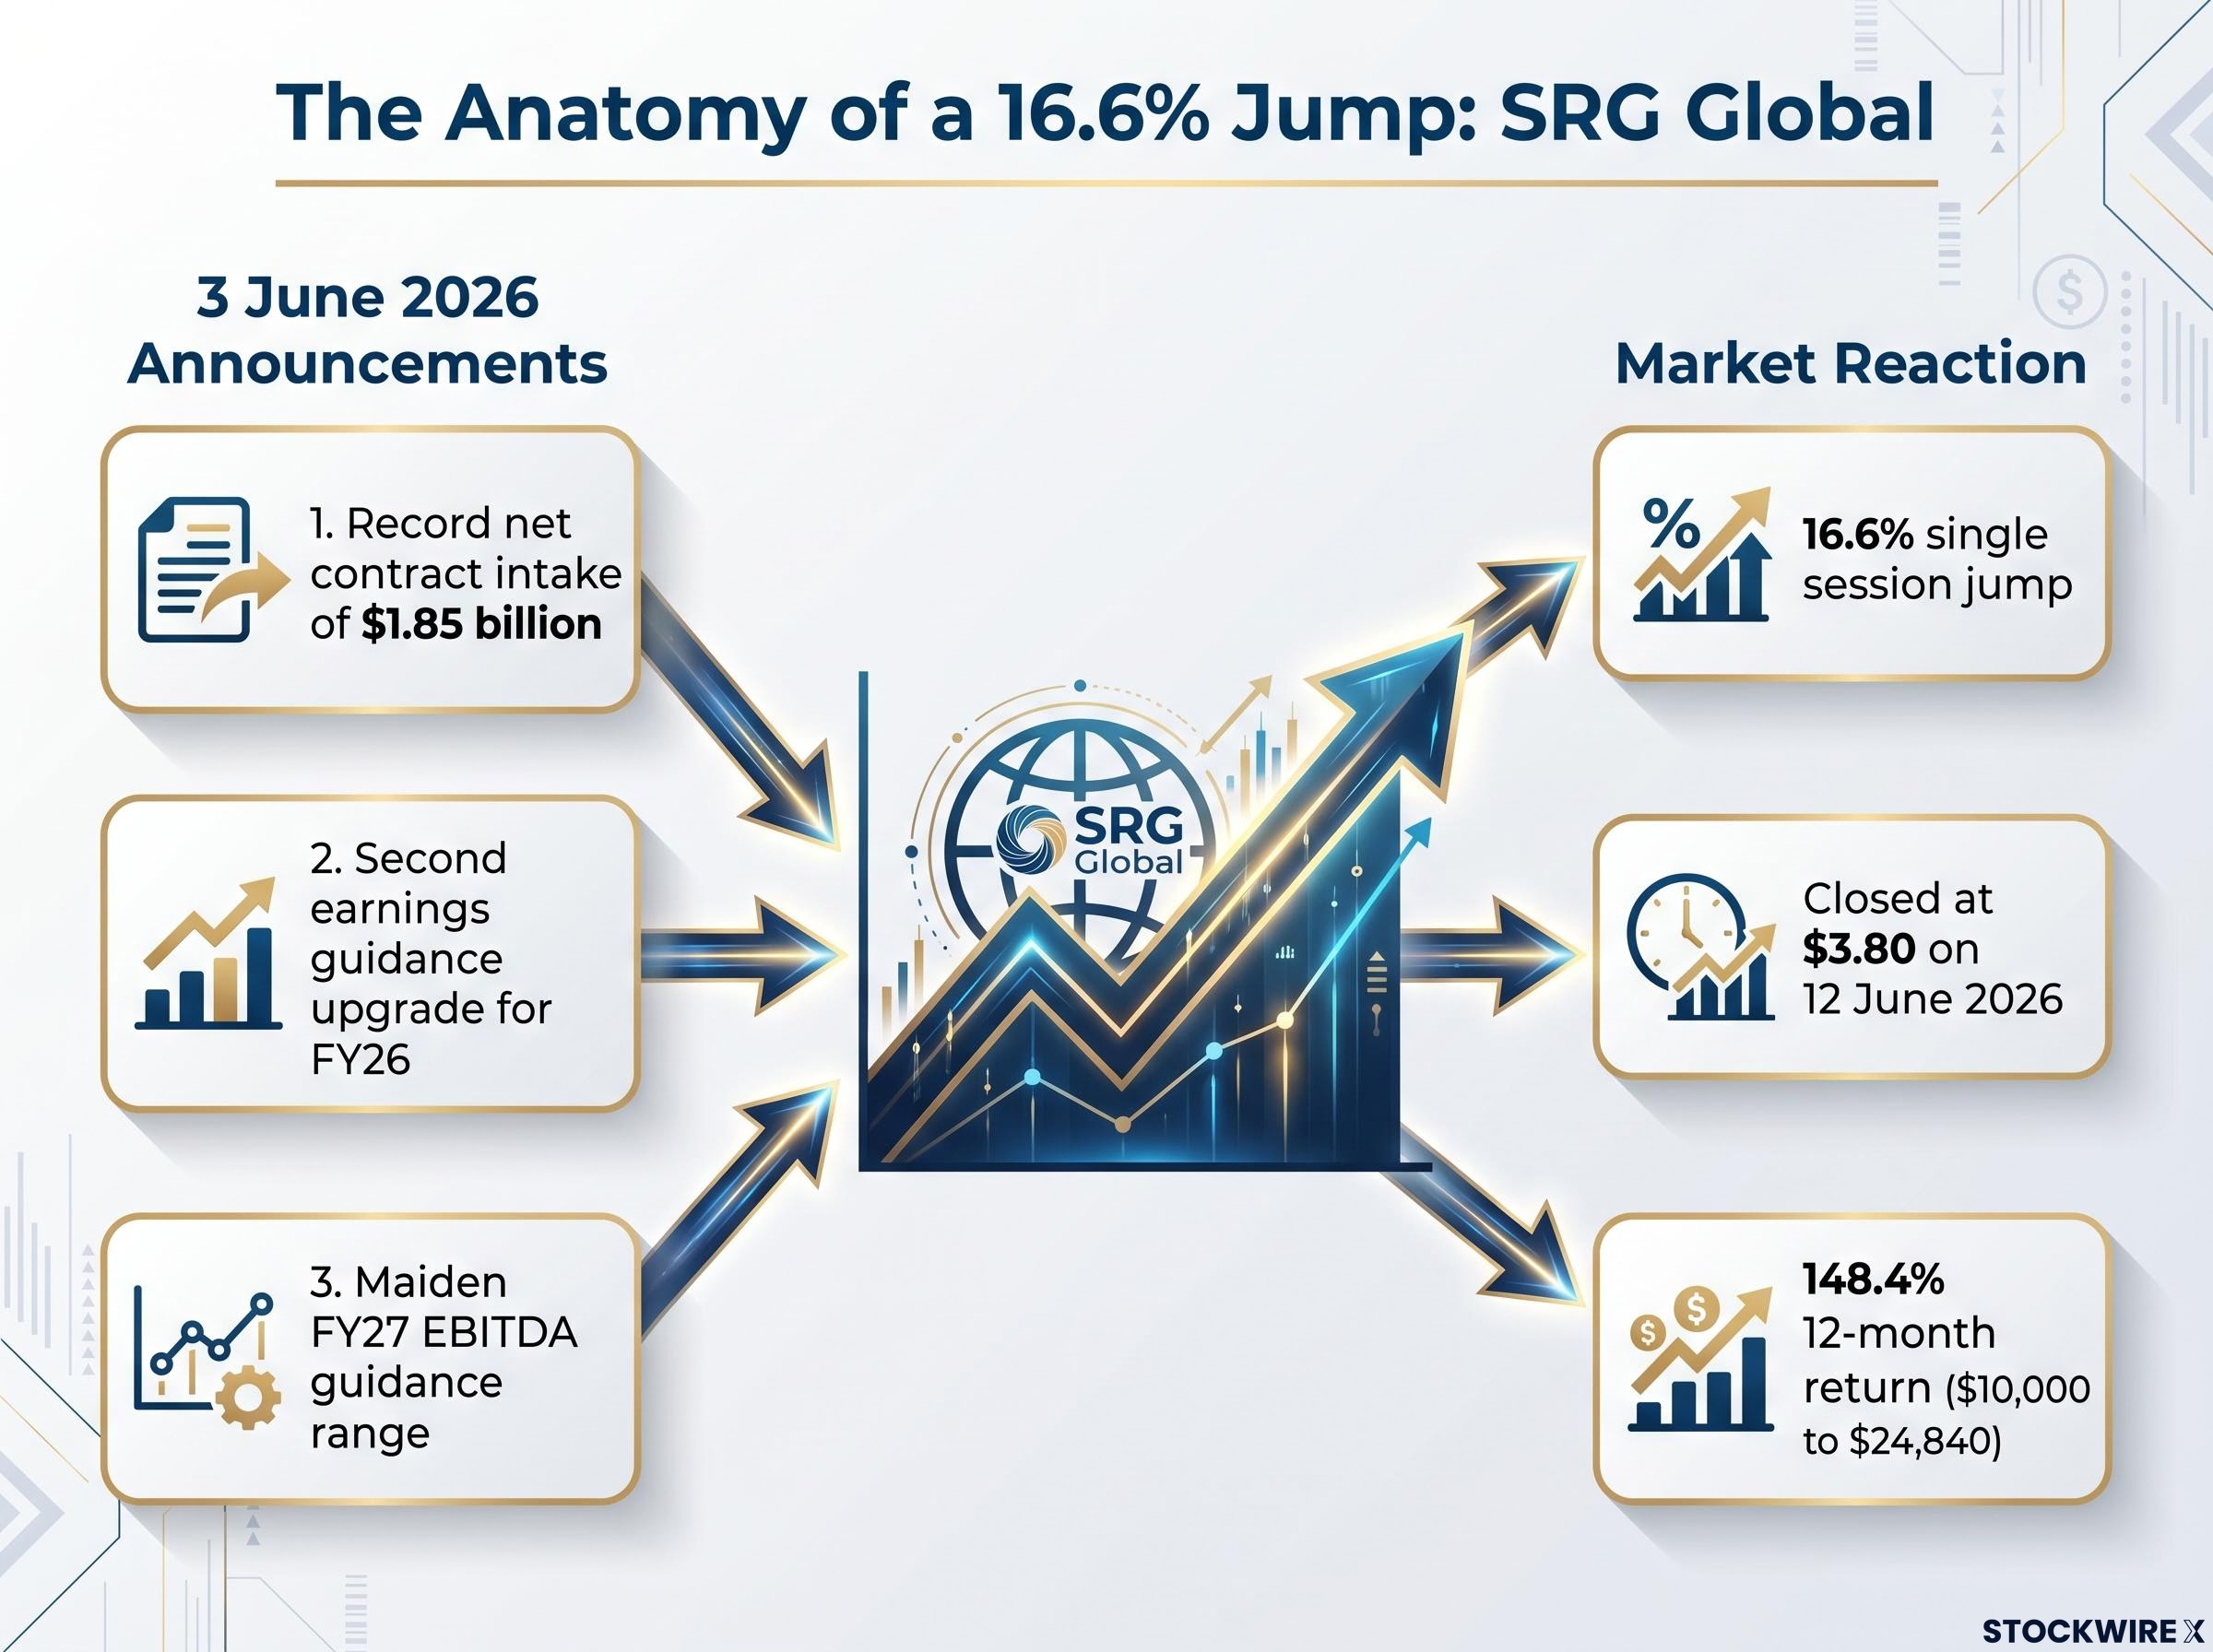
The company announced a record net contract intake of $1.85 billion. That alone would have moved the stock. But SRG paired it with the second earnings guidance upgrade for FY26 and, more unusually, a maiden FY27 EBITDA guidance range. The three announcements landed simultaneously.
SRG Global’s contract and guidance announcement on 3 June 2026 combined three disclosures simultaneously: a record $1.85 billion net contract intake spanning eight sectors, an upgrade to the top end of FY26 EBITDA guidance, and a maiden FY27 EBITDA range explicitly positioned above market consensus, a combination that compressed the analyst modelling lag typically separating contract wins from share price re-rating.
The effect was immediate. Shares jumped 16.6% in a single session. They held those gains through the week, closing at $3.80 on 12 June 2026.
An investor who bought $10,000 of SRG Global shares twelve months earlier would have been sitting on approximately $24,840 as of 12 June 2026, a 148.4% return.
Issuing forward guidance alongside a contract win is unusual for mid-cap contractors. The combination collapsed the typical analyst modelling lag, where the market waits for brokers to revise earnings estimates before re-pricing the stock. SRG’s management chose to do that work for the market.
What investors should watch for next
SRG Global is both the sector’s standout performer and a template for identifying similar catalysts across the Industrials space. Three monitoring signals are worth tracking:
- ASX announcement filings for combined contract wins paired with guidance disclosures, the signature of management confidence.
- Pipeline conversion commentary in quarterly updates, which signals whether contract announcements are translating into revenue.
- Margin assumption language in guidance ranges, which reveals whether management is building conservatism into forecasts or has already stripped it out.
M&A and capital raisings amplify the picture beyond the highs list
The formal 52-week highs list captures one dimension of Industrials momentum. Two cases from outside the ASX 200 list suggest the underlying current is stronger than the headline data shows.
Tasmea reached record price levels earlier in June 2026 after announcing an acquisition valued at approximately $184 million. The deal is estimated to boost FY26 earnings per share (EPS) by roughly 31%, a level of accretion that explains the market’s response. Tasmea is not in the ASX 200 highs list, but its price reaction illustrates how markets are differentiating EPS-accretive, transformative deals from strategic-but-dilutive ones.
Southern Cross Electrical Engineering announced a $165 million placement on 15 June 2026 to fund major data centre projects. More notably, it issued FY27 EBITDA growth guidance above 33% year-on-year, against consensus of approximately 9%. That guidance-versus-consensus gap of approximately 24 percentage points is one of the more striking divergences in the space.
| Company | Transaction | Key Financial Signal | Market Implication |
|---|---|---|---|
| Tasmea | ~$184M acquisition | ~31% FY26 EPS accretion | Market rewards financially compelling, executable deals |
| Southern Cross Electrical | $165M placement | FY27 EBITDA guidance >33% YoY vs ~9% consensus | ~24 ppt gap implies substantial analyst upgrades or demanding execution bar |
The broader principle: EPS accretion and guidance confidence are the variables the market is pricing, not deal size or strategic rationale alone. For investors scanning the ASX 200 highs list in isolation, two of the most instructive data points in the Industrials space this week are invisible.
Understanding 52-week highs and lows as sector health indicators
A single stock reaching a new 52-week high signals individual momentum. Six stocks within one sector reaching new highs simultaneously, while zero from that sector record new lows, signals something structural.
Market breadth indicators tell a more complete story than headline index returns precisely because a flat or positive index can mask severe deterioration in the number of stocks participating in any advance; in the week ending 1 May 2026, 22 ASX 200 constituents hit fresh 52-week lows even as the headline index fell just 0.65%, a divergence that warned of concentrated stress months before the Week 25 Industrials highs cluster confirmed which sectors were absorbing that displaced capital.
- Sector concentration in highs suggests that a shared driver, whether policy, capital flows, or earnings momentum, is lifting the group. The more diverse the sub-industries within the cluster, the stronger the signal that the driver is sector-wide rather than thematic.
- Dispersed lows across multiple sectors suggest stock-specific problems rather than a systemic macro issue. When no single sector dominates the lows list, the weakness is idiosyncratic and requires company-level analysis, not a sector call.
One dynamic that weekly close data can obscure: the Materials sector declined as much as 6.0% through mid-week before recovering to close positive. Intraweek volatility of that magnitude means the weekly snapshot may not capture the full risk investors experienced.
On the lows side, several names bounced sharply into week’s end. Lendlease gained +15.7% for the week but remains down 48.3% over twelve months. Stockland rose +11.6% but is still 24.2% lower year-on-year. Temple & Webster added +11.0% for the week against a 76.4% annual decline.
Sustained recoveries typically require multiple weeks of follow-through and a clear fundamental driver, not just short covering or technical bounces. Sharp weekly rebounds from deeply negative annual performance should not be mistaken for confirmed bottoms.
Where ASX Industrials momentum is heading and what investors should watch
Five implications emerge from the Week 25 data:
- Broad structural support. Six highs and zero lows across contracting, logistics, rail, and toll roads point to genuine sector breadth, underpinned by multi-year drivers.
- Contract announcements are the near-term catalyst. SRG Global’s 16.6% session demonstrated how powerful combined contract and guidance newsflow is in the current tape.
- M&A accretion matters more than deal size. Tasmea’s price reaction to approximately 31% EPS accretion confirms markets are rewarding financially compelling acquisitions.
- The lows list is stock-specific, not macro. Weakness dispersed across six sectors with no dominant group means the lows require company-level analysis, not a broad defensive posture.
- Rebound scepticism is warranted. Names like Lendlease and Temple & Webster posted strong weekly gains from new lows, but annual performance remains deeply negative.
Forward monitoring variables include ASX announcement filings for contract wins paired with guidance revisions, pipeline conversion commentary in interim results, and the interest rate trajectory as the swing factor for rate-sensitive names like Transurban, whose 8.4% annual gain at a new high reflects evolving rate expectations.
Rate-sensitive infrastructure assets face a structural valuation tension that Transurban’s relatively modest 8.4% annual gain, compared to contractors like SRG Global at 148.4%, partly reflects: rising discount rates compress the present value of long-duration toll road income streams even when underlying traffic volumes and pricing remain robust, as Scentre Group’s experience of a 12.3% share price decline against record operating fundamentals in the same period illustrates.
Execution risk: when guidance gaps become headwinds
Southern Cross Electrical Engineering’s guidance-versus-consensus gap of approximately 24 percentage points sets a demanding bar. A gap of that magnitude shifts from a positive catalyst to a potential headwind if management delivery falls short.
Ventia Services, with its 30.8% annual gain supported by long-term contracts, represents the defensive end of the Industrials spectrum. Southern Cross represents the higher-risk, higher-reward end. Investors should weigh whether the sector’s re-rating has already priced in strong execution, particularly for names where guidance sits well above consensus.
The Industrials story in Week 25 is confirmation, not coincidence
Six Industrials highs, zero lows, and adjacent M&A activity that reinforces the same narrative: the Week 25 data is not random clustering. It is the visible confirmation of a sector theme that has been building for months, powered by infrastructure capex, defence spending, and data centre construction, all with multi-year pipeline visibility.
The most important analytical distinction for investors is between those durable tailwinds and the more fragile near-term price drivers, including short-term contract newsflow and intraweek bounces from lows. The next sector-defining catalyst to watch is interim earnings season, where guidance revision patterns will either confirm or challenge the re-rating implied by current prices.
This article is for informational purposes only and should not be considered financial advice. Investors should conduct their own research and consult with financial professionals before making investment decisions. Past performance does not guarantee future results.