
SpaceX IPO Hits $3 Trillion Market Cap in 72 Hours
10 mins ago
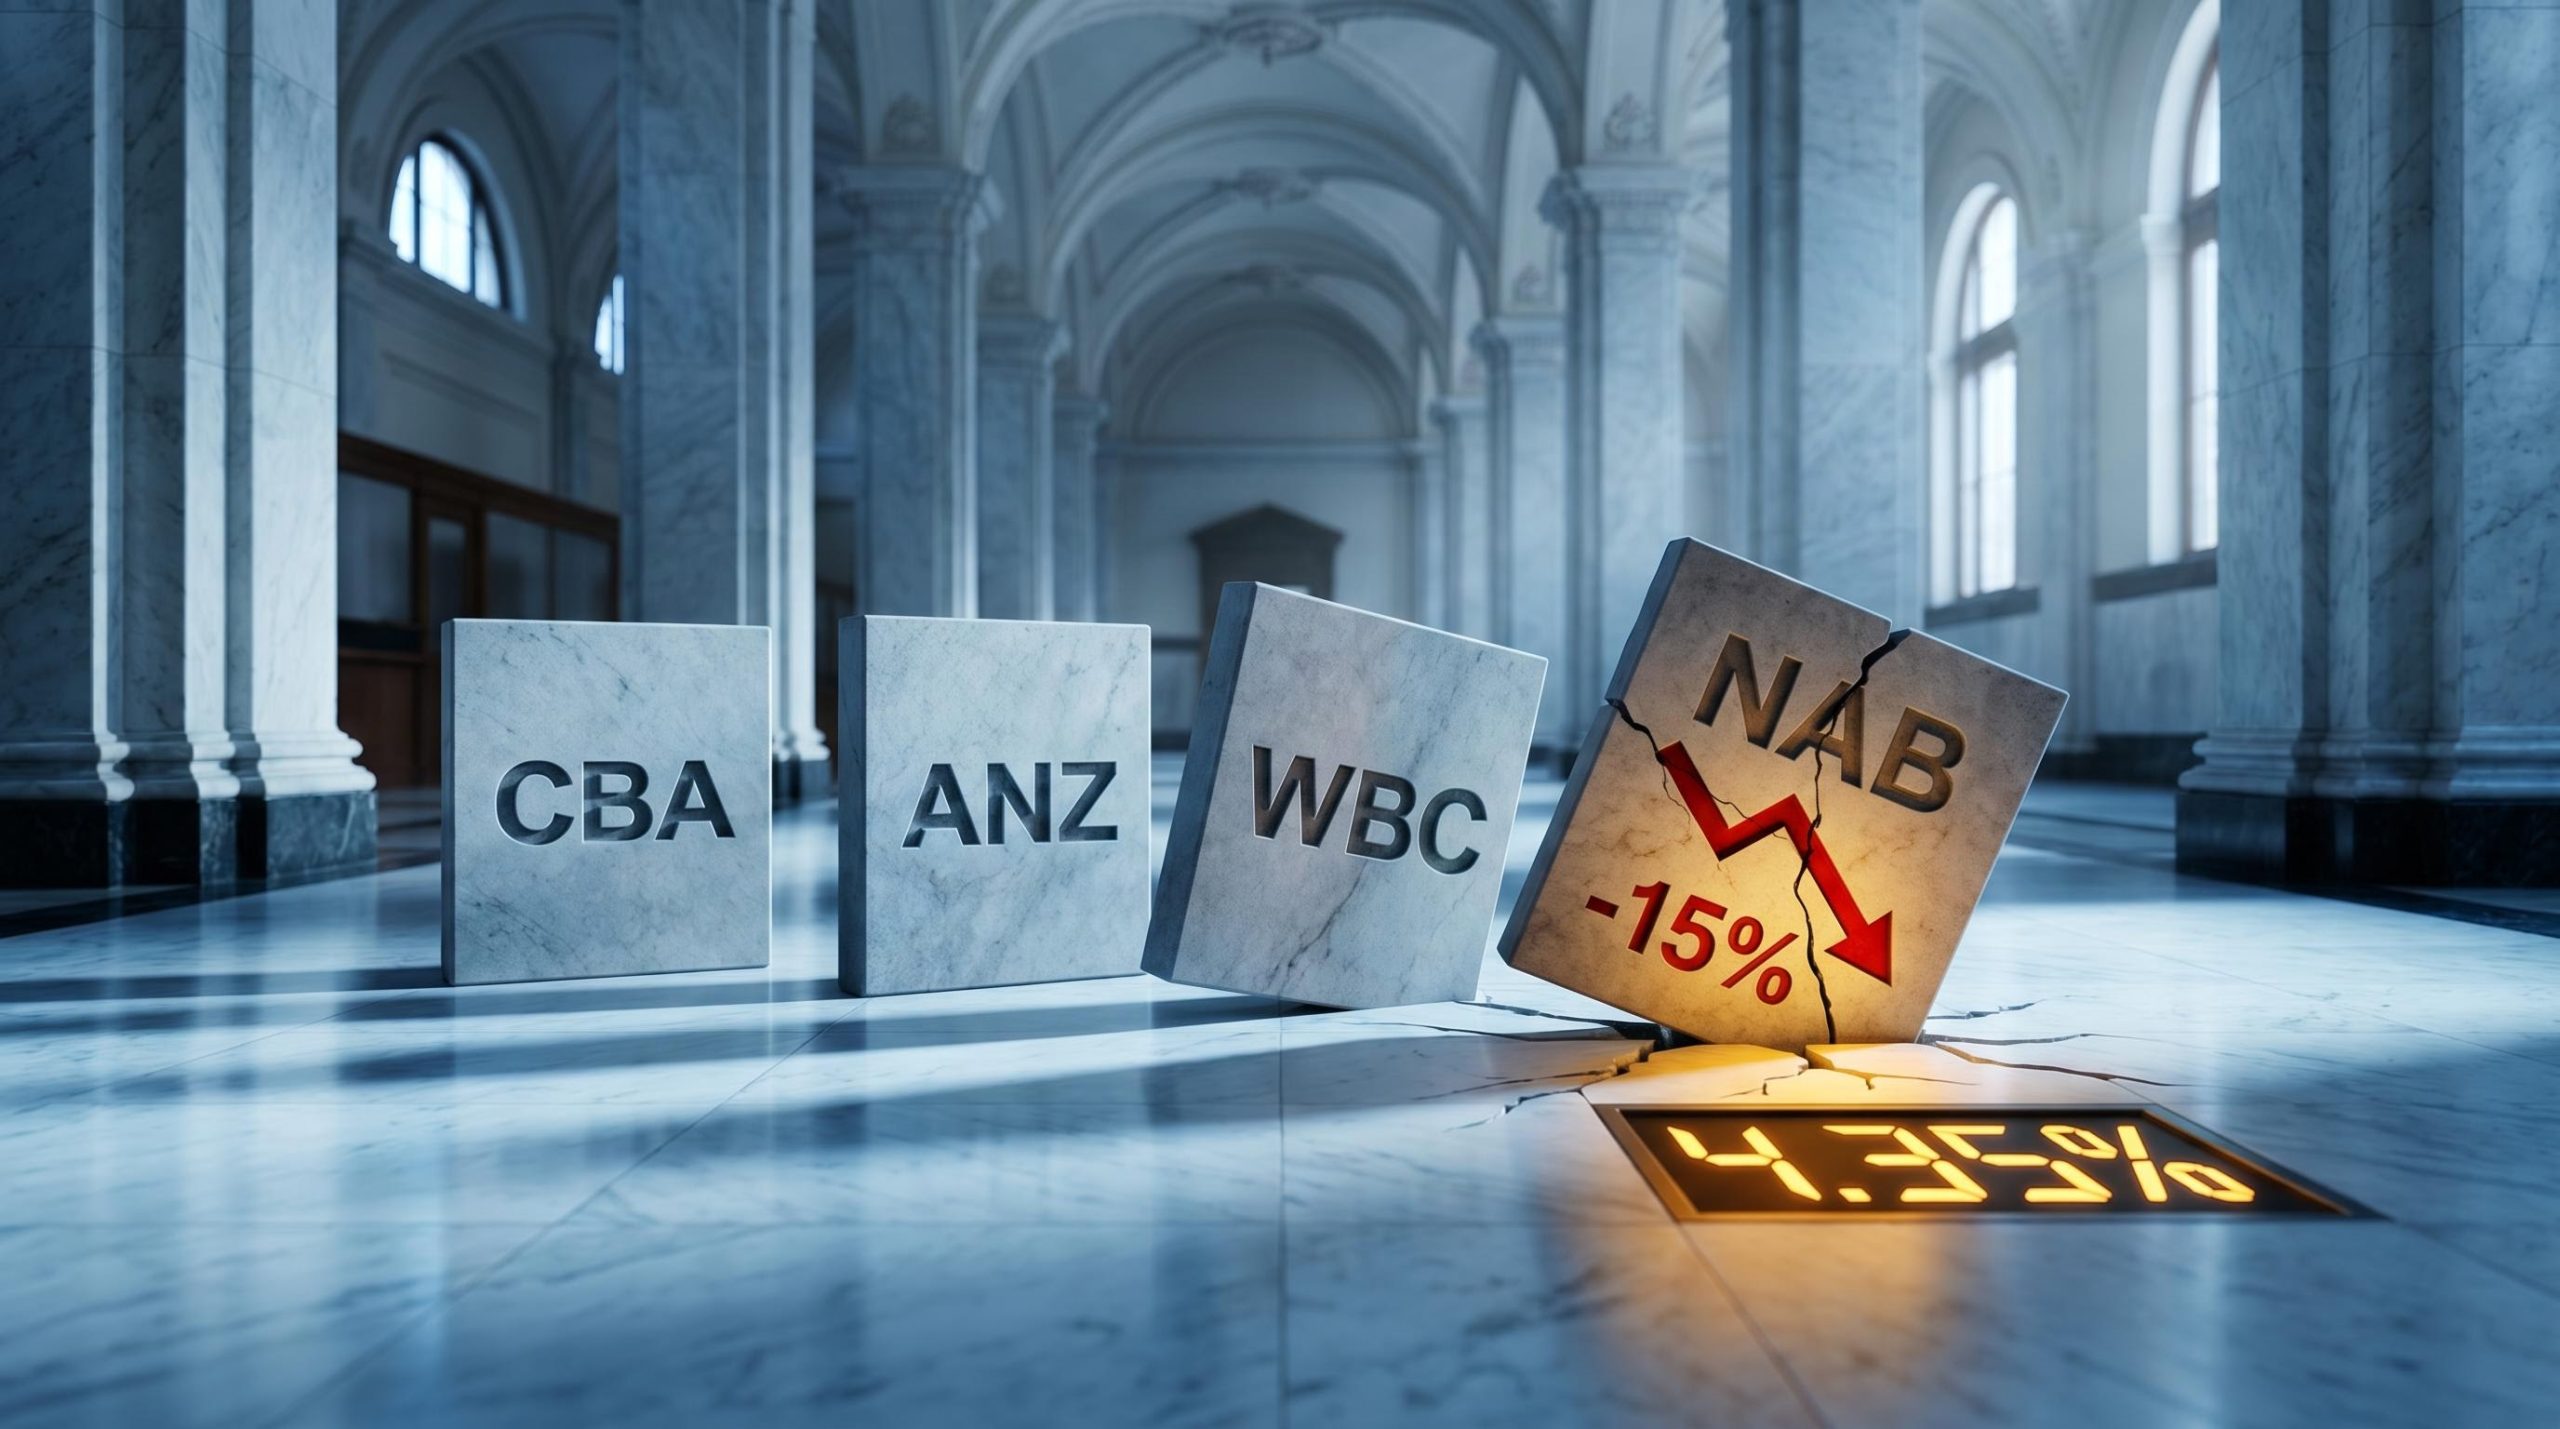
NAB has shed nearly 15% of its market value since January 2026. Westpac is down around 10%. Even the perennially expensive Commonwealth Bank has slipped. All four major ASX bank shares are underwater year-to-date, and the Reserve Bank of Australia’s next decision on 16 June 2026 could determine whether that slide deepens or stabilises.
The declines are not happening from cheap levels. After a strong 2025 rally that left the sector trading at historically elevated multiples, the big four entered 2026 already priced for a near-perfect outcome. Three RBA hikes since February have changed that calculus, raising the cash rate to 4.35% and forcing a reassessment of whether bank earnings can support current prices in a restrictive rate environment.
What follows unpacks the drivers behind the 2026 weakness, explains the specific mechanics linking RBA decisions to bank share prices, and maps out what each plausible scenario at the 16 June meeting means for investors holding or watching the big four.
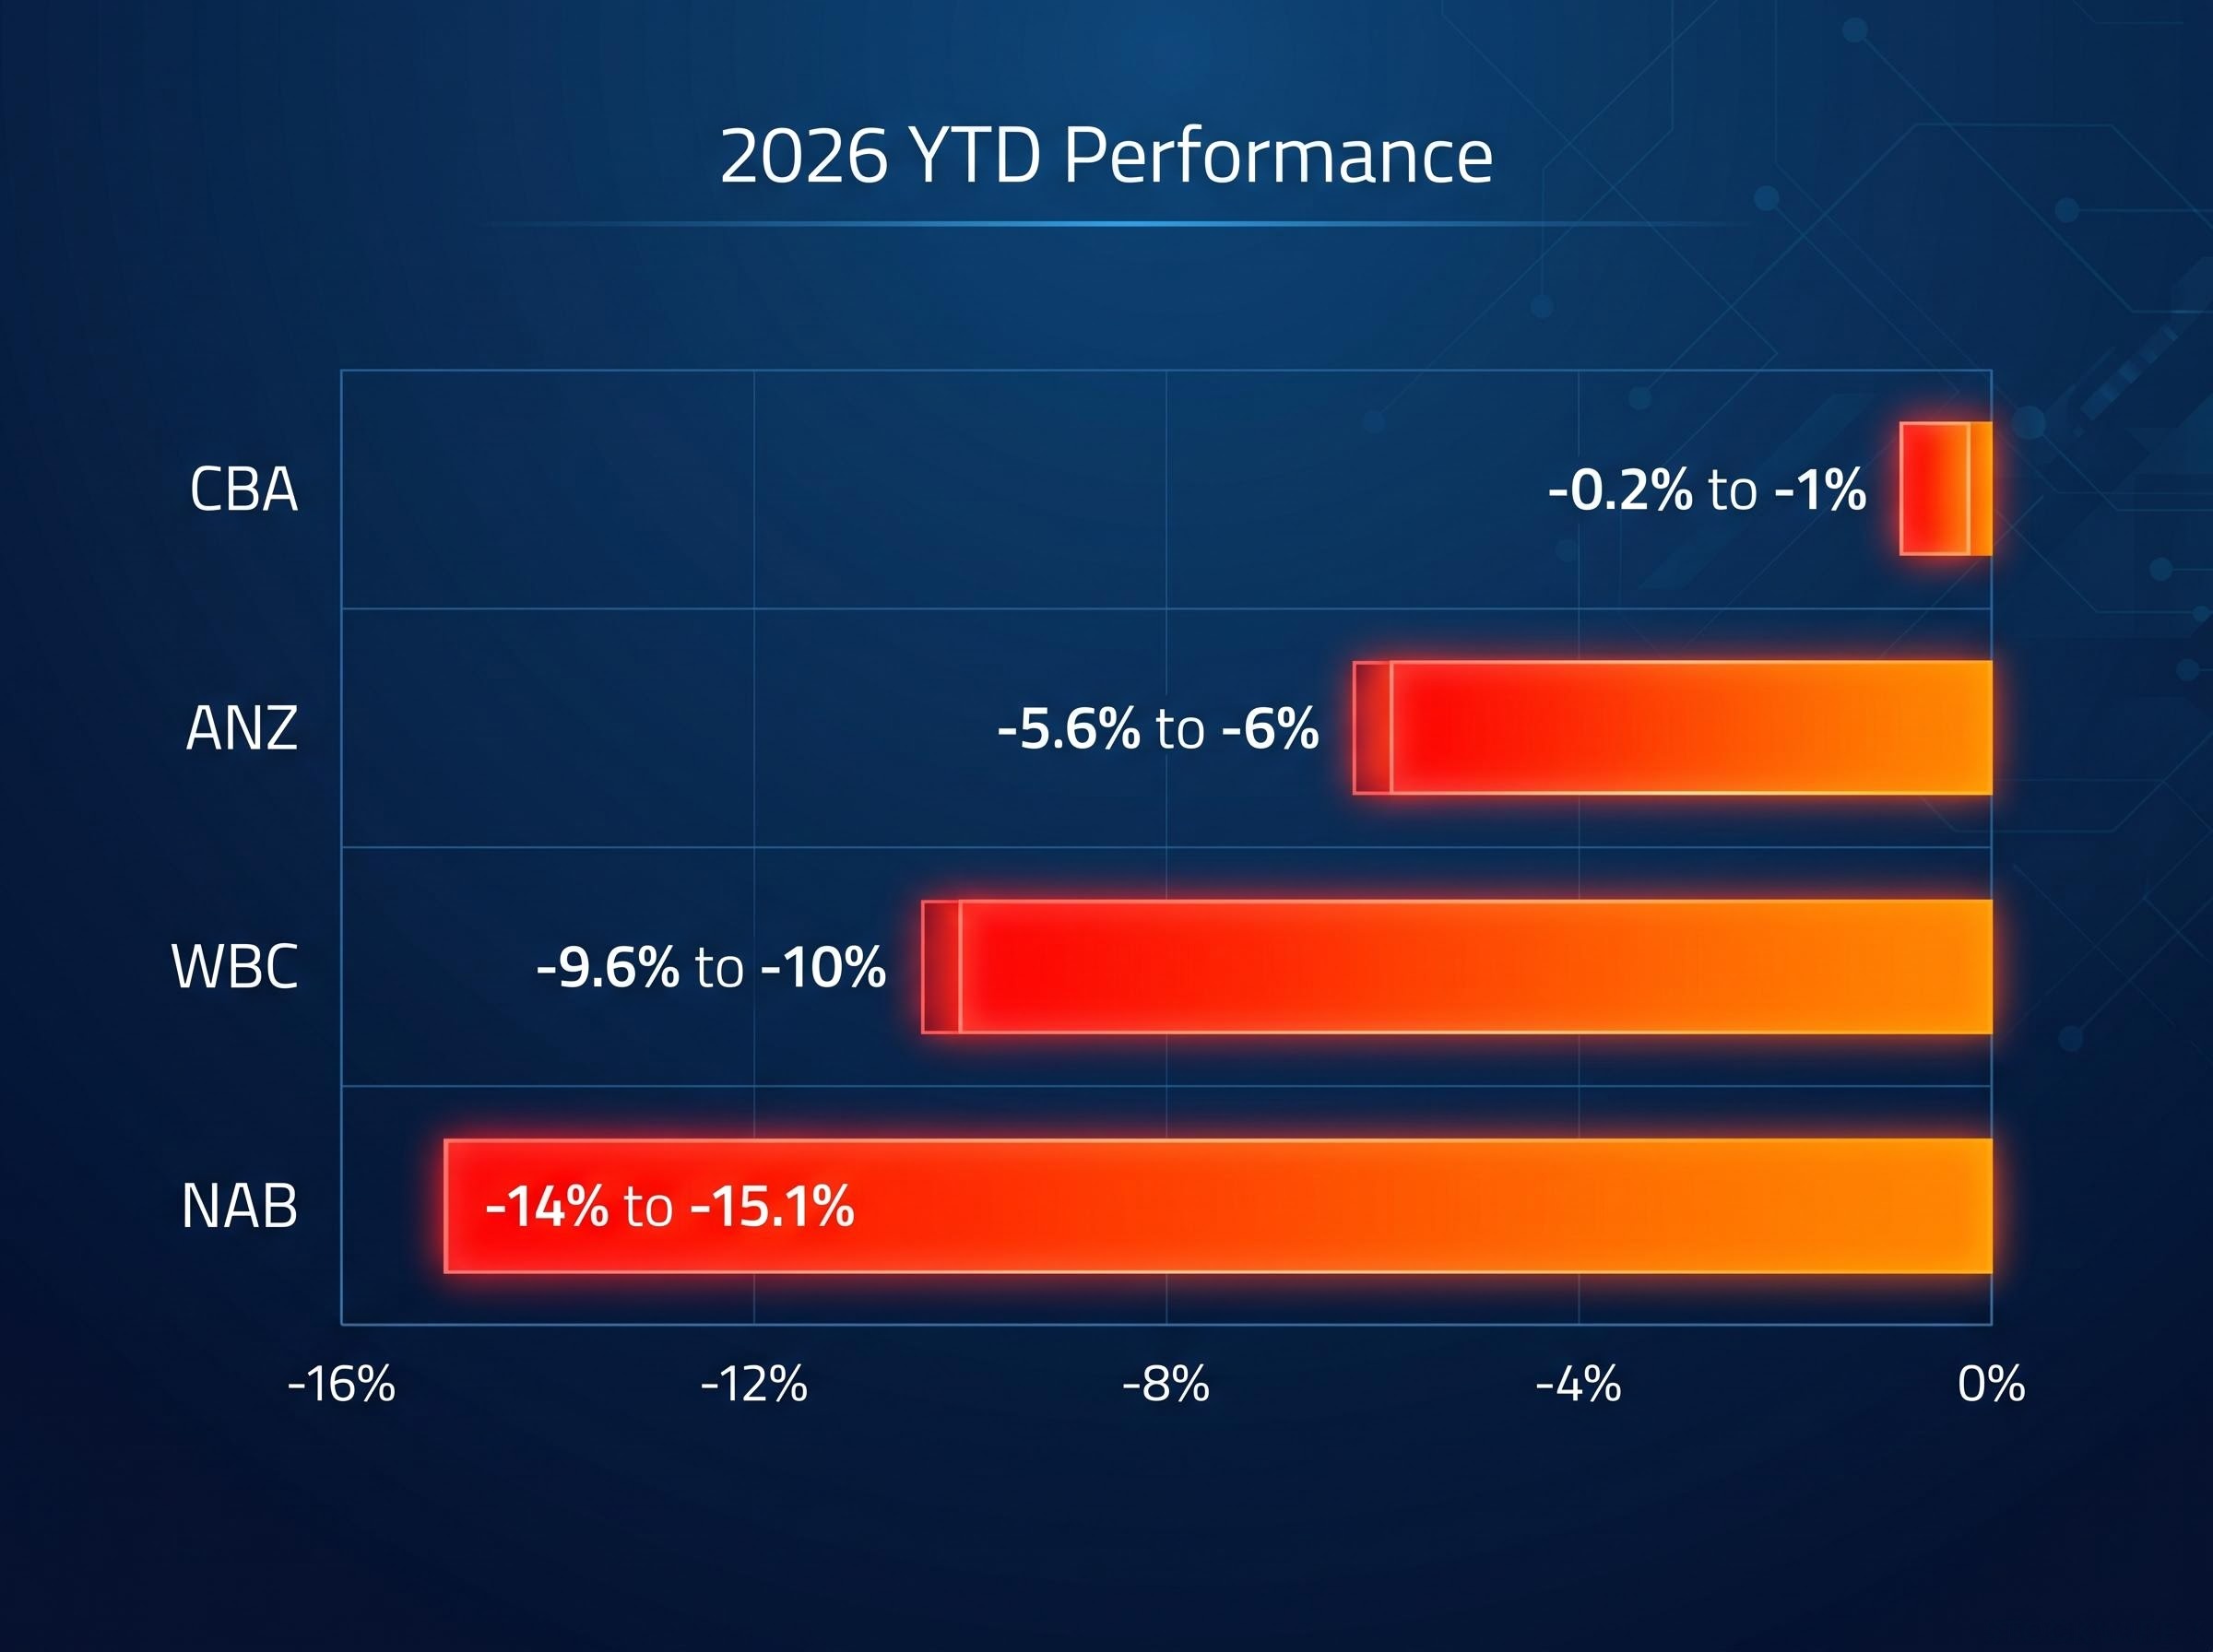
The correction has not hit the sector evenly. CBA has barely moved, while NAB has suffered losses more than ten times steeper. That divergence within the same macro headwind tells a story about how the market is repricing risk across four different business mixes.
| Bank | ASX Code | YTD Performance (approx.) | Valuation Note |
|---|---|---|---|
| Commonwealth Bank | CBA | -0.2% to -1% | Trailing P/E of approximately 25.6x-25.8x; still premium-priced |
| ANZ Group | ANZ | -5.6% to -6% | Moderate pullback from elevated 2025 highs |
| Westpac | WBC | -9.6% to -10% | Higher mortgage and business credit exposure weighing |
| National Australia Bank | NAB | -14% to -15.1% | SME book stress and elevated non-performing exposures |
Brokers characterised CBA entering 2026 as “priced for perfection,” with the broader sector leaving “little room for disappointment” after the 2025 rally.
The sector as a whole has underperformed the broader ASX 200 over this period. These are pullbacks from historically rich valuations, not distressed-level capitulation, but the gap between NAB’s losses and CBA’s comparative resilience raises a question worth answering: what is driving the weakness, and why is it hitting some names harder than others?
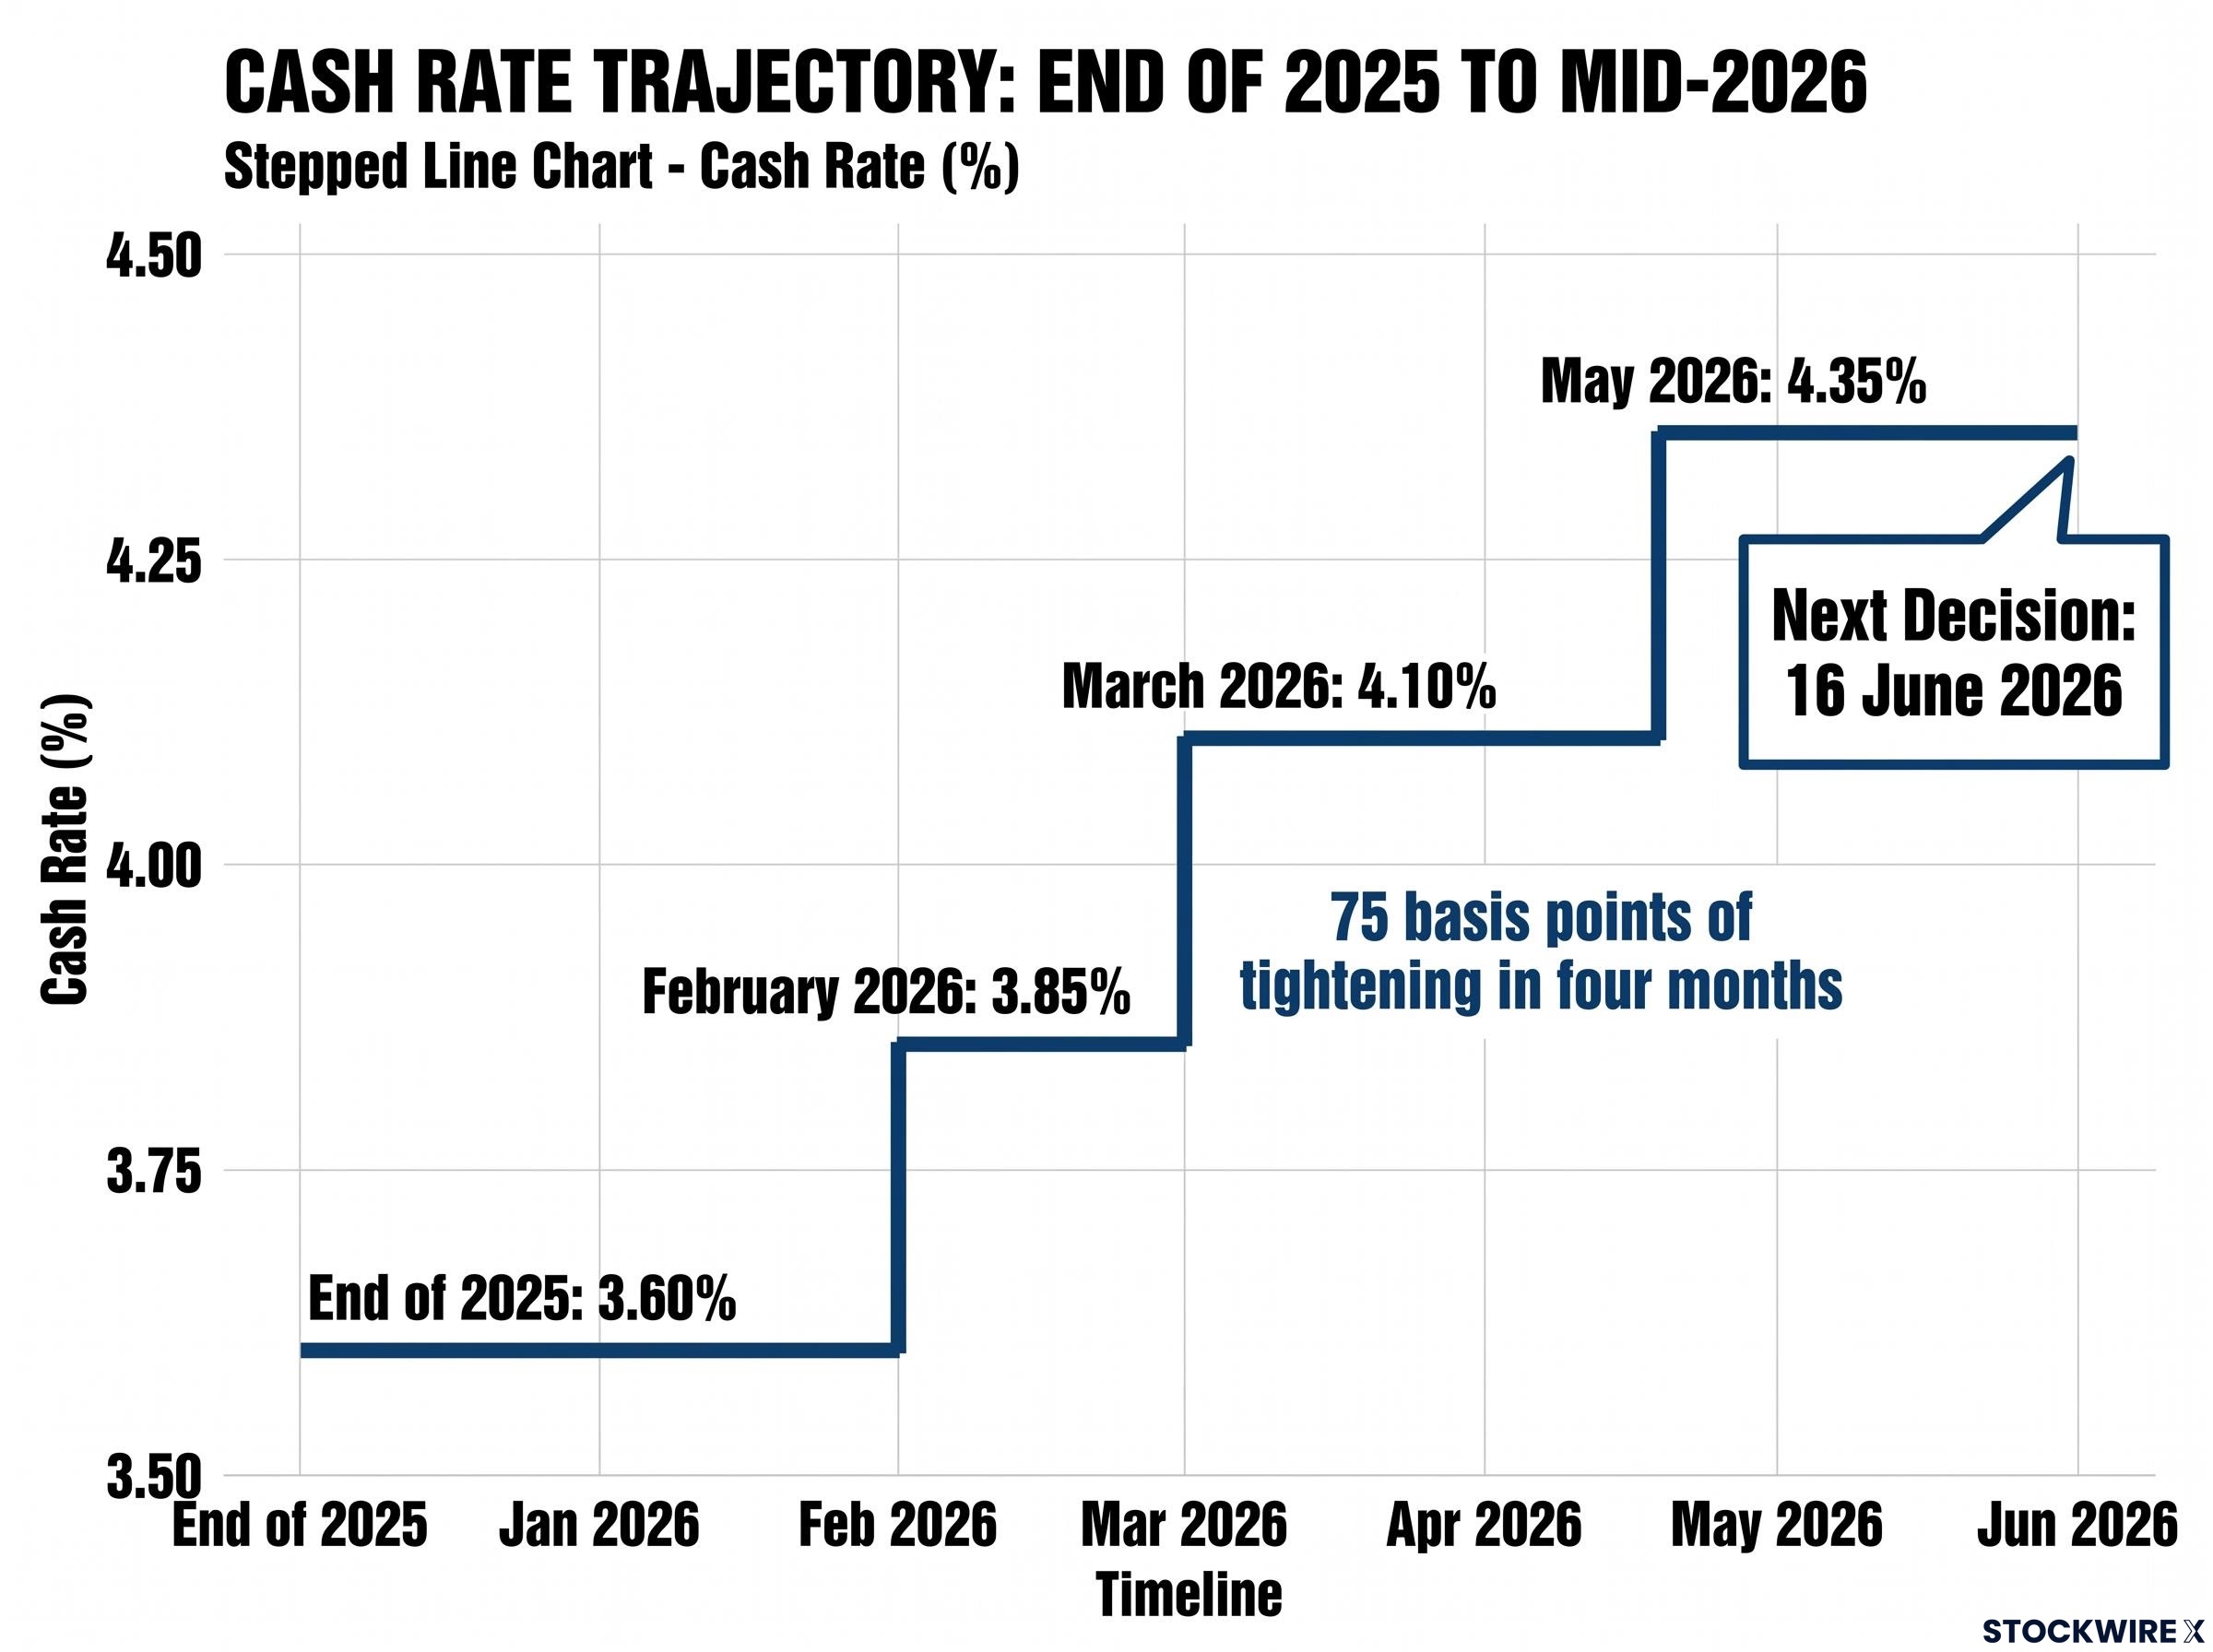
The RBA cut the cash rate three times during 2025, bringing it down to 3.60% by year’s end. That easing cycle encouraged investors to position for a sustained rate-reduction trajectory. Then inflation proved stickier than expected, and the central bank reversed course sharply.
The three 2026 hikes arrived in quick succession:
This is not three isolated decisions. It is a deliberate policy trajectory: 75 basis points of tightening in four months, sitting on top of a sector already priced for rate cuts. The whipsaw caught investors who had positioned for a sustained easing cycle, and it has forced a recalculation of how long restrictive policy will persist.
The RBA rate hike cycle that has driven the 2026 correction arrived against a backdrop of headline CPI at 4.6% and trimmed mean inflation at 3.3%, both above the 2-3% target band, with futures markets currently pricing one further 25 basis point move by December 2026 that would push the terminal rate to approximately 4.68%.
The RBA cash rate decisions published for each 2026 Board meeting confirm the sequential tightening path: February at 3.85%, March at 4.10%, and May at 4.35%, with accompanying statements framing each move as a response to inflation persistence rather than a reactive over-correction.
The RBA’s current stance is data-dependent with no pre-commitment to either further hikes or cuts. Policy is restrictive, not stimulatory, and the central bank has signalled it will remain so until inflation is clearly tracking back toward target.
The next RBA decision lands on 16 June 2026, and for bank investors the rate outcome is only half the story. The accompanying statement carries equal or greater weight. A single sentence shift in how the Board characterises inflation, from “persistent” to “broadly easing,” can move bank share prices as much as a formal rate change. Investors watching the decision should pay as much attention to the language as to the number.
The relationship between rates and bank stocks is not as straightforward as “rates up, banks down” or “rates down, banks up.” Bank share prices are outputs of three interacting variables, and these channels often pull in opposite directions under the same rate decision.
The RBA’s accompanying commentary on its rate decision is considered potentially more market-significant than the decision itself. A hawkish hold with no formal rate change can compress valuations more than a widely anticipated hike.
Understanding these three channels explains why a rate cut is not automatically positive for bank shares (NIMs may compress) and why a rate hold with hawkish language can be more damaging than a formal hike (credit quality fears and multiple compression intensify without offsetting NIM benefits). Investors who only track whether rates move up or down will misread RBA decisions repeatedly.
CBA’s NIM deterioration to 2.01% in Q3 FY26, missing analyst expectations and down 3 basis points from the prior half, coincided with a 22% quarterly surge in loan impairment expense to $316 million and mortgage arrears climbing to 1.12%, above the sector average, providing concrete evidence that the three transmission channels this article maps are now registering simultaneously in reported numbers.
With the 16 June decision days away, mapping each plausible outcome to the three transmission channels converts an uncertain event into a structured exercise. The table below presents each scenario not as a prediction, but as a conditional framework.
| RBA Scenario | NIM Impact | Credit Quality Impact | Likely Share Price Direction |
|---|---|---|---|
| Dovish hold | Broadly stable; no fresh pressure | Reduced perceived arrears risk | Supportive; sector relief rally possible |
| Hawkish hold | Stable but under scrutiny | Mortgage and SME stress worries persist | Mild downward pressure; valuations compress |
| Further hike | Short-term widening offset by rising funding costs | Arrears risk rises meaningfully | Sector underperformance extends |
A dovish hold, where inflation is described as broadly easing and the Board acknowledges downside risks to growth, is more likely to provide sector support than a hawkish hold is to inflict damage, given where sentiment currently sits. The asymmetry, however, favours caution overall. A hawkish hold that keeps further tightening “on the table” reinforces the higher-for-longer narrative and encourages investors to demand lower multiples from rate-sensitive sectors.
At 4.35%, the cash rate is already restrictive. Another hike would amplify stress on borrowers who are already stretched, raising the probability of arrears and defaults across mortgages and small-business lending.
Both NAB and Westpac, the weakest performers year-to-date, carry more exposure to business credit and mortgage stress than CBA. This makes them more vulnerable to further tightening. Unless a hike were accompanied by very reassuring growth and employment data, further tightening would likely extend or deepen the sector’s underperformance.
The 2026 correction has taken some excess out of valuations. It has not made the sector unambiguously cheap.
CBA still trades on a trailing P/E of approximately 25.6x-25.8x as of mid-June 2026, a multiple that several large brokers continue to describe as elevated. Across the sector, the stance is generally cautious, with multiple firms carrying underweight or sell ratings on various names.
Record short positions against the big four, totalling approximately $10.9 billion as of mid-June 2026, represent the largest dollar-value short exposure ever recorded against the sector since ASIC’s disclosure regime began in 2010, with CBA alone carrying more than half the total at around $5.66 billion given its premium valuation.
Reasons for continued caution:
Conditions under which opportunity could emerge:
The risk-reward currently leans toward caution unless there is strong conviction that the next significant RBA move is down, not up.
Historically, buying quality banks into cyclical weakness has often rewarded patient income investors, provided balance sheets remain sound and capital levels stay strong. Fully franked dividends remain a meaningful attraction for income-oriented holders even while capital gains look constrained. The question is whether the cycle has turned enough to warrant adding, and right now the macro signal does not provide a clear answer.
Investors wanting to extend the credit quality analysis into the property cycle will find our deep-dive into Australian housing risk for ASX banks, which examines Morgan Stanley’s projection of up to 10% residential price falls by end-2027, the earnings downgrade mechanics that follow, and why ANZ ranks above CBA in the broker’s post-downgrade preference order given differential mortgage market share.
This article is for informational purposes only and should not be considered financial advice. Investors should conduct their own research and consult with financial professionals before making investment decisions.
The 16 June decision is the immediate focus, but the framework below applies to every subsequent RBA meeting and bank reporting season through the remainder of 2026.
| Factor | Bearish Signal | Bullish Signal |
|---|---|---|
| RBA language | Hawkish hold; further hike flagged | Dovish hold; cuts flagged |
| Inflation data | Persistent; services and wages rising | Broadly easing; tracking toward target |
| Arrears and bad debts | Rising; SME stress spreading | Stable or declining |
| Net interest margins | Compressing under deposit competition | Stabilising or expanding |
| Labour market | Rising unemployment; household stress | Resilient employment; spending stable |
Bank-specific disclosures matter as much as the macro signal. NIM trends, arrears movements in mortgage and SME books, and management commentary on competitive deposit pressure are all direct inputs into how each RBA decision translates to earnings. Investors who frame every release through the lens of NIMs, credit quality, and required valuation multiples will be better placed to interpret what each decision really means for their holdings.
ASX bank shares remain meaningful income holdings through their fully franked dividends, an attraction that does not disappear in a restrictive rate environment. The path to capital appreciation, however, is blocked while policy stays tight and valuations remain above long-term averages.
The remainder of 2026 is defined by three variables: the RBA’s rate trajectory, bank earnings results, and credit quality data. Investors who have internalised the NIM, credit quality, and valuation multiple framework outlined above will be better placed to react to each RBA decision without overtrading. The sector will turn again; monitoring these signals through each cycle is how investors position themselves ahead of that turn rather than chasing it after the fact.
Past performance does not guarantee future results. Financial projections are subject to market conditions and various risk factors.
ASX bank shares have declined in 2026 because three consecutive RBA rate hikes between February and May lifted the cash rate to 4.35%, forcing investors to reassess whether bank earnings can support historically elevated valuations in a restrictive rate environment.
RBA rate hikes affect bank shares through three channels: net interest margins, which can widen initially but face erosion from deposit competition; credit quality, where higher repayments increase arrears risk in mortgage and SME books; and valuation multiples, where a higher risk-free rate compresses price-to-earnings ratios.
National Australia Bank (NAB) has been the worst performer among the big four, falling approximately 14-15% year-to-date as of mid-June 2026, driven by stress in its SME lending book and elevated non-performing exposures.
The 16 June RBA decision could either support a sector relief rally if the Board signals a dovish hold, or extend the sector's underperformance if it delivers a further hike or maintains hawkish language keeping additional tightening on the table.
The 2026 correction has reduced some excess from valuations, but the sector is not unambiguously cheap; CBA still trades on a trailing price-to-earnings ratio of approximately 25.6x-25.8x, and record short positions totalling around $10.9 billion signal continued institutional caution.