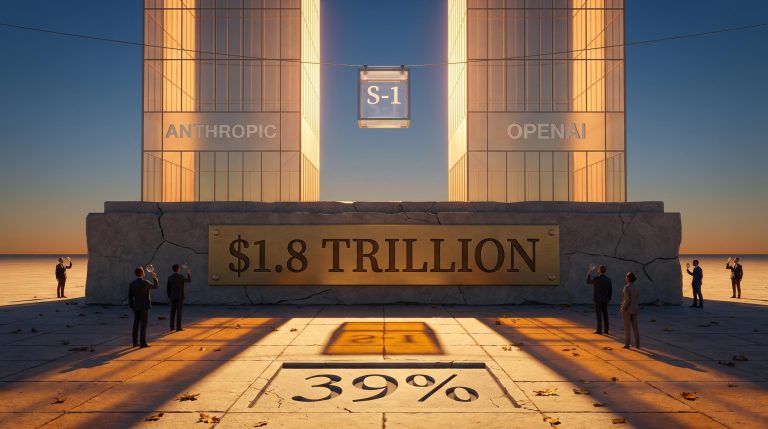
SpaceX’s $2.1T IPO Exposes a Structural AI Valuation Problem
1 hr ago

Starlink generated approximately $11.4 billion in revenue in 2025 at margins that most software companies would envy, yet the investment world remains fixated on rockets. With SpaceX’s S-1 filed on 20 May 2026, investors can now examine the company’s segment economics directly rather than through leaked estimates and secondhand figures. Starlink is the operating segment that funds everything else, and it is running two structurally different businesses off a single constellation: a rural broadband subscription franchise and a wholesale direct-to-cell infrastructure play distributed through mobile carriers. This analysis unpacks how each franchise works, what the financial profile looks like under disclosed and estimated figures, where the growth ceiling sits, and what risks sophisticated investors should pressure-test before anchoring a SpaceX valuation to Starlink’s trajectory.
The rocket narrative is compelling. The cash, however, is coming from a broadband subscription business with the margin profile of a platform company.
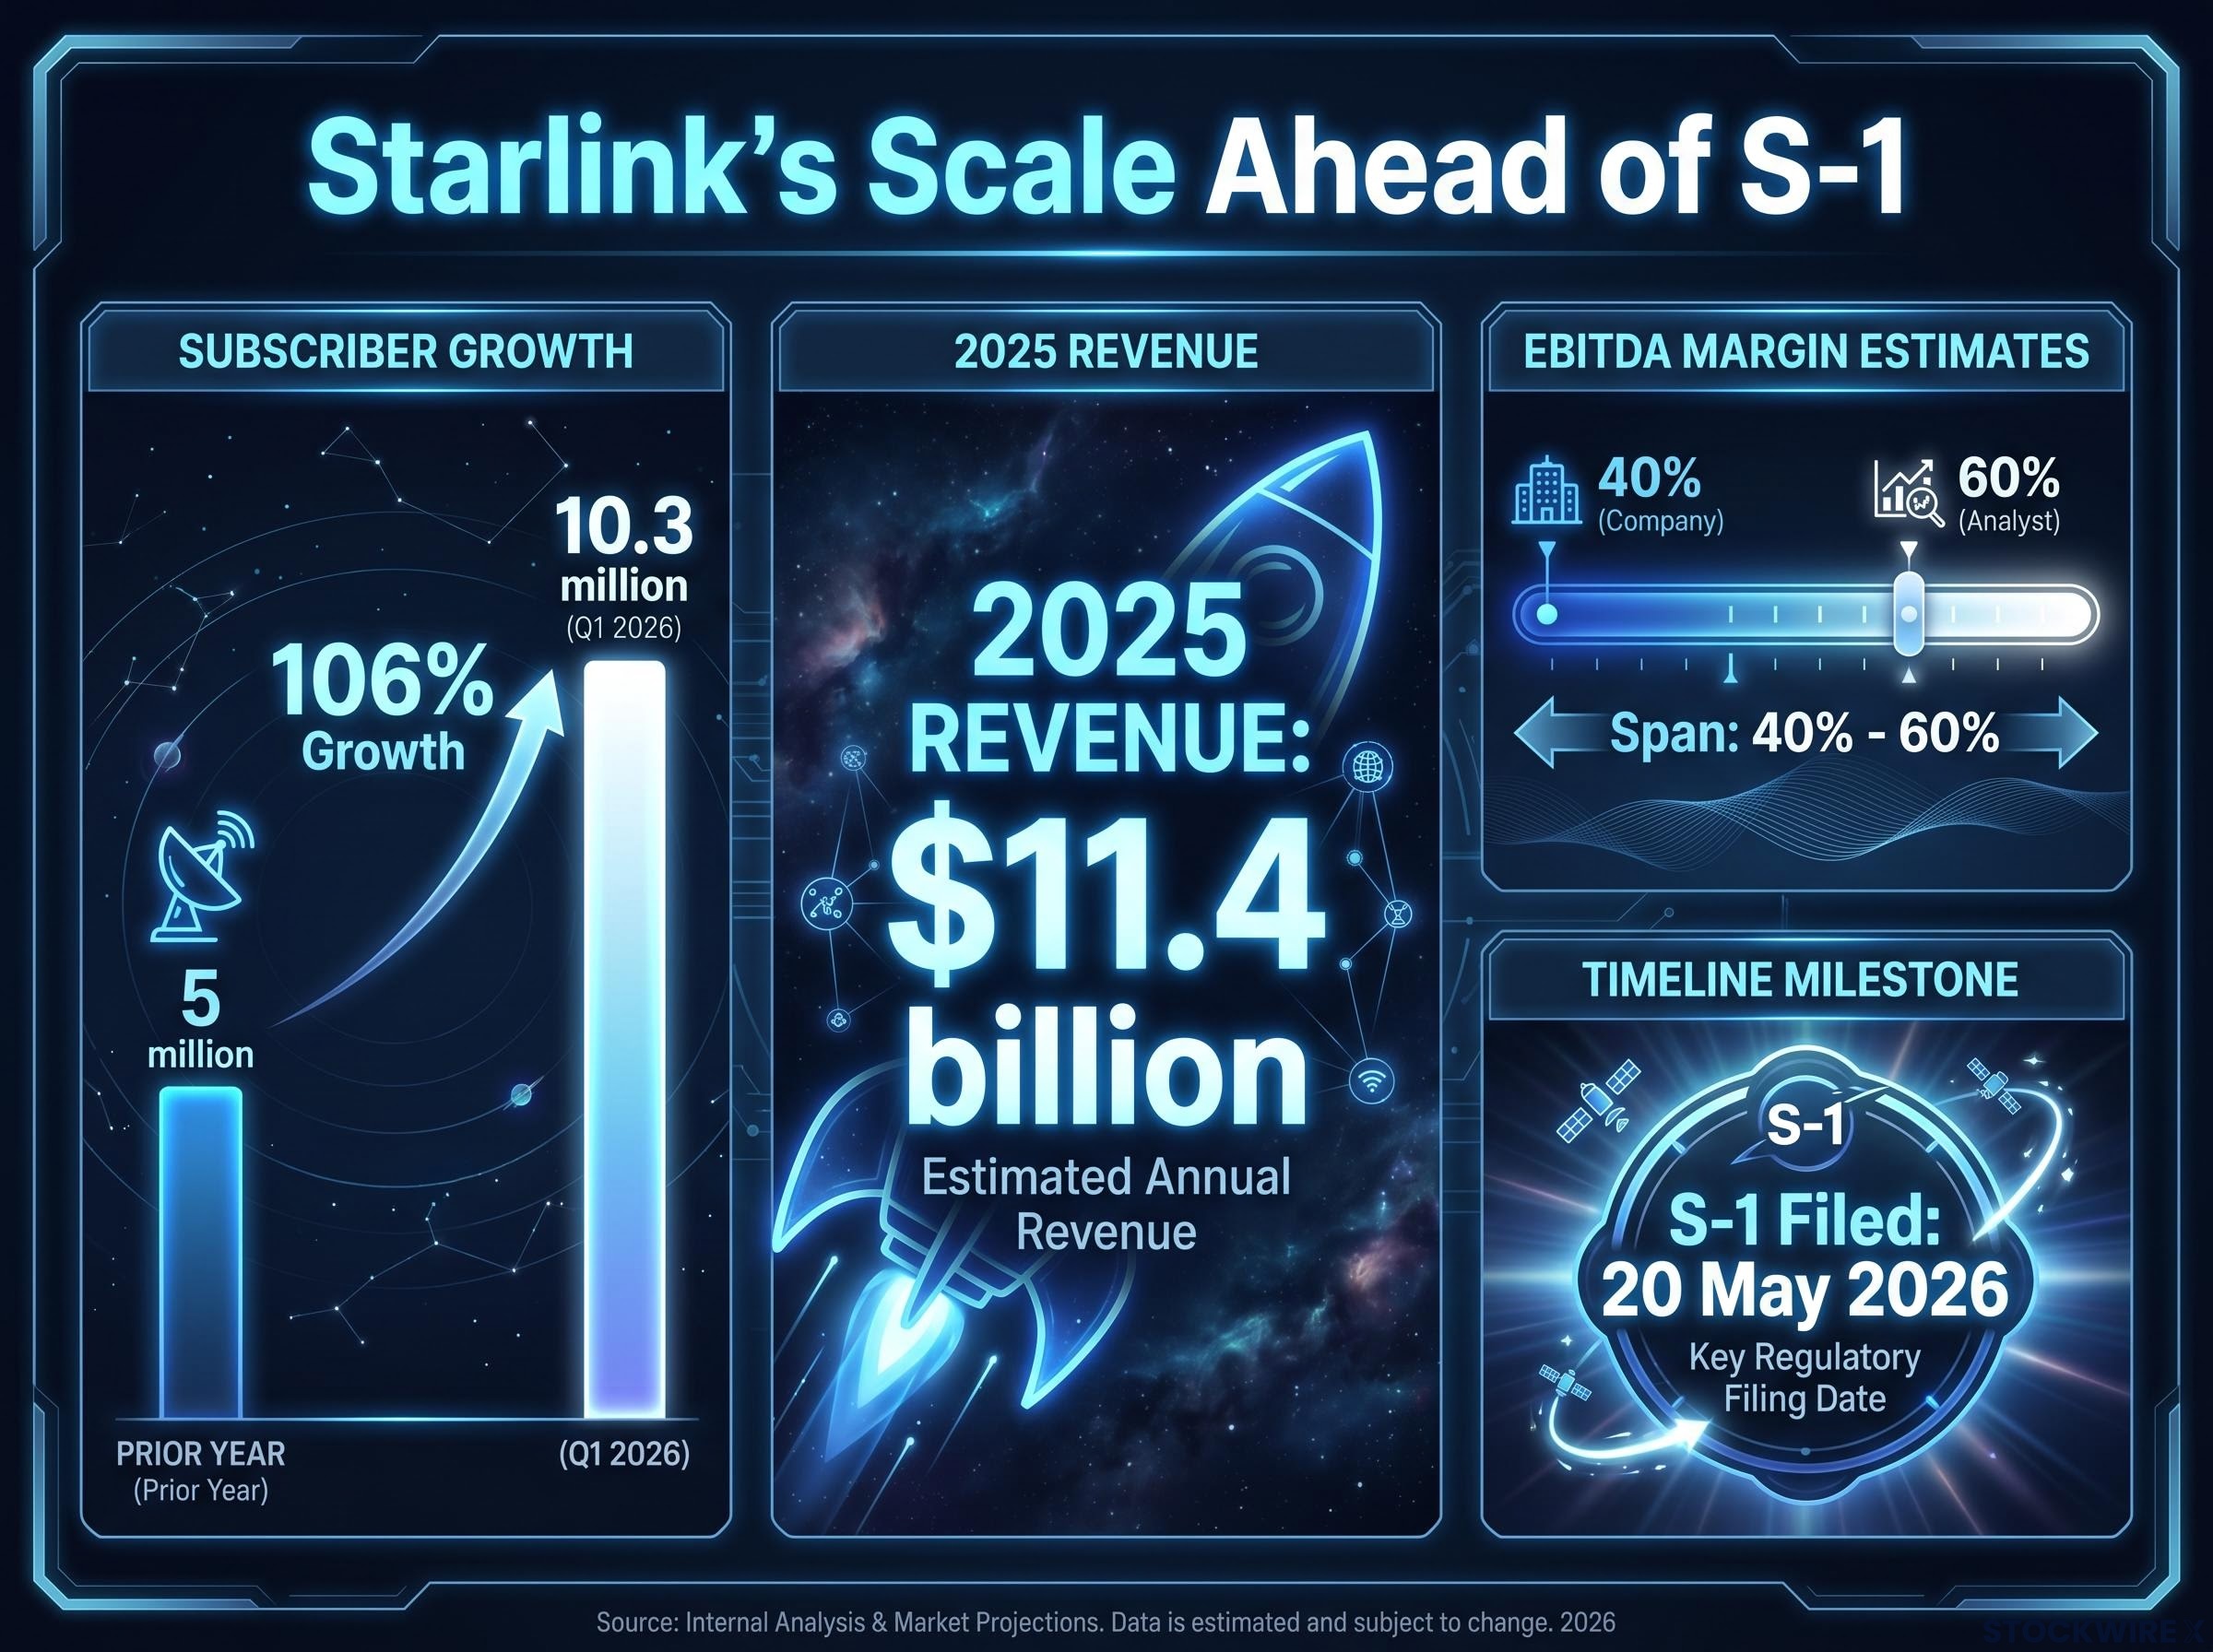
Starlink by the numbers: Approximately $11.4 billion in 2025 revenue. Approximately 10.3 million paying subscribers as of Q1 2026, up from roughly 5 million the prior year. S-1 filed 20 May 2026, giving investors their first formal public window into segment economics.
Where launch services generate revenue project by project, Starlink collects recurring monthly subscriptions from millions of users. That structural difference matters for valuation: recurring revenue at scale, with high retention and limited direct competition in its core rural segment, produces a cash flow profile closer to a platform business than a launch provider. According to SEC filings, company progress reports, and analyst estimates as of mid-2026, Starlink is the primary near-term cash-generating segment of SpaceX.
SpaceX remains a private company, and the S-1 represents the first formal public disclosure of segment financials. Prior to the filing, margin figures circulated as analyst estimates and company statements rather than audited results.
Earlier S-1 attributions placed adjusted EBITDA margins at approximately 40%. Analyst estimates as of 2025 range higher, into the 60% range, reflecting assumptions about scale efficiencies and subscriber growth. Neither figure should be treated as settled. The correct frame is a disclosed range with sourcing attached: the lower bound comes from earlier company-attributed figures, while the higher estimate reflects analyst models that have not been independently audited. Investors building valuation models should flag which figure they are anchoring to and why.
Fiber is expensive to deploy. The economics of running a cable to a single farmhouse 40 kilometres from the nearest exchange are structurally different from wiring an apartment building in a capital city. Below certain population density thresholds, the per-location cost of terrestrial infrastructure, whether fiber, cable, or tower buildout, becomes uneconomic under any reasonable subscriber-revenue assumption.
This is the gap Starlink was built to fill. A low-Earth orbit (LEO) constellation, meaning a network of satellites orbiting at relatively low altitude compared to traditional communications satellites, changes the marginal cost equation. Once thousands of satellites are in orbit, the incremental cost of serving one additional rural subscriber is comparatively modest. The constellation is the fixed cost; subscriber additions are the variable upside.
Starlink’s vertical integration sharpens this advantage further. Owning the launch stack (Falcon 9 and, increasingly, Starship) lowers per-satellite deployment cost compared to competitors who must purchase launch services on the open market. That cost differential compounds across a constellation that requires regular replenishment.
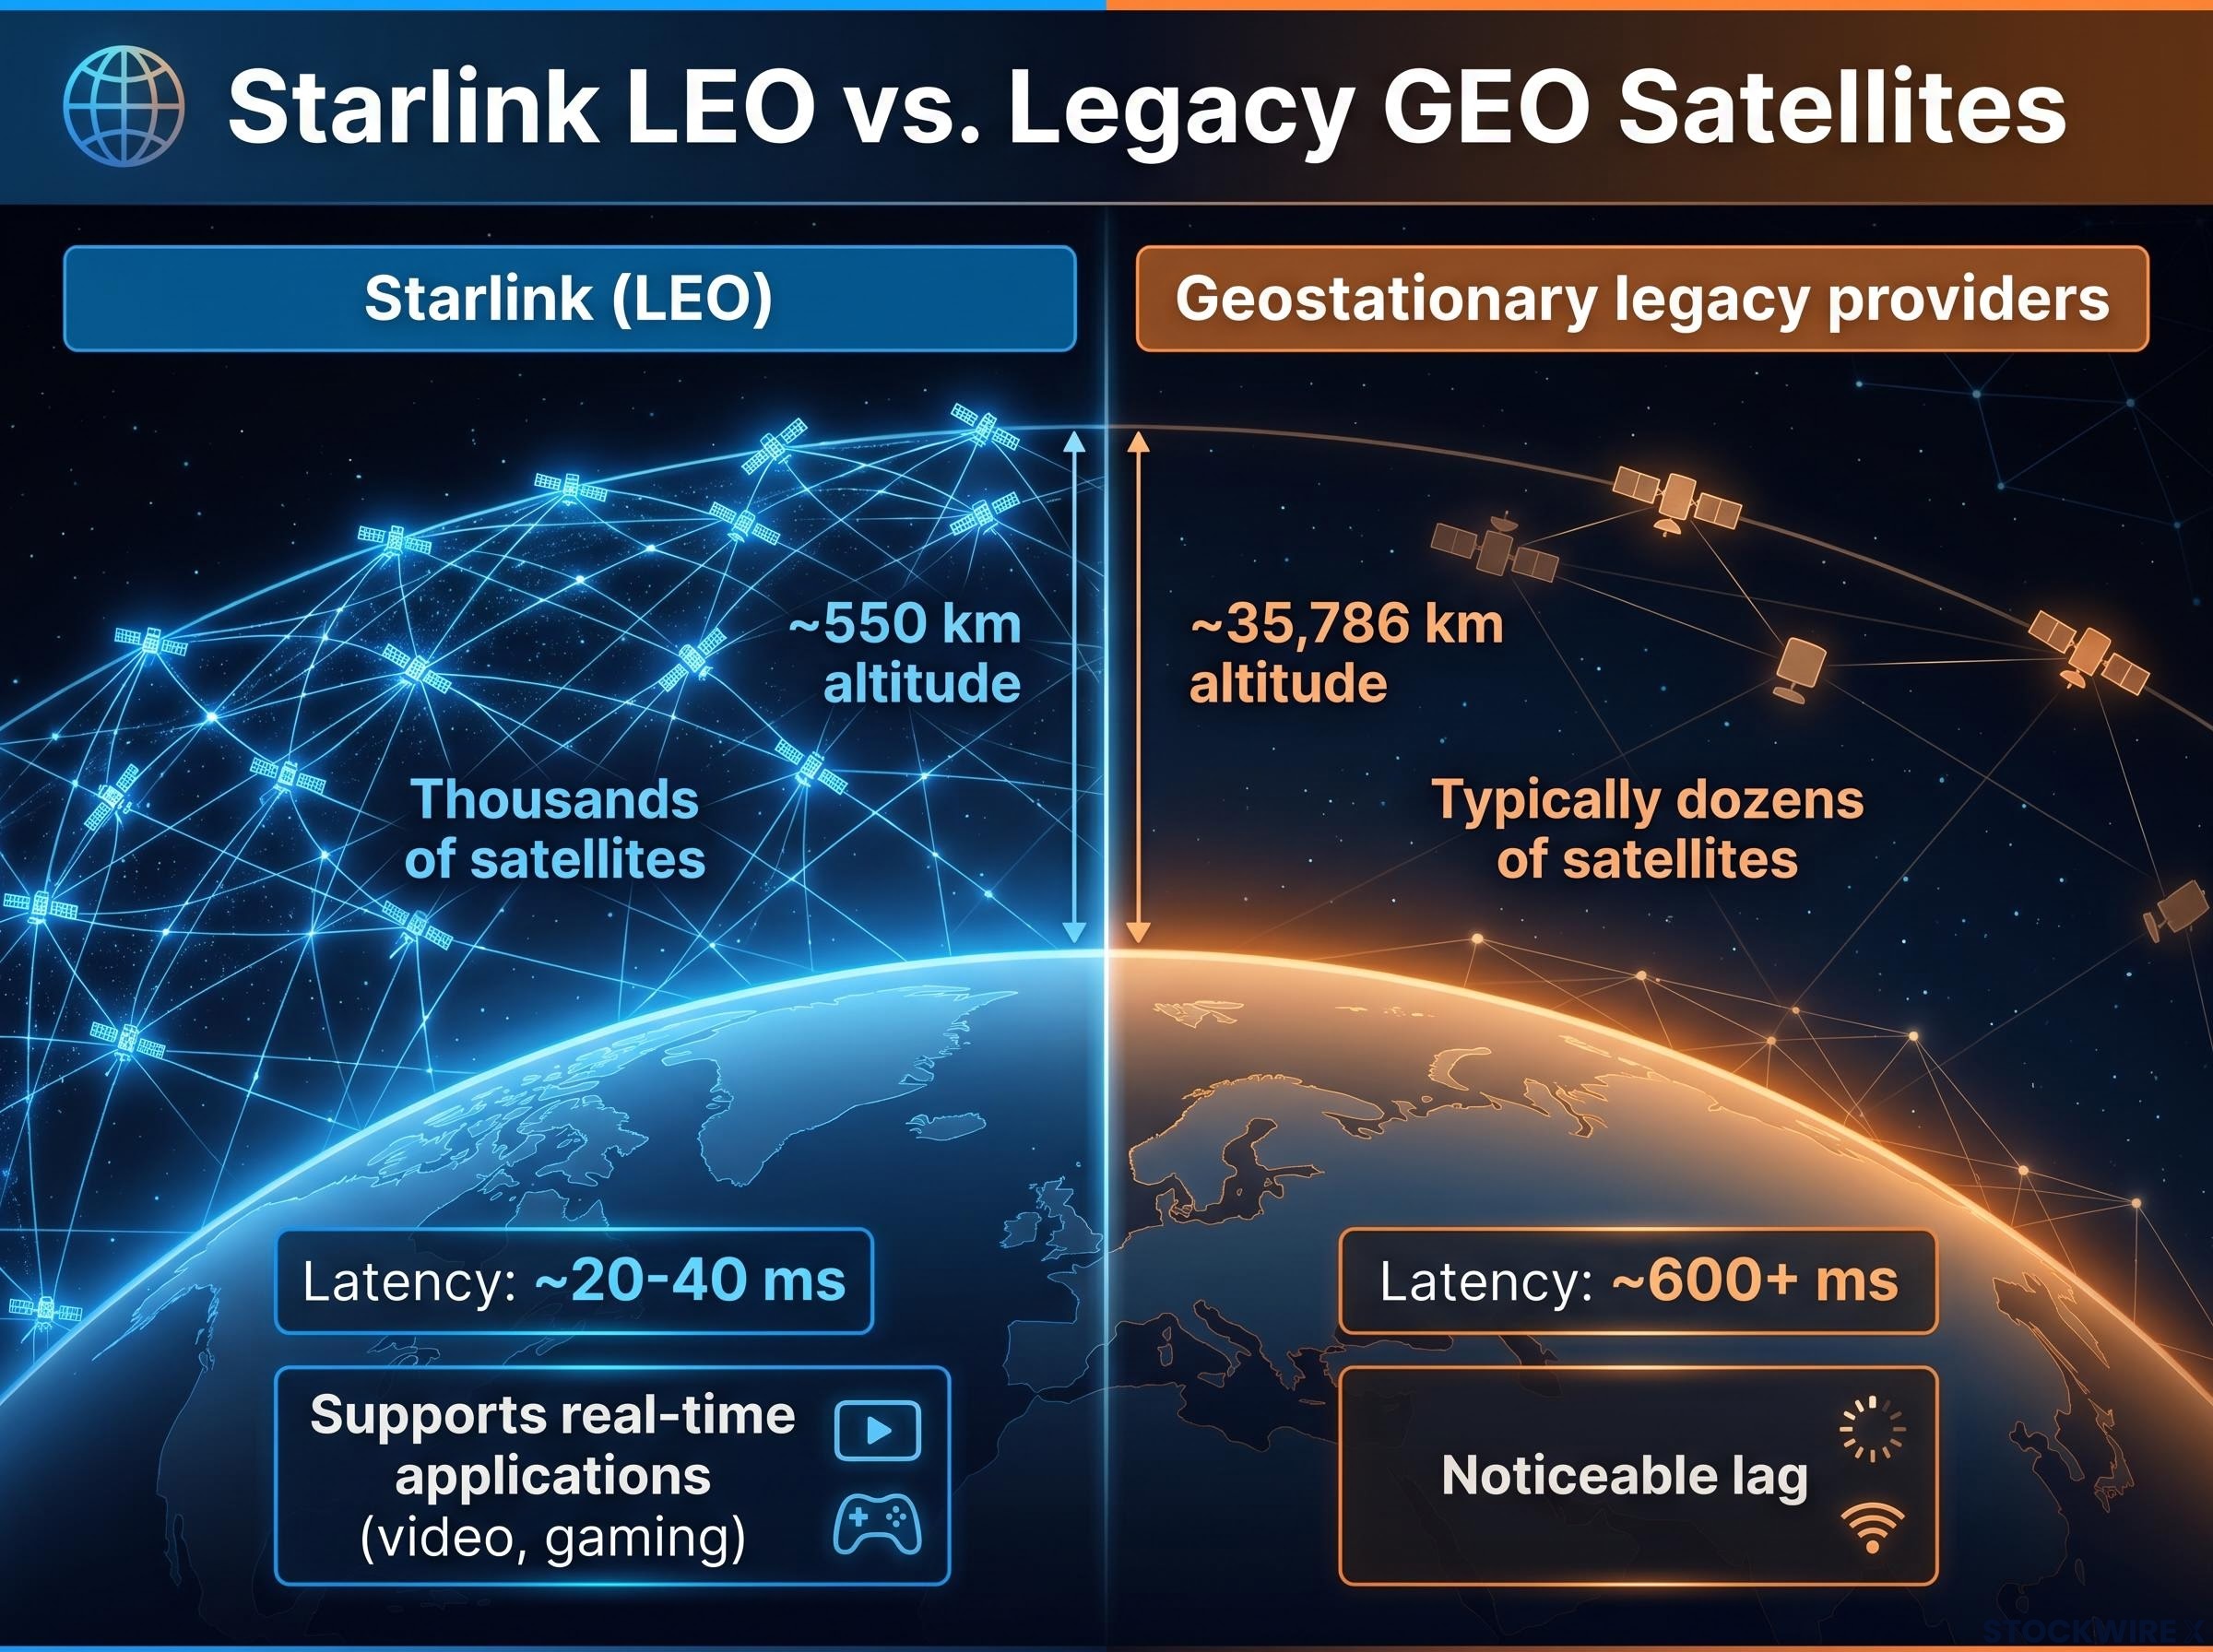
| Attribute | Starlink (LEO) | Geostationary legacy providers |
|---|---|---|
| Orbit type | Low-Earth orbit (~550 km altitude) | Geostationary orbit (~35,786 km altitude) |
| Constellation size | Thousands of satellites | Typically dozens of satellites |
| Typical latency | ~20-40 ms | ~600+ ms |
| Service quality implication | Supports real-time applications (video, gaming) | Noticeable lag; limited real-time capability |
The applicable market extends beyond rural residential broadband. Remote enterprise and government connectivity, maritime, aviation, and disaster recovery scenarios all sit within the addressable segment.
The Broadband Equity, Access, and Deployment (BEAD) programme targets the same rural connectivity gaps Starlink is structurally suited to serve. Federal funding is directed toward closing broadband access disparities in underserved and unserved areas, which overlap directly with Starlink’s core customer base.
Implementation guidelines, however, carry fibre-first priorities. Satellite’s funded role concentrates in the hardest-to-reach, lowest-density locations where fibre buildout economics are clearly unviable. Starlink is structurally suited to participate in last-resort allocations rather than receiving blanket subsidy access. For investors, this means BEAD expands the addressable market at the margins rather than across the board.
Direct-to-cell is not a mobile version of the broadband product. It is a wholesale infrastructure play distributed through carriers, and the distinction changes how investors should model its revenue trajectory.
The product connects standard smartphones to Starlink satellites without any additional hardware. No dish, no specialised handset. When a consumer’s terrestrial signal drops, the phone connects automatically to a Starlink satellite overhead. The carrier bills it as a plan add-on. Here is how a consumer experiences the service in practice:
SpaceX does not own the customer relationship. T-Mobile serves as the primary named distribution partner, handling billing, marketing, and bundling. SpaceX provides the connectivity layer in areas where the carrier’s own towers do not reach. This positions direct-to-cell as a B2B revenue stream; the growth variable is carrier adoption and contract scale, not individual subscriber acquisition.
Illustrative pricing: Approximately $3 to $10 per month as a carrier add-on, based on S-1 references and public statements. These figures reflect publicly discussed economics rather than locked commercial terms.
The value proposition is guaranteed universal coverage, something no terrestrial carrier can replicate through tower infrastructure alone. That differentiation is what makes the wholesale model viable: carriers gain a coverage guarantee they cannot build themselves, and SpaceX gains distribution at a scale no direct-to-consumer marketing campaign could match.
Each risk facing Starlink operates through a specific mechanism rather than as a generic threat category. Understanding which risks are existential and which are manageable requires tracing how each one impairs a particular part of the model.
Amazon’s Project Kuiper is reaching operational scale and represents the most concrete competitive threat to Starlink’s constellation advantages. Starlink’s lead is measured in years and thousands of satellites, but the gap narrows as competitors secure launch capacity and deploy their own constellations.
Internal cost allocation adds a further complication. With shared infrastructure serving two franchises, segment disclosure under public company reporting requirements may create reporting complexity as SpaceX transitions from private to public.
The same constellation serves both businesses. That single fact is the structural argument for why the two franchises together could be worth more than their separate sum.
Fixed broadband subscribers connect through ground-based dishes. Direct-to-cell users connect through standard handsets. Both rely on the same orbital infrastructure. Once the constellation is funded and deployed for the broadband franchise, the incremental capital expenditure required to enable direct-to-cell is limited. Additional revenue does not require proportional additional constellation investment.
| Attribute | Franchise 1: Rural broadband | Franchise 2: Direct-to-cell |
|---|---|---|
| Target customer | Rural, remote, maritime, aviation end users | Mobile carriers (wholesale) |
| Revenue model | Direct consumer/enterprise subscriptions | Carrier capacity and wholesale fees |
| Hardware required | Ground-based dish terminal | None (standard smartphone) |
| Growth driver | Rural market penetration, new geographies | Carrier partner adoption, contract scale |
| Primary risk | Growth moderation as rural markets saturate | Carrier execution and pricing decisions |
Analyst subscriber projections in some models reach 16 to 18 million for 2026, reflecting continued growth from the 10.3 million Q1 2026 base. The two-franchise structure means that growth can come from two distinct channels simultaneously: new broadband subscribers and new carrier partnerships layering direct-to-cell revenue on top. The churn and revenue stability characteristics differ between the two, which also provides a degree of diversification within a single infrastructure investment.
Starlink is not a standalone broadband company. It is the cash engine that makes the longer-horizon bets on reusable rockets, space infrastructure, and interplanetary ambitions financially viable. Recurring, high-margin subscription cash flows from rural broadband, combined with a scalable wholesale infrastructure franchise in direct-to-cell, provide the financial base that funds programmes operating on far longer payback timelines.
With the S-1 filed on 20 May 2026, the conversation has shifted. Analyst estimates are now subject to audit-quality scrutiny for the first time, and investors must distinguish between three categories of figures: data from the S-1 filing itself, analyst estimates built on that data, and modelled scenarios using adoption rate illustrations and pricing assumptions. Each carries a different level of reliability.
Data sourcing distinction: S-1 filing figures, analyst estimates, and modelled scenarios are not interchangeable. Institutional investors should label which category underpins each input in their valuation models.
The question this analysis has been building toward is whether the two-franchise structure can sustain high margins as rural markets mature and direct-to-cell adoption depends on carrier execution. At approximately $11.4 billion in revenue and over 10 million subscribers, the scale is real. Whether the trajectory holds depends on which risks prove manageable and which prove structural.
This article is for informational purposes only and should not be considered financial advice. Investors should conduct their own research and consult with financial professionals before making investment decisions. Financial figures referenced in this analysis are drawn from SEC filings, company progress reports, and analyst estimates; they have not been independently audited. Past performance does not guarantee future results.
Starlink operates two distinct revenue streams off a single satellite constellation: a direct subscription rural broadband service charging consumers monthly fees for internet access, and a wholesale direct-to-cell infrastructure play where mobile carriers like T-Mobile pay SpaceX to provide satellite coverage in areas beyond their tower reach.
Starlink reached approximately 10.3 million paying subscribers as of Q1 2026, roughly doubling from approximately 5 million the prior year, with some analyst models projecting 16 to 18 million subscribers by end of 2026.
Direct-to-cell connects standard smartphones to Starlink satellites without any additional hardware or dish, activating automatically when a user's terrestrial signal drops; unlike the consumer broadband product, it is sold wholesale to carriers who bundle it as a plan add-on rather than sold directly to end users.
The S-1 filed on 20 May 2026 provides investors their first formal public window into Starlink's segment economics; prior figures circulated as analyst estimates, with adjusted EBITDA margin estimates ranging from approximately 40% in earlier company-attributed figures to as high as 60% in analyst models based on scale assumptions.
The four primary risks are: structural deceleration in rural broadband as accessible unserved markets saturate, competitive pressure from Amazon's Project Kuiper approaching operational scale, carrier execution risk in the direct-to-cell franchise where SpaceX does not control pricing or bundling decisions, and regulatory complexity around spectrum coordination and orbital policy for LEO constellation expansion.