A single additional decline of roughly 3% in the S&P 500 could trigger approximately $100 billion of programmatic equity selling globally, according to Bank of America analysts. None of it would be driven by earnings views, macroeconomic judgment, or Federal Reserve commentary. BofA published its CTA trigger map on 14 June 2026, the same day markets are digesting recent equity weakness and positioning ahead of a potential Fed decision. Commodity Trading Advisors (CTAs), the rules-based trend-following funds that scale positions on price signals alone, have already begun reducing long equity exposure. BofA’s model shows the next threshold is uncomfortably close, and when it breaks, the selling becomes mechanical, synchronised, and self-reinforcing across multiple asset classes.
What follows is a breakdown of where BofA’s trigger levels sit, how the cascade mechanism works in practice, which assets beyond U.S. equities face systematic selling risk, and what a stabilisation scenario would require.
Why a 3% S&P 500 drop could detonate $100 billion in systematic selling
BofA’s warning is conditional, not a crash prediction. The bank’s CTA model identifies a specific threshold: if the S&P 500 falls approximately 3% from current spot, trend-following funds flip from residual long-holders to large net sellers. The output of that shift, per BofA’s modelling, is approximately $100 billion of global equity selling driven by CTAs alone.
Goldman’s CTA selling estimate, published in early June 2026, identified $93 billion in net long global equity exposure held by trend-following funds, with $34 billion concentrated specifically in S&P 500 futures, producing a downside-to-upside asymmetry of approximately 2.7 to 1 compared with the maximum projected buying under a rising market scenario.
$100 billion of estimated global equity CTA selling if the S&P 500 breaches the 3% threshold, according to Bank of America’s systematic flow model.
The starting position matters. CTAs have already begun reducing risk, meaning a portion of their long exposure has been unwound. What remains is the live risk: the long positions still held by medium- and low-sensitivity models, which would be forced to liquidate if the threshold breaks.
BofA’s rough geographic breakdown of estimated CTA selling flows:
- Approximately $50 billion from U.S. equities
- Approximately $35 billion from European equities
- Approximately $15 billion from Asian equities
When equities recovered on Thursday, the SG CTA Index posted positive performance, confirming that CTAs still hold net long exposure to major benchmarks. That long exposure is what converts into selling pressure if prices fall further.
When big ASX news breaks, our subscribers know first
What CTAs are and how trend-following models turn a dip into a cascade
CTAs are rules-based, trend-following managers who scale positions based on price signals rather than fundamentals. They do not evaluate earnings reports, central bank guidance, or geopolitical developments. Their models watch price momentum, and when a trend weakens past a defined threshold, they sell. When a trend strengthens, they buy. The process is automated, price-insensitive, and operates without discretionary override.
The NFA registration requirements for CTAs establish that these funds operate under CFTC oversight as registered commodity pool operators, a regulatory framework that mandates specific conduct standards but imposes no constraint on the automated, price-signal-driven execution that makes their selling mechanical and synchronised.
The problem arises because many CTAs use similar volatility- and trend-based triggers. When one fund’s model fires, others follow within a narrow window, producing synchronised selling that deepens the very decline triggering the signal. BofA describes the current positioning as having moved from “near max long / low incremental buying” to the edge of large net selling.
The cascade works in four steps:
- The S&P 500 falls approximately 3%, crossing the primary CTA trigger threshold and converting long positions into forced sales
- Selling pressure in S&P futures spills into other U.S. indices (Russell 2000, Nasdaq 100), pushing them closer to their own trigger levels
- Cross-asset spillover reaches gold, European, and Japanese equities, where separate CTA thresholds sit at varying distances from current prices
- Price declines driven by these flows register as further negative trend signals in slower, larger CTA models, extending and deepening the move
BofA’s combined strategy analysis characterises incremental systematic buying capacity as “near exhausted,” meaning the buffer that would normally absorb selling pressure is already thin.
The starting conditions for that exhaustion of incremental buying capacity trace back to the May 2026 BofA Global Fund Manager Survey: fund manager positioning surged from a net 13% equity overweight in April to a record net 50% overweight in a single month, while average cash levels fell to 3.9%, crossing below BofA’s own contrarian sell threshold before CTA trigger risk even entered the picture.
The full trigger map: where each major index sits relative to its CTA threshold
U.S. index thresholds
The S&P 500 sits closest to its trigger, at approximately 3% below current spot. More aggressive stop-loss frameworks have already reduced S&P 500 long positions, but remaining exposure still reflects a blend of medium- and low-sensitivity long holders, all of which would be forced to sell if the threshold breaks.
The Russell 2000 threshold sits approximately 5% below current spot. Long positioning by CTAs in U.S. small caps remains at elevated levels, making it a latent source of additional systematic selling if the broader risk-off move deepens.
The Nasdaq 100 threshold for additional selling rounds also sits approximately 5% below current spot. BofA characterises near-term CTA trigger risk in the Nasdaq as relatively lower compared with the S&P 500 and Russell 2000. Remaining long exposure is concentrated among the least risk-sensitive models, as more aggressive frameworks have already trimmed positions.
International exposure: Europe and Japan
European and Japanese equities sit approximately 10% below current spot before their CTA trigger zones activate. Trend-following exposure in both regions is high because these markets have been strong. BofA expects incremental CTA buying in Europe near term as upward price trends persist, providing a partial offset. Long positioning by CTAs in the Nikkei also remains elevated, meaning the eventual selling, if triggered, would be substantial.
| Asset | CTA Trigger Threshold | Current Exposure Status |
|---|---|---|
| S&P 500 | ~3% below current spot | Medium- and low-sensitivity longs remain |
| Russell 2000 | ~5% below current spot | Elevated long positioning flagged as latent risk |
| Nasdaq 100 | ~5% below current spot | Remaining longs in least risk-sensitive models |
| European indices | ~10% below current spot | Incremental CTA buying expected near term |
| Nikkei | ~10% below current spot | Elevated long positioning |
Gold and oil: the commodity side of BofA’s CTA stress map
Gold is the more immediate commodity risk. BofA explicitly flags gold as more prone to triggering CTA risk-management selling than crude oil at present levels. The nearest risk-management trigger line sits approximately 2.6% below last Friday’s close (13 June 2026), and the bank warns that once broken, “the pace of selling may accelerate.”
The trend signals are already weakening. The fastest trend-following models have maintained short gold positioning for approximately two months. Medium- and long-term trend followers are now beginning to observe a deteriorating trend, which means the selling pressure could broaden beyond the fastest models if the trigger level breaks.
For investors who view gold as a safe-haven offset to equity risk, BofA’s analysis introduces a complication: systematic selling could temporarily undermine gold’s hedging function at precisely the moment equity stress peaks.
- Gold: Trigger approximately 2.6% below last Friday’s close; fast models already short for two months; medium- and long-term followers observing weakening trend; BofA warns selling pace may accelerate once the threshold breaks
- Crude oil: Prices have fallen in three of the preceding four weeks; most risk-averse CTAs may have already been stopped out of longs; additional exits anticipated if downward price movement continues; less immediately exposed to CTA stop-out risk than gold
The scenario table: how bad could systematic selling get across all strategies
BofA’s three-scenario framework combines CTAs, risk-parity funds, and volatility-control strategies into a single net-selling estimate for the coming week.
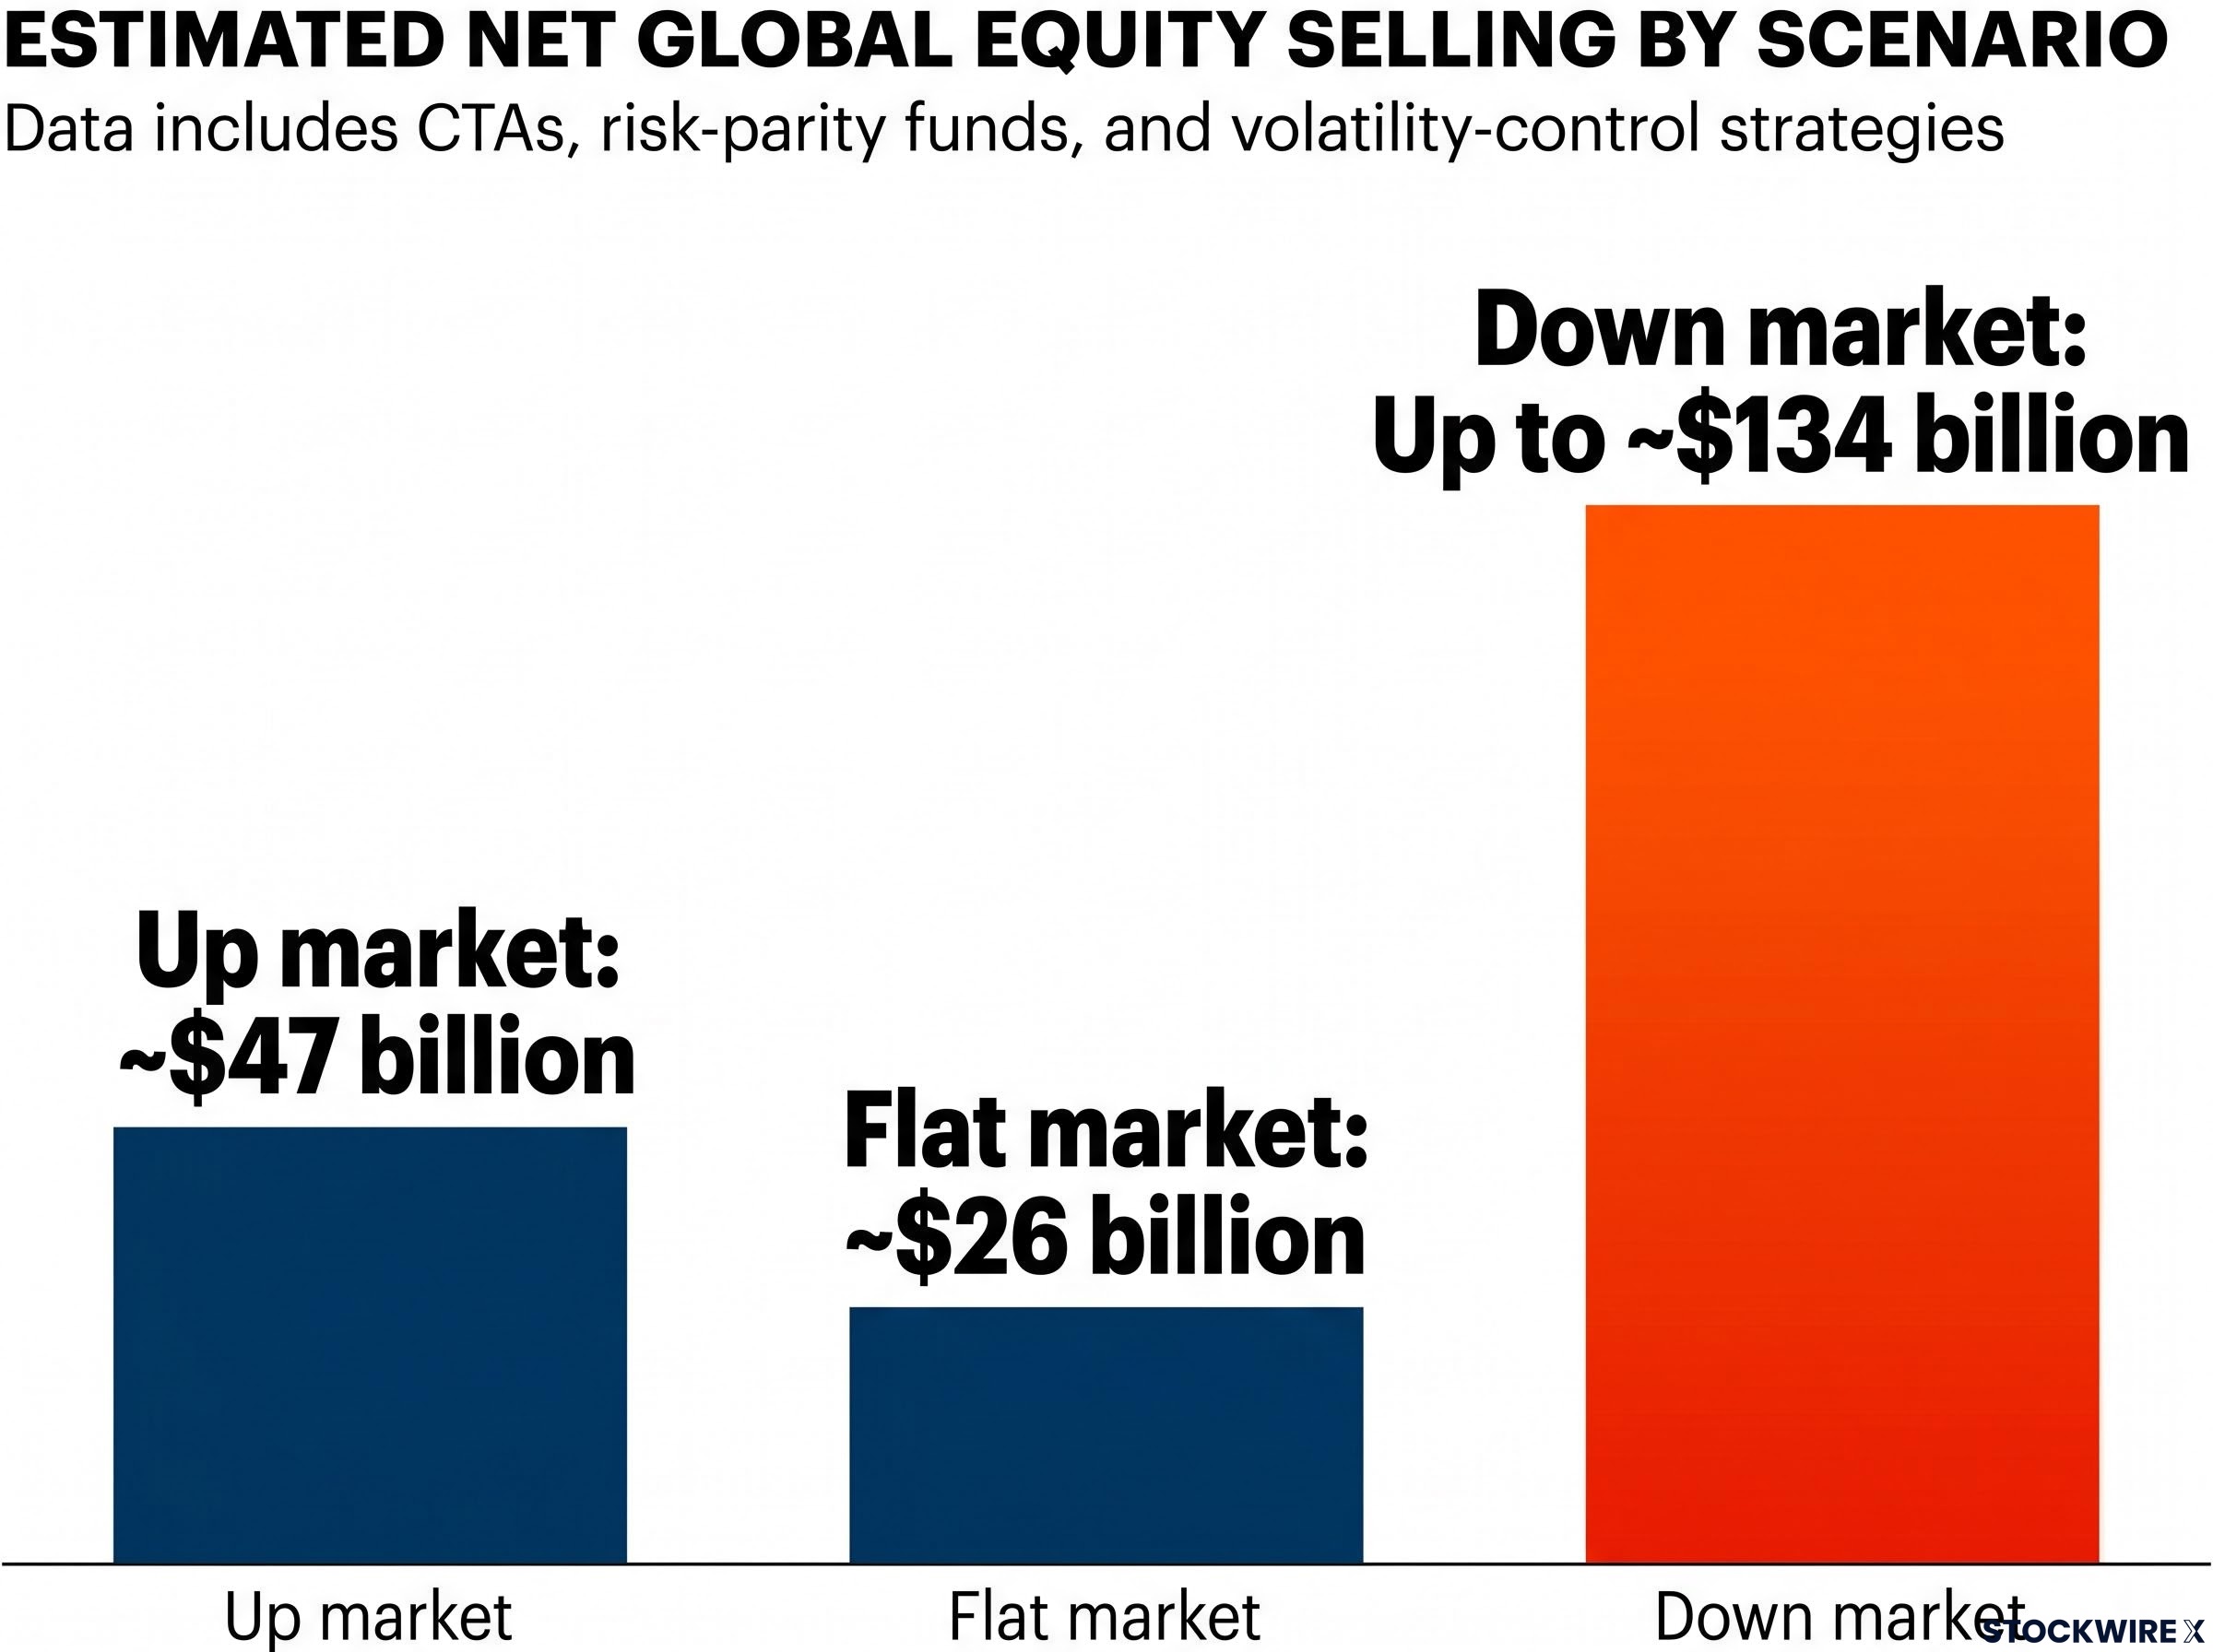
| Scenario | Estimated Net Global Equity Selling |
|---|---|
| Up market | ~$47 billion |
| Flat market | ~$26 billion |
| Down market | Up to ~$134 billion |
Even the “up” market scenario produces approximately $47 billion of net systematic selling. That figure reframes the risk: this is not a tail event contingent on a crash. Incremental systematic buying capacity is, in BofA’s characterisation, “near exhausted.” CTAs, risk parity, and volatility-control strategies all point to net equity selling across all three scenarios over the next week.
The asymmetry between upside and downside flows is the structural point. A bounce reduces the selling but does not eliminate it. A further decline multiplies it. Any short-term rally into these conditions faces a mechanical headwind that fundamental analysis alone would not predict.
The other side of the trade: what stabilisation means for CTA positioning
The dynamic runs in both directions. CTAs that still hold long exposure act as residual market support if prices stabilise or recover. Improving trend signals could force systematic re-buying rather than selling, converting the same mechanical logic from a drag into a tailwind.
BofA’s own data confirms this two-sided structure. When equities recovered on Thursday, the SG CTA Index posted positive performance. In Europe, incremental CTA buying is already expected as positive trends persist.
- Stabilisation scenario: CTAs remain as residual support; improving trends trigger systematic re-buying; European equities receive incremental CTA demand
- Decline scenario: A further 3% S&P 500 drop activates large-scale forced selling; cross-asset spillover reaches gold, small caps, and international indices; systematic strategies become a net drag of up to $134 billion
The key asymmetry is structural. The upside scenario requires trend continuation. The downside scenario requires only a relatively small additional decline to activate mechanically. The specific price levels, not the macro narrative, determine which dynamic takes hold.
Oil shock recession risk adds a compounding macro dimension to the mechanical picture: with Brent crude sitting approximately $1.50 below Goldman’s S&P 500 sell-off threshold as of late April 2026, and gasoline at $4.25 per gallon placing the environment in a category that has historically preceded average 11% S&P 500 declines over the following six months, the fundamental and systematic selling pressures are not independent of each other.
BofA’s trigger map puts a precise number on mechanical market risk
BofA’s analysis is not a crash call. It is a precision map of where mechanical forces become large enough to alter market structure: 3% for the S&P 500, 5% for the Russell 2000 and Nasdaq 100, 2.6% for gold, and a scenario table showing systematic strategies as a near-term net drag even if markets rise. Understanding who is selling and why is the starting point for interpreting equity volatility rather than attributing every move to fundamentals.
For investors wanting the broader context behind BofA’s analytical framework, our full explainer on BofA’s Bull and Bear Indicator covers its 18-instance history since 2002, the specific convergence of technology inflows and cash compression that triggered it in May 2026, and the documented average 2-3% global equity decline that has followed within three months.
This article is for informational purposes only and should not be considered financial advice. Investors should conduct their own research and consult with financial professionals before making investment decisions. These systematic flow estimates are modelled projections and are subject to change based on market developments.