
How to Filter Australia’s 70 Fixed Interest ETFs to a Short List
6 mins ago

Approximately 40 equity ETFs on the ASX currently market themselves as high-yield or income-focused. Most of them should not be in a retirement income portfolio. For self-funded retirees and SMSF investors, the proliferation of “income” labels has made selection harder, not easier. The broad ASX 200 delivers a cash yield of roughly 3.4%, grossed up to around 4.4% with franking credits. Any ETF charging an income-focused fee needs to clear that bar by a meaningful margin. Choosing the wrong product means accepting near-market yields at higher fees, or worse, drawing down capital without realising it. This guide provides a sequential filtering framework that eliminates the majority of marketed income ETFs using objective criteria, explains where franking credits change the calculus for Australian superannuants, identifies specific red flags that disqualify funds before yield is even considered, and walks through the case for a concentrated bank ETF as a core income holding.
Every filtering exercise needs a reference number, and for Australian equity income ETFs, that number already exists. The A200 ETF, tracking the ASX 200, delivered a trailing 12-month cash distribution yield of 3.4% and a gross distribution yield (including franking credits) of 4.4% as of mid-2026. Any fund marketed as “high yield” needs to beat that grossed-up figure by a margin wide enough to justify its existence.
Three reference yields anchor the framework:
A fund that clears the 4.5-5%+ grossed-up threshold has earned the “high yield” label. Below that, it is a broad-market product with different branding.
“If a fund’s grossed-up yield does not meaningfully exceed 4.4%, it is not delivering income above the broad market.”
Vanguard’s VHY demonstrates the gap clearly. Its 5-5.5% cash yield before franking sits materially above the ASX 200 baseline, confirming that genuine income selection produces a measurably different outcome from passive broad-market exposure. That yield gap is the minimum standard every other income ETF should be measured against.
Before comparing yields, fees, or portfolio composition, two mechanical filters can eliminate roughly half the field. Neither requires a spreadsheet. Both rely on publicly available data.
| Filter | Threshold | Approximate Funds Eliminated |
|---|---|---|
| AUM | Minimum $100 million | 10-15 of approximately 40 |
| Holdings count | 100+ holdings disqualifying | Additional subset of remaining funds |
Funds under $100 million in assets under management create practical problems for income investors. Smaller funds tend to carry wider bid-ask spreads, reducing the net price received on exit. Liquidity can thin during market stress, precisely when a retiree may need to sell. Closure or merger risk also rises with smaller scale, forcing unplanned portfolio changes.
This is not an arbitrary threshold. QSuper’s institutional ETF selection criteria require a minimum of $100 million in funds under management, an average monthly trading volume of at least $10 million, and management costs at or below 1% per annum. Applying just the AUM rule eliminates roughly 10-15 of the approximately 40 equity income ETFs currently listed on the ASX.
The Australian market has a limited pool of large, consistently profitable, dividend-paying companies. A genuinely selective income portfolio reflects this reality. An ETF holding 100-plus stocks in an “income” wrapper is almost certainly approximating broad-market exposure rather than targeting high-yield names with conviction.
The decision rules are straightforward:
VHY holds approximately 73-79 stocks. That is above the 20-name ideal, but its index explicitly tilts toward above-average forecast dividend payers and enforces concentration limits, making it demonstrably income-tilted rather than a broad-market clone.
For SMSF investors in pension phase, comparing income ETFs on cash yield alone is an analytical error that can cost a full percentage point or more. Franking credits change the maths, and for Australian superannuants, the change is material.
Australian companies pay corporate tax on their profits before distributing dividends. A franking credit represents the tax already paid, passed through to the shareholder. For an SMSF in pension phase, where the tax rate is 0%, the Australian Taxation Office refunds the full franking credit in cash. This means the economically relevant yield is the grossed-up figure (cash distributions plus franking credits), not the headline cash yield alone.
Franking credit mechanics determine the full economic value of every dividend paid by an Australian company, because an SMSF in pension phase faces a 0% tax rate and receives the entire imputation credit as a cash refund from the ATO, converting a $70 cash dividend into $100 of total value at the 30% corporate tax rate.
The ATO guidance on SMSF franking credit offsets confirms that pension-phase funds operating under exempt current pension income rules can claim a full cash refund of excess franking credits, making the grossed-up yield the only valid income comparison for this class of investor.
Evaluate any income ETF using these steps:
For pension-phase SMSFs, franking credit refunds make the grossed-up yield the only economically valid comparison metric.
This distinction matters when comparing equity income ETFs against unfranked alternatives. A Macquarie bank savings account offering 5% carries no franking credits. A fixed-interest ETF carries none. VHY’s grossed-up yield, factoring in its franked Australian equity dividends, is materially higher than its 5-5.5% cash figure for a pension-phase superannuant. At the same headline cash rate, the franked equity ETF delivers more after-tax income to the investor who can use the credits.
A high yield number on a fact sheet is the last thing to check, not the first. Two structural problems can make the most aggressively marketed income ETFs the most dangerous for long-horizon retirees.
Dividend trap signals on the ASX are amplified by the franking system itself: the grossed-up yield calculation can shift investor focus toward headline income and away from payout sustainability, encouraging positions to be held beyond what earnings fundamentals warrant, particularly in ETFs where trailing yields are temporarily inflated by one-off capital gains distributions from index rebalancing events.
Mining and energy company dividends are tied to commodity prices. When iron ore or oil is high, BHP and Woodside pay handsomely. When commodity cycles turn, those dividends compress or disappear. For a retiree planning monthly cash flow around dividend receipts, this volatility is structural, not temporary.
Check any income ETF’s top 10 holdings for these warning signs:
Even VHY, a generally sound income product, carries BHP at approximately 11-12% and Woodside at approximately 6% of its top holdings. That is a non-trivial resource component investors should factor into their assessment of income reliability.
Some ETFs advertise yields of up to approximately 9%. The mechanism behind that figure deserves scrutiny. When a fund distributes more than it receives in dividends, the shortfall is met by selling assets or returning the investor’s own capital. The headline yield looks impressive. The unit price drifts lower over time.
Detect this pattern using two checks:
For investors with 10-20 year retirement horizons seeking capital preservation, a structure that erodes the income-producing base to fund today’s distributions is at odds with the goal. A fund returning capital is not generating income; it is returning the investor’s own money at a slower pace.
Australian major banks sit among the strongest and most persistent dividend payers on the ASX. A regulated oligopoly with structurally high profitability, the major banks have long histories of paying fully or near-fully franked dividends. For an income-first retiree, this combination of yield, franking, and regulatory stability makes a compelling case for a concentrated bank allocation.
MVB, the VanEck Australian Banks ETF, is a direct expression of that thesis. It holds just 7 securities, including major banks alongside regional names such as Macquarie, Bendigo and Adelaide Bank, and Bank of Queensland. Its AUM of approximately $284 million clears the $100 million institutional threshold. Its management fee sits at 0.28% per annum, and distributions are paid three times per year. The grossed-up yield is competitive relative to the 5% Macquarie bank savings account benchmark, the comparison most income-focused retirees are making when evaluating equity income against cash alternatives.
For investors weighing franked dividends against term deposits, the comparison shifts decisively once the grossed-up yield is applied: a 6% fully franked dividend equates to approximately 8.5% on a grossed-up basis for a pension-phase SMSF paying 0% tax, comfortably clearing the 5% Macquarie bank savings account benchmark cited as the reference point for this analysis.
| Filter | MVB Result | Pass / Flag |
|---|---|---|
| AUM ≥ $100M | $284 million | Pass |
| Holdings count | 7 securities | Pass (concentrated) |
| Yield vs baseline | Grossed-up yield above ASX 200 floor | Pass |
| Fees | 0.28% p.a. | Pass |
| Franking | Fully franked dividends from major banks | Pass |
| Resource exposure | Nil (financials only) | Pass |
The affirmative case is strong. The counterweight is equally clear, and non-negotiable to understand.
“The banking sector fell approximately 54% in 2008 and took around 11 years to recover to prior highs. Any concentrated bank allocation must be sized with that history in mind.”
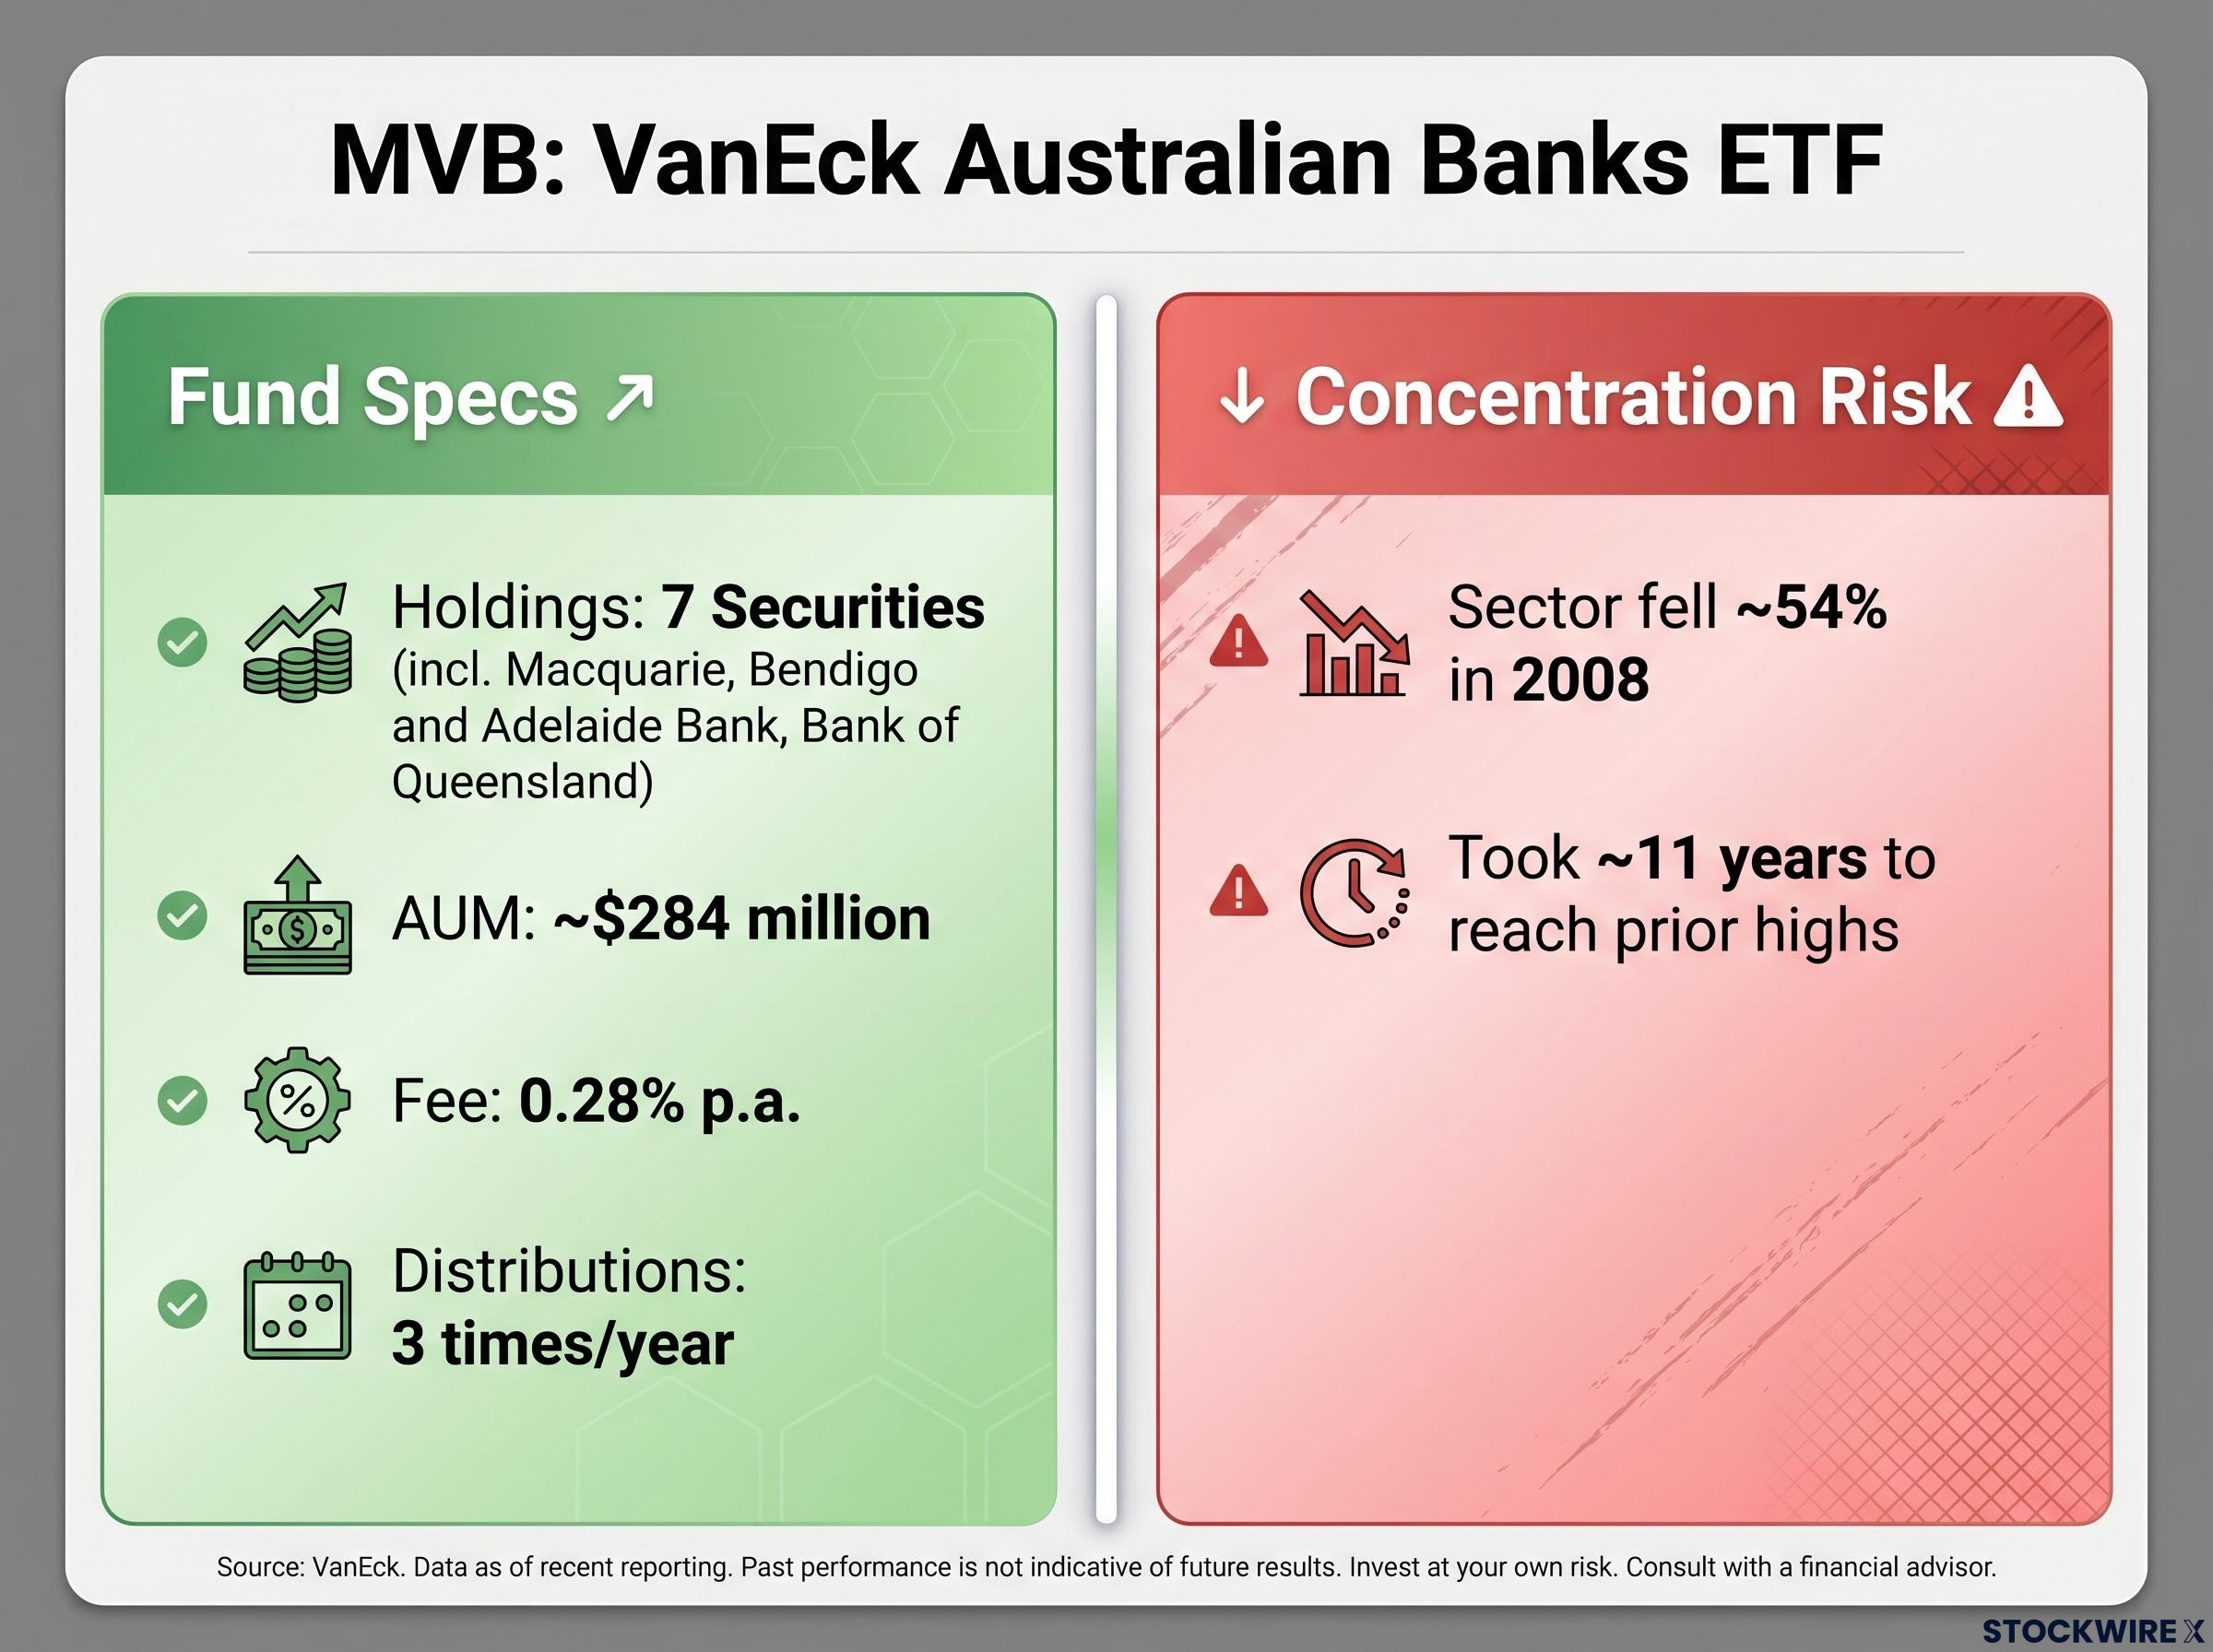
During the Global Financial Crisis, the Australian banking sector declined approximately 54%. Recovery to pre-GFC highs took around 11 years. Investors who held through that period continued to receive dividends, but their capital remained impaired for the better part of a decade. A 7-stock portfolio concentrated entirely in one sector amplifies that drawdown risk relative to a diversified equity holding.
For an income-oriented retiree, MVB can function as the core income engine, provided position sizing and entry discipline reflect the historical drawdown record. A staged or valuation-aware entry is preferable to an all-in allocation at cyclical peaks.
Applied sequentially, the five hard filters convert a confusing 40-product field into a manageable shortlist. The expected outcome is 2-4 qualifying funds, not a dozen.
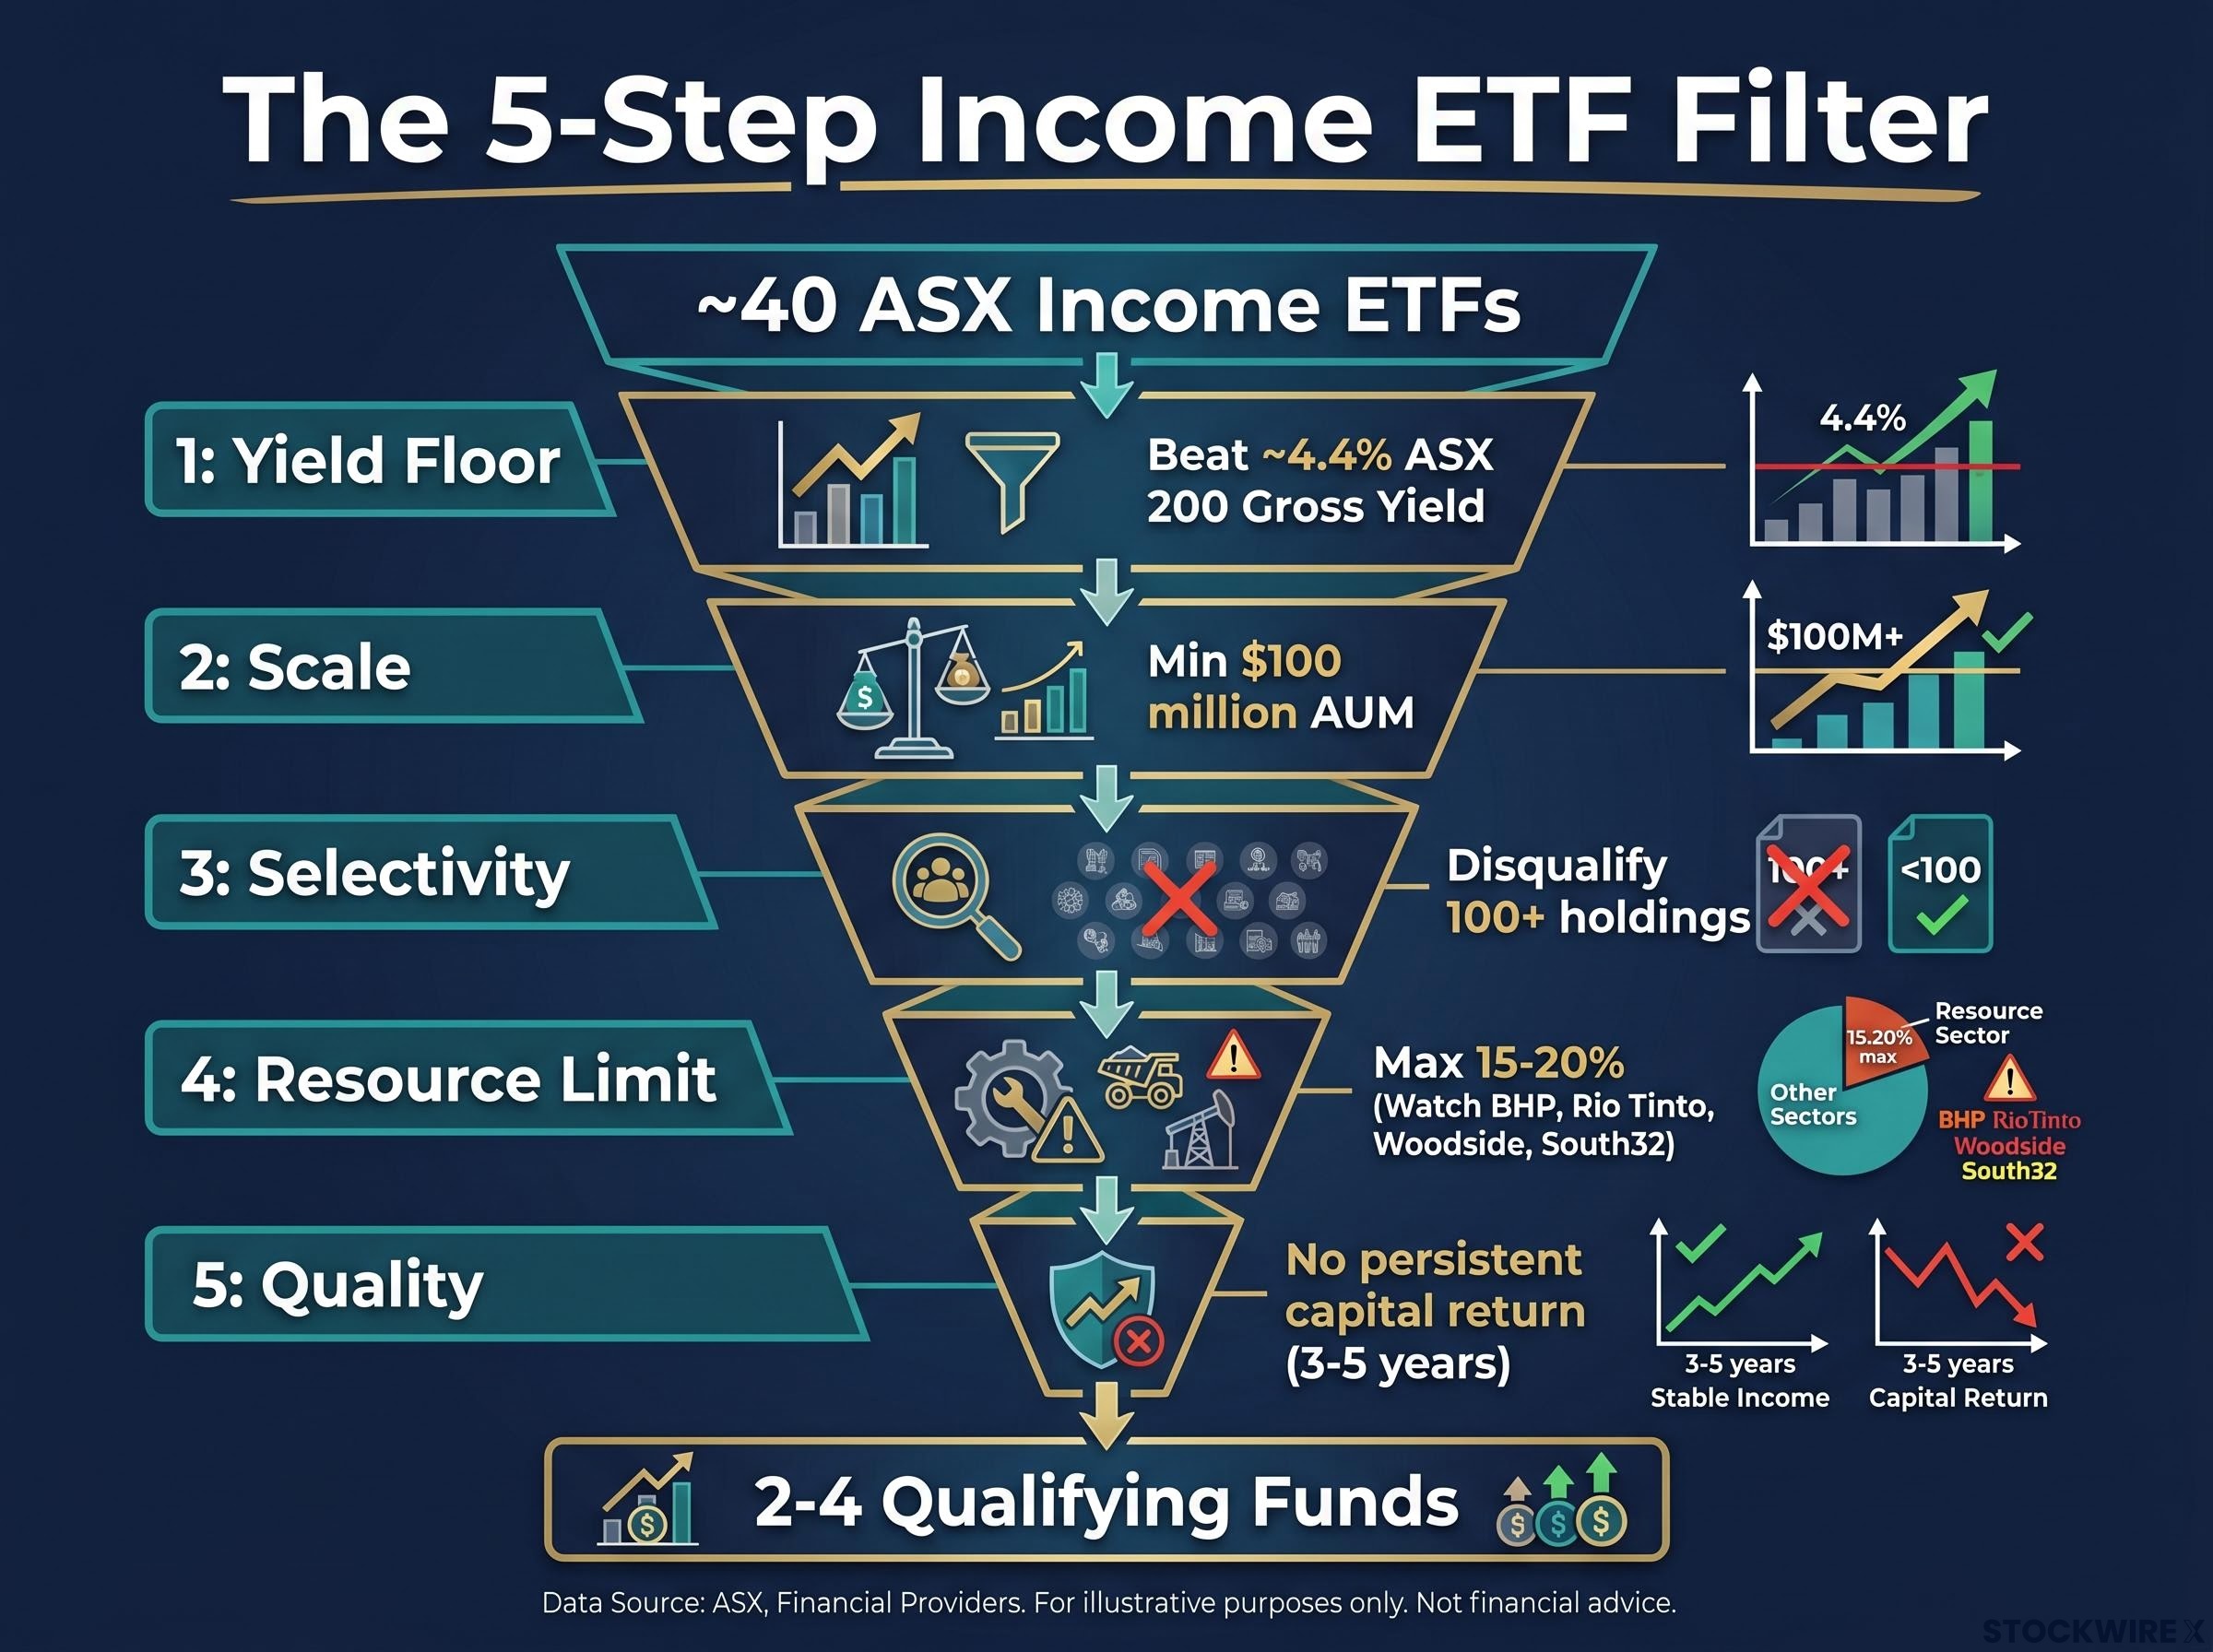
The complete filtering sequence:
The portfolio structure that emerges from this filtering is a core-plus approach:
Fee drag is the final comparison dimension between shortlisted funds. Passive income ETFs in the 0.2-0.35% range are broadly competitive. Active income ETFs charging 0.65-0.75%+ require a demonstrable after-fee yield advantage to justify the cost difference.
Income-tilted equity portfolios carry an inherent trade-off that should be understood before committing heavily: they characteristically underperform in strong bull markets and outperform during downturns. For a retiree prioritising reliable franked cash flow over capital growth, that trade-off is often acceptable.
The Australian market has a limited pool of genuine high-dividend payers. A short ETF list after filtering is a sign the framework worked correctly, not a sign of inadequate diversification. Most of the approximately 40 marketed income ETFs fail on yield, scale, selectivity, or distribution quality. The 2-4 that survive represent the products with a credible structural case for delivering above-market franked income over a retirement horizon.
The income-versus-growth trade-off is real and should be accepted explicitly. Income-tilted portfolios will lag during strong bull markets. That is the expected, acceptable price of a reliable franked cash flow stream for retirement purposes.
For readers wanting to understand the policy environment surrounding franked income portfolios, our full explainer on CGT reform and franked income covers how a potential reduction in the 50% CGT discount would narrow the after-tax advantage of growth assets and increase the relative attractiveness of franked dividend strategies, including the specific scenarios most relevant to SMSF pension-phase investors.
The next practical step is application. Take the filtering checklist, apply it to current holdings or a shortlist under consideration, and run the five screens in sequence: yield floor, AUM, holdings count, resource exposure, and capital return check. The framework does the elimination. The investor makes the final selection from what remains.
This article is for informational purposes only and should not be considered financial advice. Investors should conduct their own research and consult with financial professionals before making investment decisions.
A grossed-up yield adds the value of franking credits to the cash distribution yield, giving the true economic return on a franked dividend. For SMSF investors in pension phase, it is the only valid comparison figure because the ATO refunds franking credits in full as cash, converting a nominal cash yield into a materially higher after-tax income figure.
Of approximately 40 equity ETFs marketed as high-yield or income-focused on the ASX, applying five sequential filters covering grossed-up yield, AUM, holdings count, resource exposure, and capital return patterns typically leaves just 2-4 qualifying products.
A minimum of $100 million in assets under management is the institutional benchmark, consistent with criteria used by QSuper, and applying this filter alone eliminates roughly 10-15 of the approximately 40 ASX equity income ETFs currently listed.
Compare the fund's distribution history against its unit price over 3-5 years; persistent high distributions alongside a steadily declining unit price is a warning signal. Australian ETFs are also required to disclose whether any portion of a distribution is a return of capital in their tax component statements.
The primary risk is sector concentration: the Australian banking sector declined approximately 54% during the Global Financial Crisis and took around 11 years to recover to prior highs, meaning a 7-stock portfolio entirely in financials amplifies drawdown risk relative to a diversified equity holding and requires careful position sizing.


