What the Betashares Global Defence ETF Actually Holds
3 hrs ago

DHHF already sits at the risk end of the spectrum. It holds 100% equities with no bonds, no cash, and no defensive allocation. GHHF takes that same portfolio and amplifies every gain and every loss by approximately 1.5 times. For ASX investors weighing the two Betashares products, the question is whether that amplification is a feature or a warning.
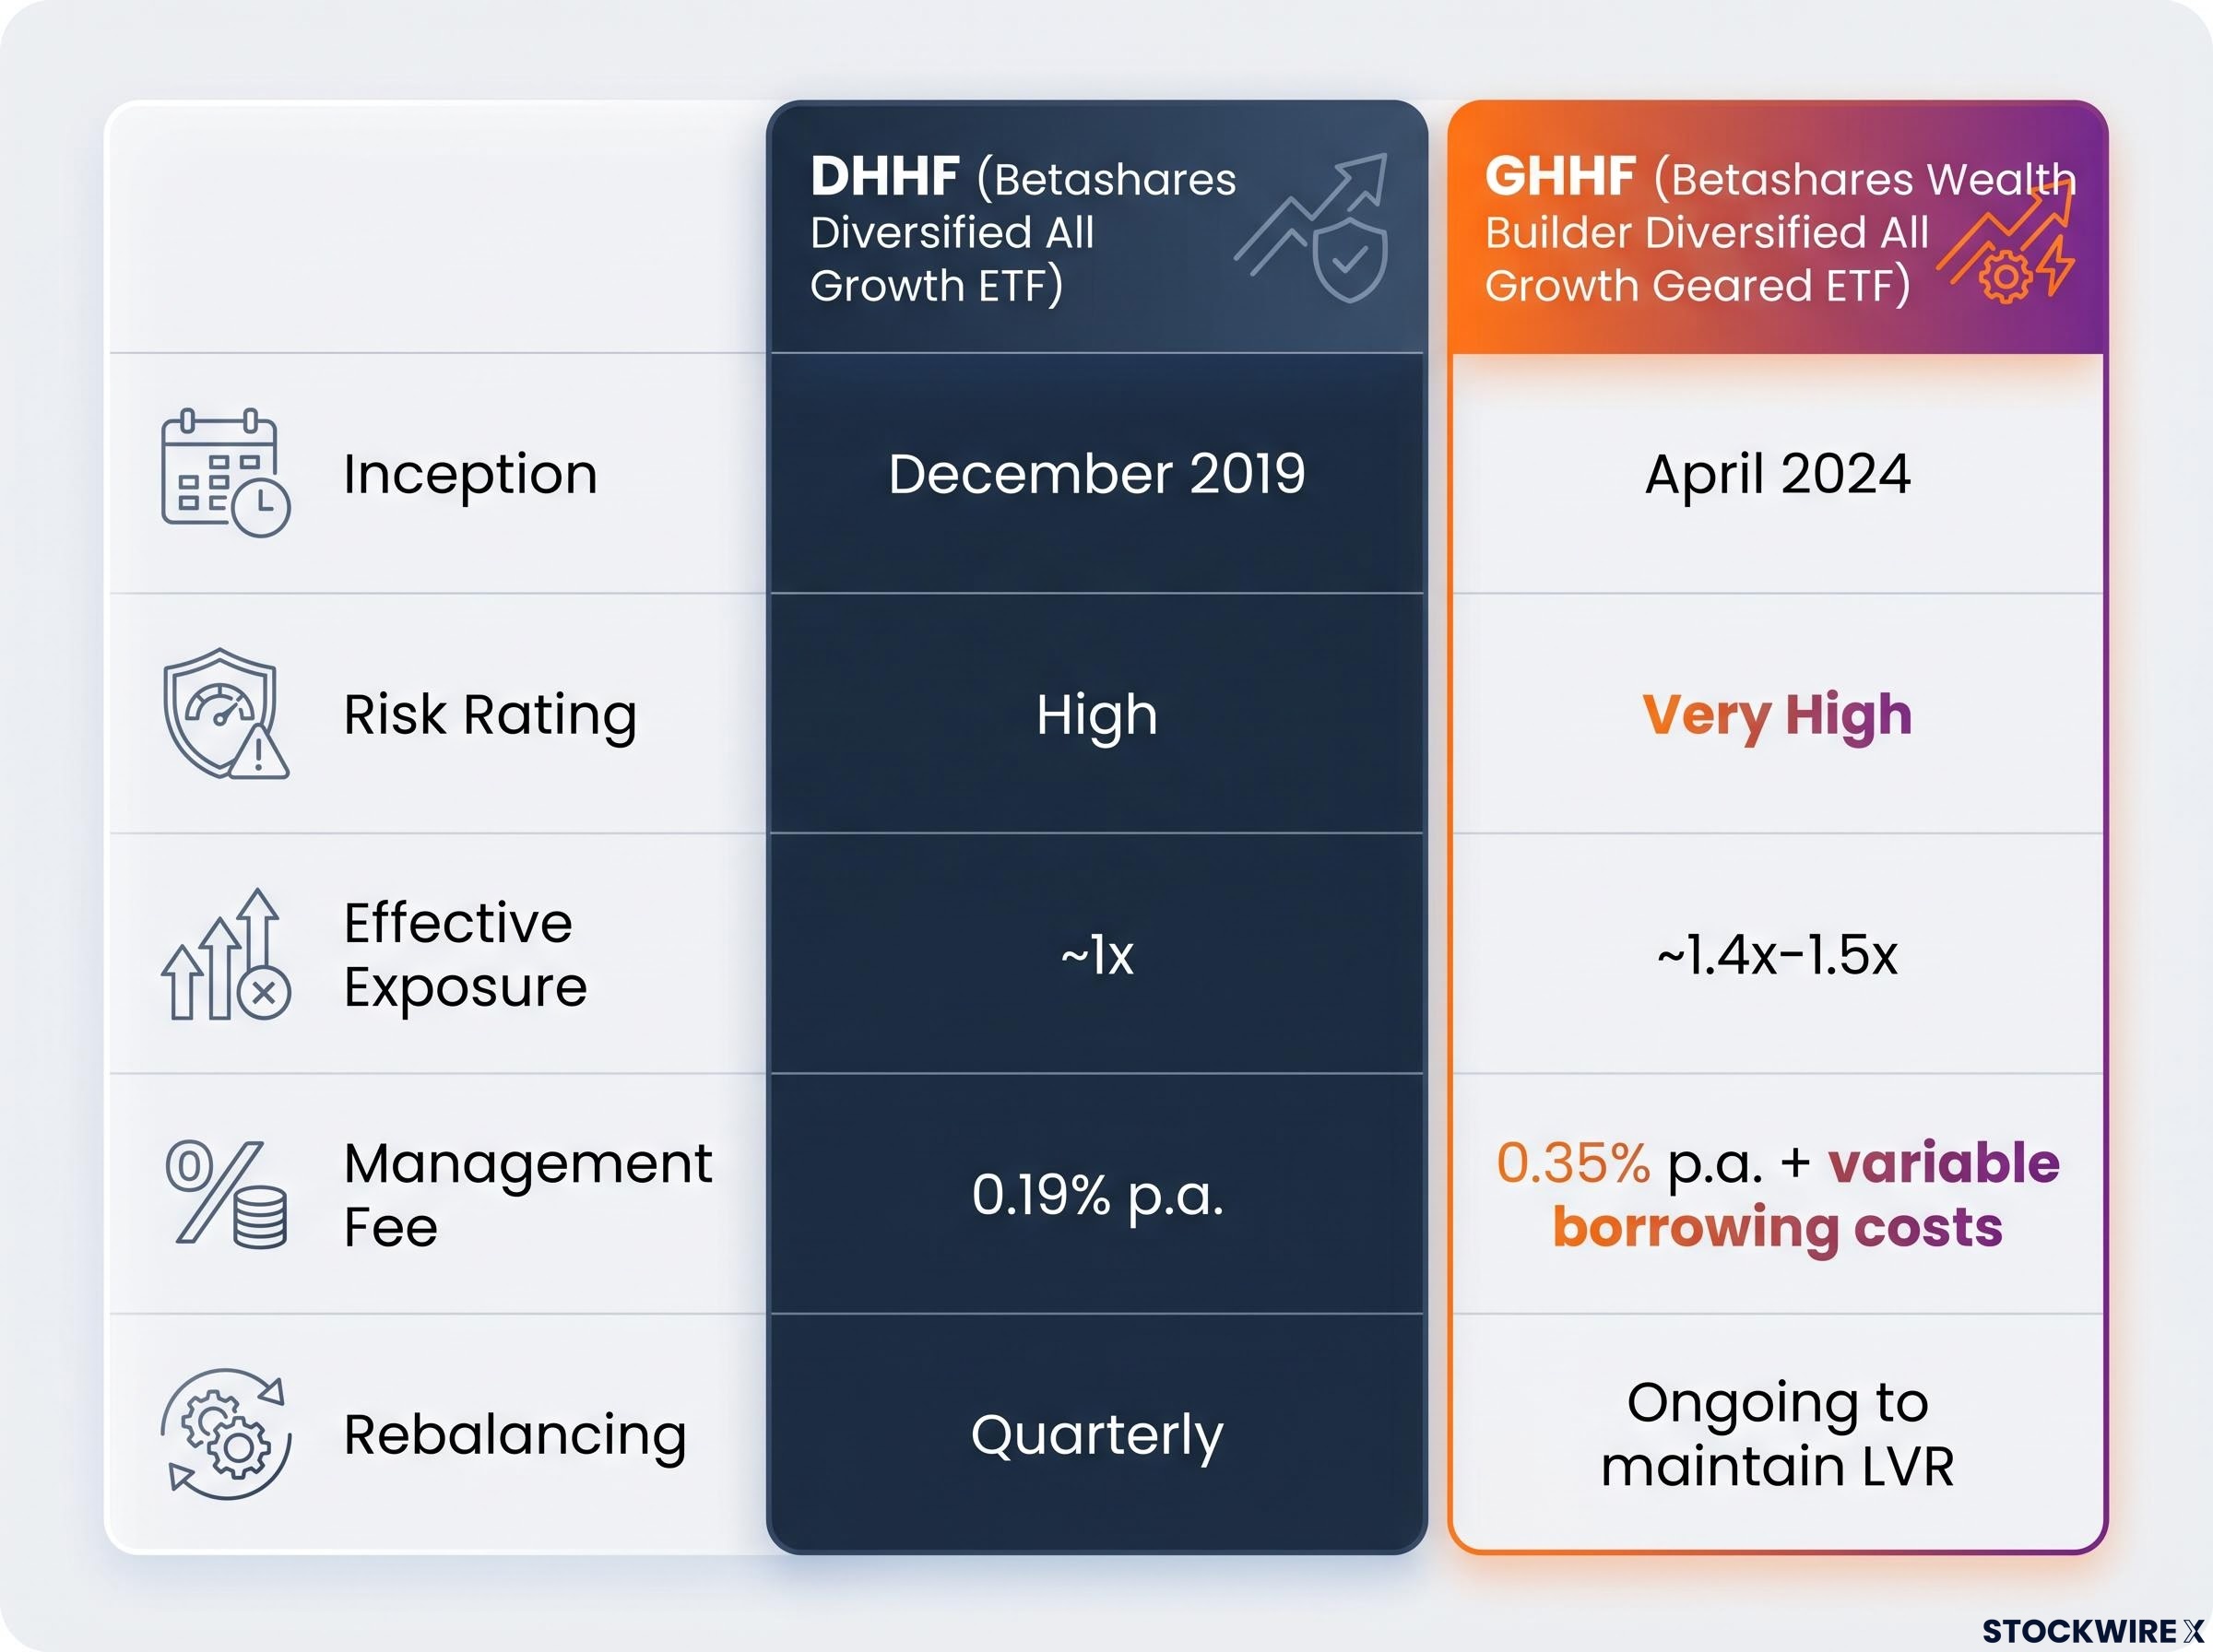
Both funds are built on the same underlying all-equity, all-growth philosophy. GHHF, which launched in April 2024, layers internal gearing of 30-40% loan-to-value ratio (LVR) onto the DHHF framework, producing effective market exposure of roughly 1.4x-1.5x. With GHHF’s one-year return exceeding 20% in a rising market, investor interest is understandable. But the performance comparison only tells part of the story.
This analysis breaks down how the two funds are built, what gearing actually does to return outcomes and risk exposure, how fees and costs diverge across time horizons, and which investor profile each product genuinely suits.
DHHF (Betashares Diversified All Growth ETF) is a fund of ETFs providing 100% equity exposure across approximately 8,000 securities on more than 60 global exchanges. Its geographic split sits at roughly 37% Australian equities and 63% international equities, rebalanced quarterly. It first listed in December 2019.
Both DHHF and GHHF are unit trusts with assets held separately from the issuer’s balance sheet, a legal protection that applies across the ASX ETF structure and costs framework that governs all ETF products listed in Australia, including the MER disclosures, distribution tax treatment, and execution mechanics that affect net returns over time.
GHHF (Betashares Wealth Builder Diversified All Growth Geared ETF) uses the same underlying allocation but borrows internally to target a 30-40% LVR, producing an effective exposure of approximately 1.49x at recent illustrative levels. The fund provides exposure to thousands of equities across Australian and global markets. It launched in April 2024 and rebalances borrowings on an ongoing basis to remain within its target gearing range.
Neither fund holds defensive assets. This is not a comparison between safety and risk. It is a comparison between high risk and very high risk, with gearing as the only meaningful variable.
| Feature | DHHF | GHHF |
|---|---|---|
| Asset class | 100% equities | 100% equities (geared) |
| Gearing level | None | 30-40% LVR target |
| Effective exposure | ~1x | ~1.4x-1.5x |
| Securities coverage | ~8,000 equities, 60+ exchanges | Thousands (Australian and global) |
| Geographic split | ~37% AU / 63% international | Similar underlying allocation |
| Inception | December 2019 | April 2024 |
| Rebalancing | Quarterly | Ongoing within LVR target |
Gearing is straightforward in a rising market. It is less intuitive when markets fall, and the asymmetry is where most investors lose the thread.
The mechanics follow a chain of cause and effect:
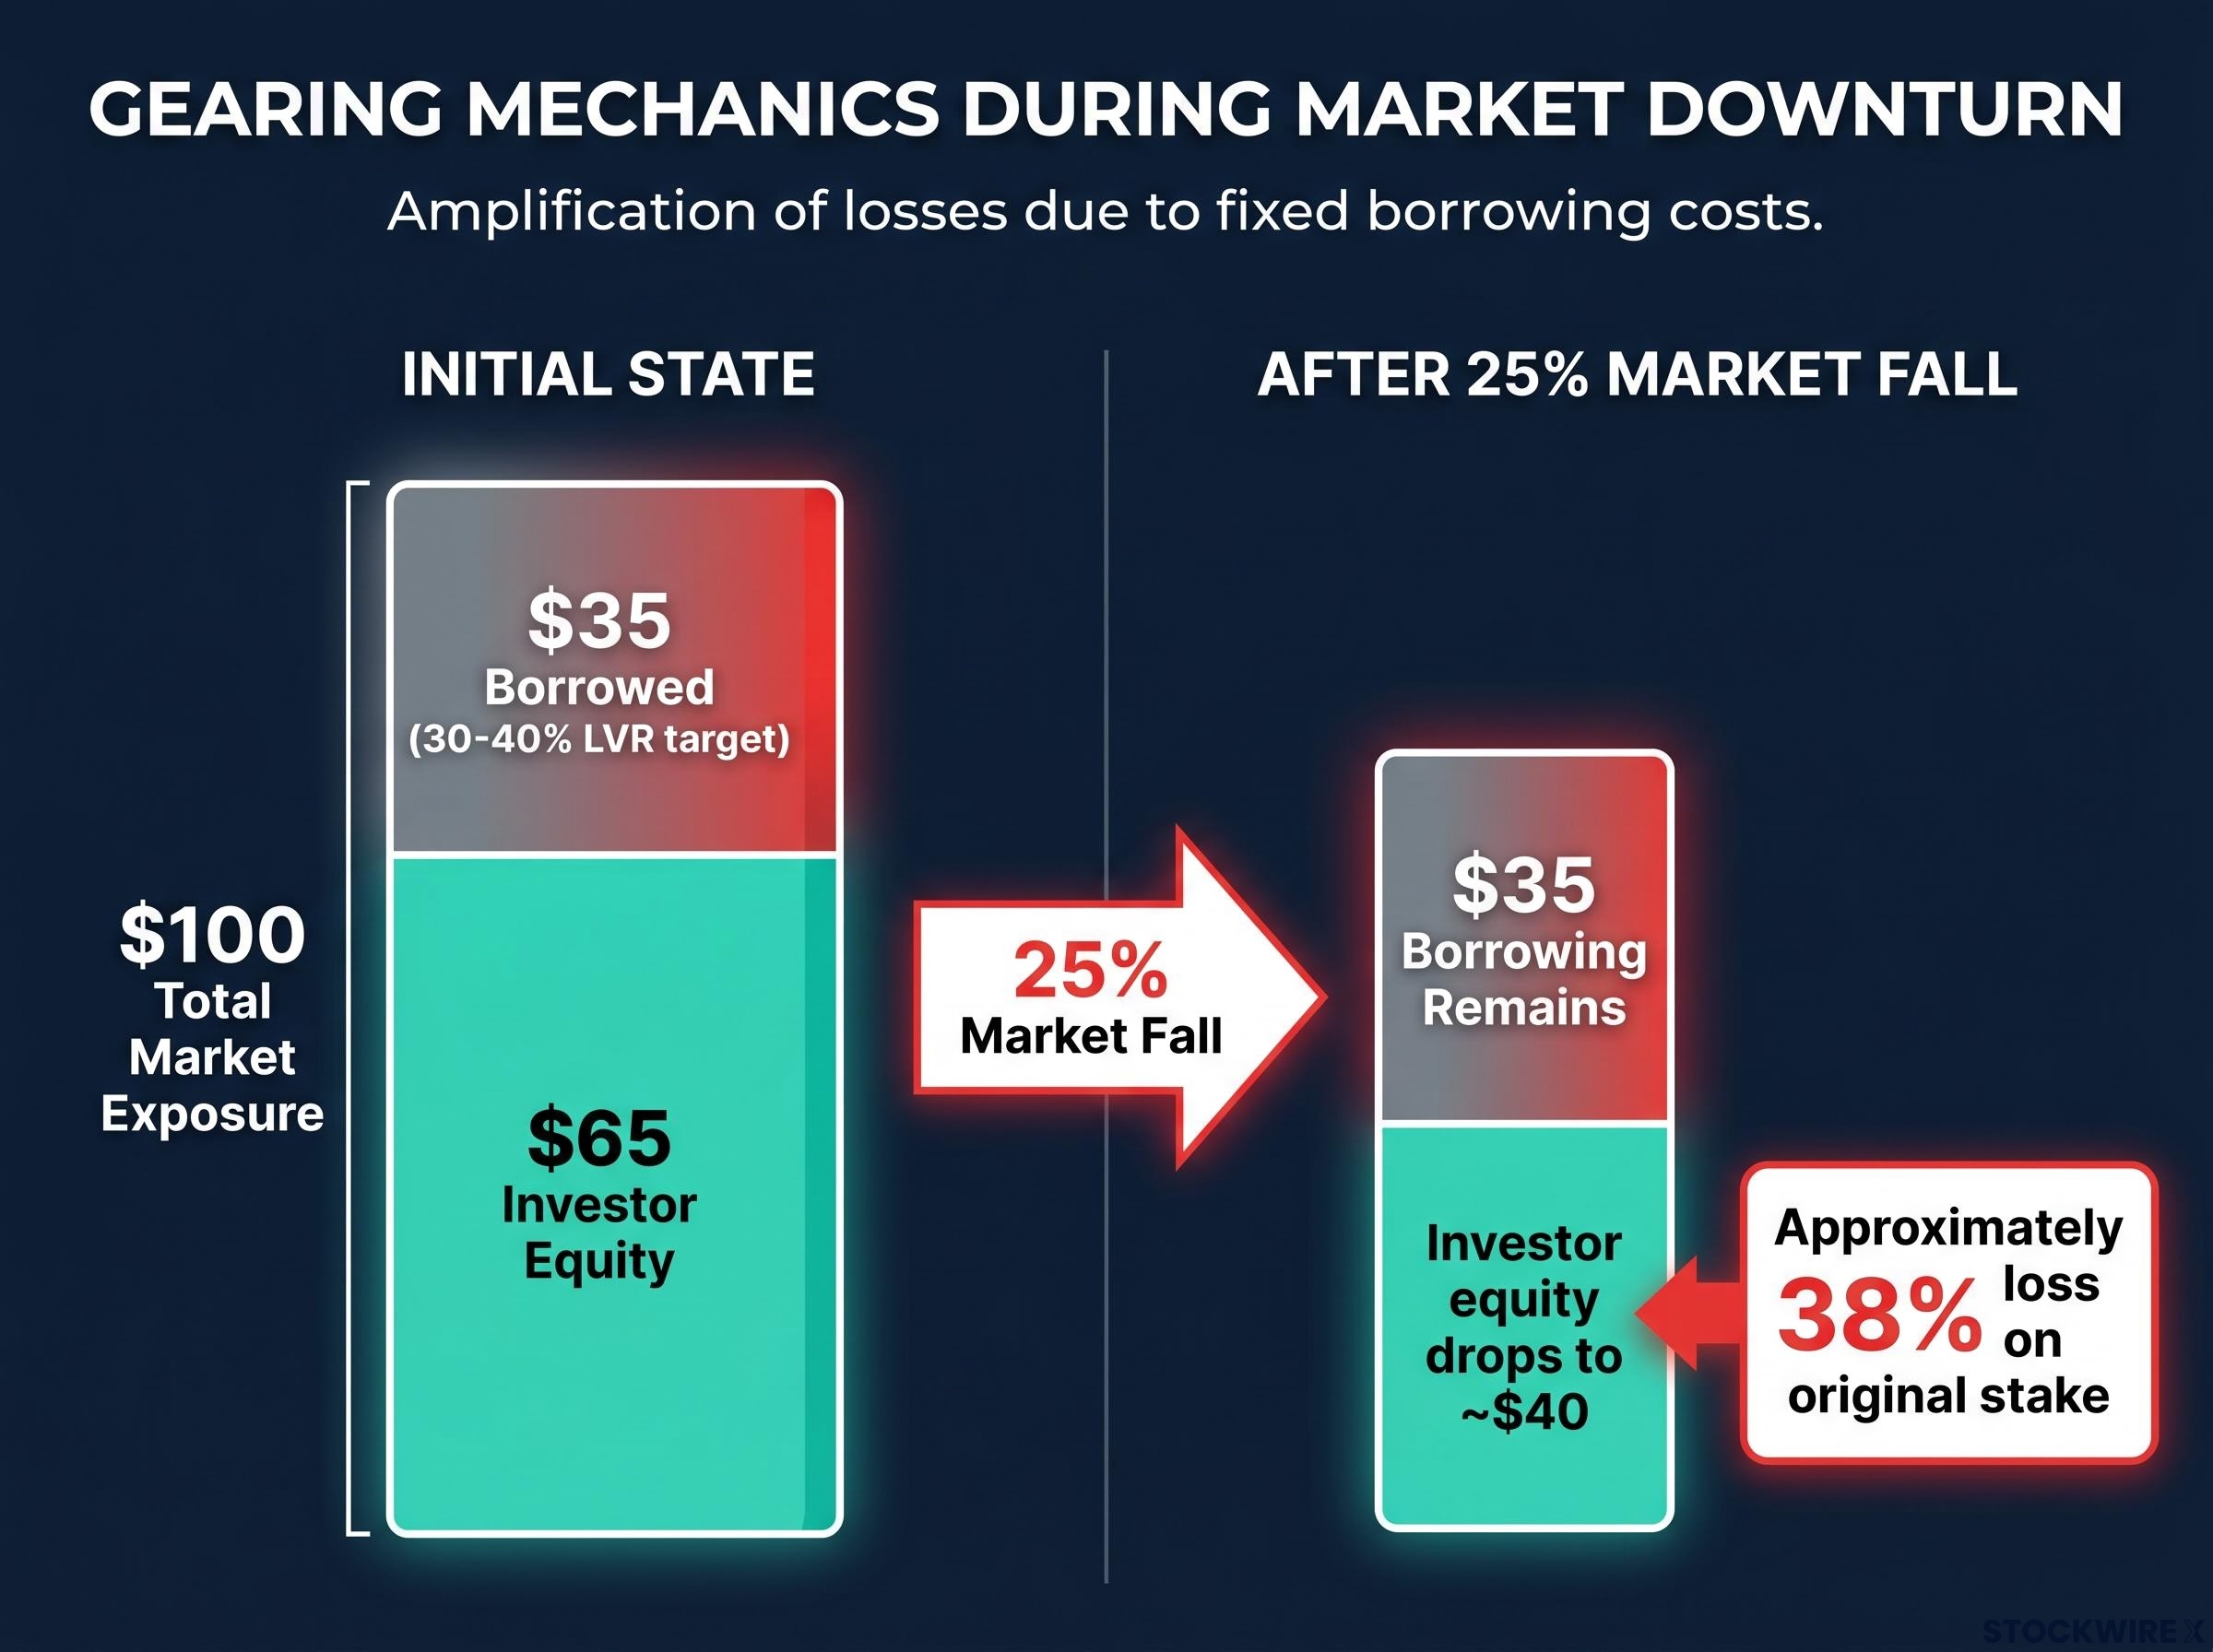
A 25% market decline produces an approximately 38% loss on investor equity in a geared structure with 35% LVR. The debt does not shrink with the portfolio. The investor absorbs the full impact.
Investors in GHHF do not receive personal margin calls. The fund manages its borrowings internally. But the economic effect of forced de-levering during a downturn resembles precisely what a margin call produces: selling into weakness, reducing the compounding base, and locking in losses that a patient buy-and-hold investor in an unleveraged fund would simply sit through.
This asymmetry is not a risk that might materialise. It is the mechanical consequence of how gearing works in every market decline.
GHHF avoids the volatility drag that afflicts daily-reset leveraged ETFs, where compounding asymmetry erodes returns even in flat or mildly oscillating markets, but it replaces that risk with a different one: borrowing costs and forced de-levering during drawdowns that daily-reset products, being self-contained within a single trading session, never need to manage.
The headline numbers are compelling. DHHF has delivered a one-year return of 12.97%, while GHHF has returned 20.74% over the same period. The gap looks like a clear argument for gearing.
It is not.
Past performance does not guarantee future results. All performance figures should be verified against current Betashares factsheets before making investment decisions, as the figures cited here reflect a specific reference period and may have changed.
GHHF’s outperformance was recorded in a predominantly rising market environment. Gearing amplifies gains in exactly the proportion it amplifies losses. The 20.74% return and the 21.41% since-inception annualised figure reflect approximately two years of broadly favourable equity conditions, not a full market cycle.
| Period | DHHF | GHHF |
|---|---|---|
| 1-Year | 12.97% | 20.74% |
| 3-Year (annualised) | 14.93% | N/A |
| 5-Year (annualised) | 10.69% | N/A |
| Since inception (annualised) | 11.73% | 21.41% |
GHHF’s three-year and five-year figures will not be available until 2027 and 2029 respectively. Until those numbers exist, any performance comparison is necessarily incomplete.
The other side of the ledger is already visible, though. One YTD snapshot during a period of market weakness showed GHHF at approximately -9.30% versus DHHF at approximately -5.97%, though these figures have not been independently confirmed. The pattern is consistent with what gearing mechanics predict: amplification cuts in both directions with equal force.
Investors drawn to GHHF by its recent headline returns are seeing the product at its most flattering. A single significant drawdown would rewrite the comparison entirely.
Performance captures attention. Costs determine outcomes.
DHHF carries a management fee of 0.19% per annum. GHHF charges 0.35%, and that headline figure understates the gap. GHHF’s borrowing costs, which vary with prevailing interest rates, represent a separate and additional drag on returns above the 0.35% management expense ratio (MER).
The distinct cost components for each fund:
The 0.16% annual fee differential before borrowing costs may appear modest in any single year. Over a 30-year holding period, however, that gap compounds materially against terminal wealth. On a $100,000 portfolio, even the management fee differential alone represents a meaningful reduction in final value, and the variable borrowing costs widen the gap further.
ETF fee compounding works against investors in a way that is easy to underestimate: Morningstar research identifies fees as a more reliable predictor of long-term relative returns than past performance, and a sub-1% annual fee difference can compound into a terminal wealth gap exceeding $575,000 over 30 years, making the 0.16% MER differential between DHHF and GHHF more consequential than it appears in any single year.
Because borrowing costs move with interest rates, GHHF’s total cost of ownership is inherently unpredictable. Investors comparing the two products on fees alone are seeing less than half the cost picture.
The right choice depends on the investor, not the product.
DHHF may suit investors who:
GHHF may suit investors who:
GHHF is explicitly unsuitable for investors with shorter time horizons, near-term capital needs, or lower risk capacity. It is also unsuitable for anyone attracted primarily by recent headline returns without understanding the rising-market conditions that produced them.
Sequence-of-returns risk is particularly severe in a geared structure. Investors who enter near a market peak or who need to exit during a downturn face the most damaging outcomes, because early large drawdowns permanently reduce the compounding base. Even strong subsequent returns cannot fully recover what gearing destroys in a badly timed entry or exit.
For investors who want to model how this plays out in practice, our deep-dive into sequencing risk and superannuation examines how the ASX 200 took approximately 11 years to reclaim its GFC peak, quantifies the cumulative opportunity cost of that recovery window on a $500,000 portfolio, and outlines flexible drawdown strategies that can protect a retirement balance from the compounding damage that a badly timed entry or exit produces.
Betashares rates DHHF as high risk and GHHF as very high risk. The distinction is not marketing language. It reflects a genuine difference in the magnitude of potential losses.
ASIC’s disclosure guidance for geared funds sets out specific obligations for issuers to communicate the risks of leverage, derivatives, and amplified loss scenarios to retail investors, the regulatory framework within which Betashares must present GHHF’s risk profile and product documentation.
The comparison between DHHF and GHHF reduces to a single variable: gearing. Same underlying portfolio. Same passive, all-equity philosophy. Meaningfully different risk levels, higher costs for GHHF, a limited track record of approximately two years, and return figures that require careful contextualisation against the market environment that produced them.
DHHF is not a safe alternative to GHHF. It is a high-risk product in its own right. The comparison is between high and very high risk, and the space between them is defined by genuine differences in an investor’s capacity to absorb amplified losses, not merely a preference for higher returns.
GHHF is only appropriate for investors who understand and accept that gearing amplifies losses as readily as it amplifies gains.
Investors considering either product should review current Betashares factsheets and Product Disclosure Statements before making any allocation decision.
This article is for informational purposes only and should not be considered financial advice. Investors should conduct their own research and consult with financial professionals before making investment decisions. Past performance does not guarantee future results. Financial projections are subject to market conditions and various risk factors.
DHHF is an unleveraged all-equity ETF providing 100% exposure across approximately 8,000 global securities, while GHHF uses the same underlying portfolio but borrows internally at a 30-40% loan-to-value ratio to produce an effective market exposure of roughly 1.4x-1.5x.
Because the debt in GHHF does not shrink when markets fall, a 25% market decline can translate into approximately a 38% loss on investor equity, and the fund must then sell assets at depressed prices to restore its target gearing range, locking in losses that an unleveraged investor would simply sit through.
DHHF charges a management fee of 0.19% per annum, while GHHF charges 0.35% per annum plus variable borrowing costs that are not captured in the headline MER, making the true cost gap between the two funds wider than the fee figures alone suggest.
GHHF launched in April 2024 and has approximately two years of performance history, all recorded in a broadly rising market environment; its three-year and five-year figures will not be available until 2027 and 2029 respectively, making any full-cycle performance comparison impossible at this stage.
Betashares recommends a minimum time horizon of seven or more years for GHHF investors, reflecting the heightened risk that gearing introduces, particularly the sequence-of-returns risk faced by investors who may need to exit during a market downturn.