
How the IPO Allocation Process Squeezed SpaceX Retail Investors
1 hr ago

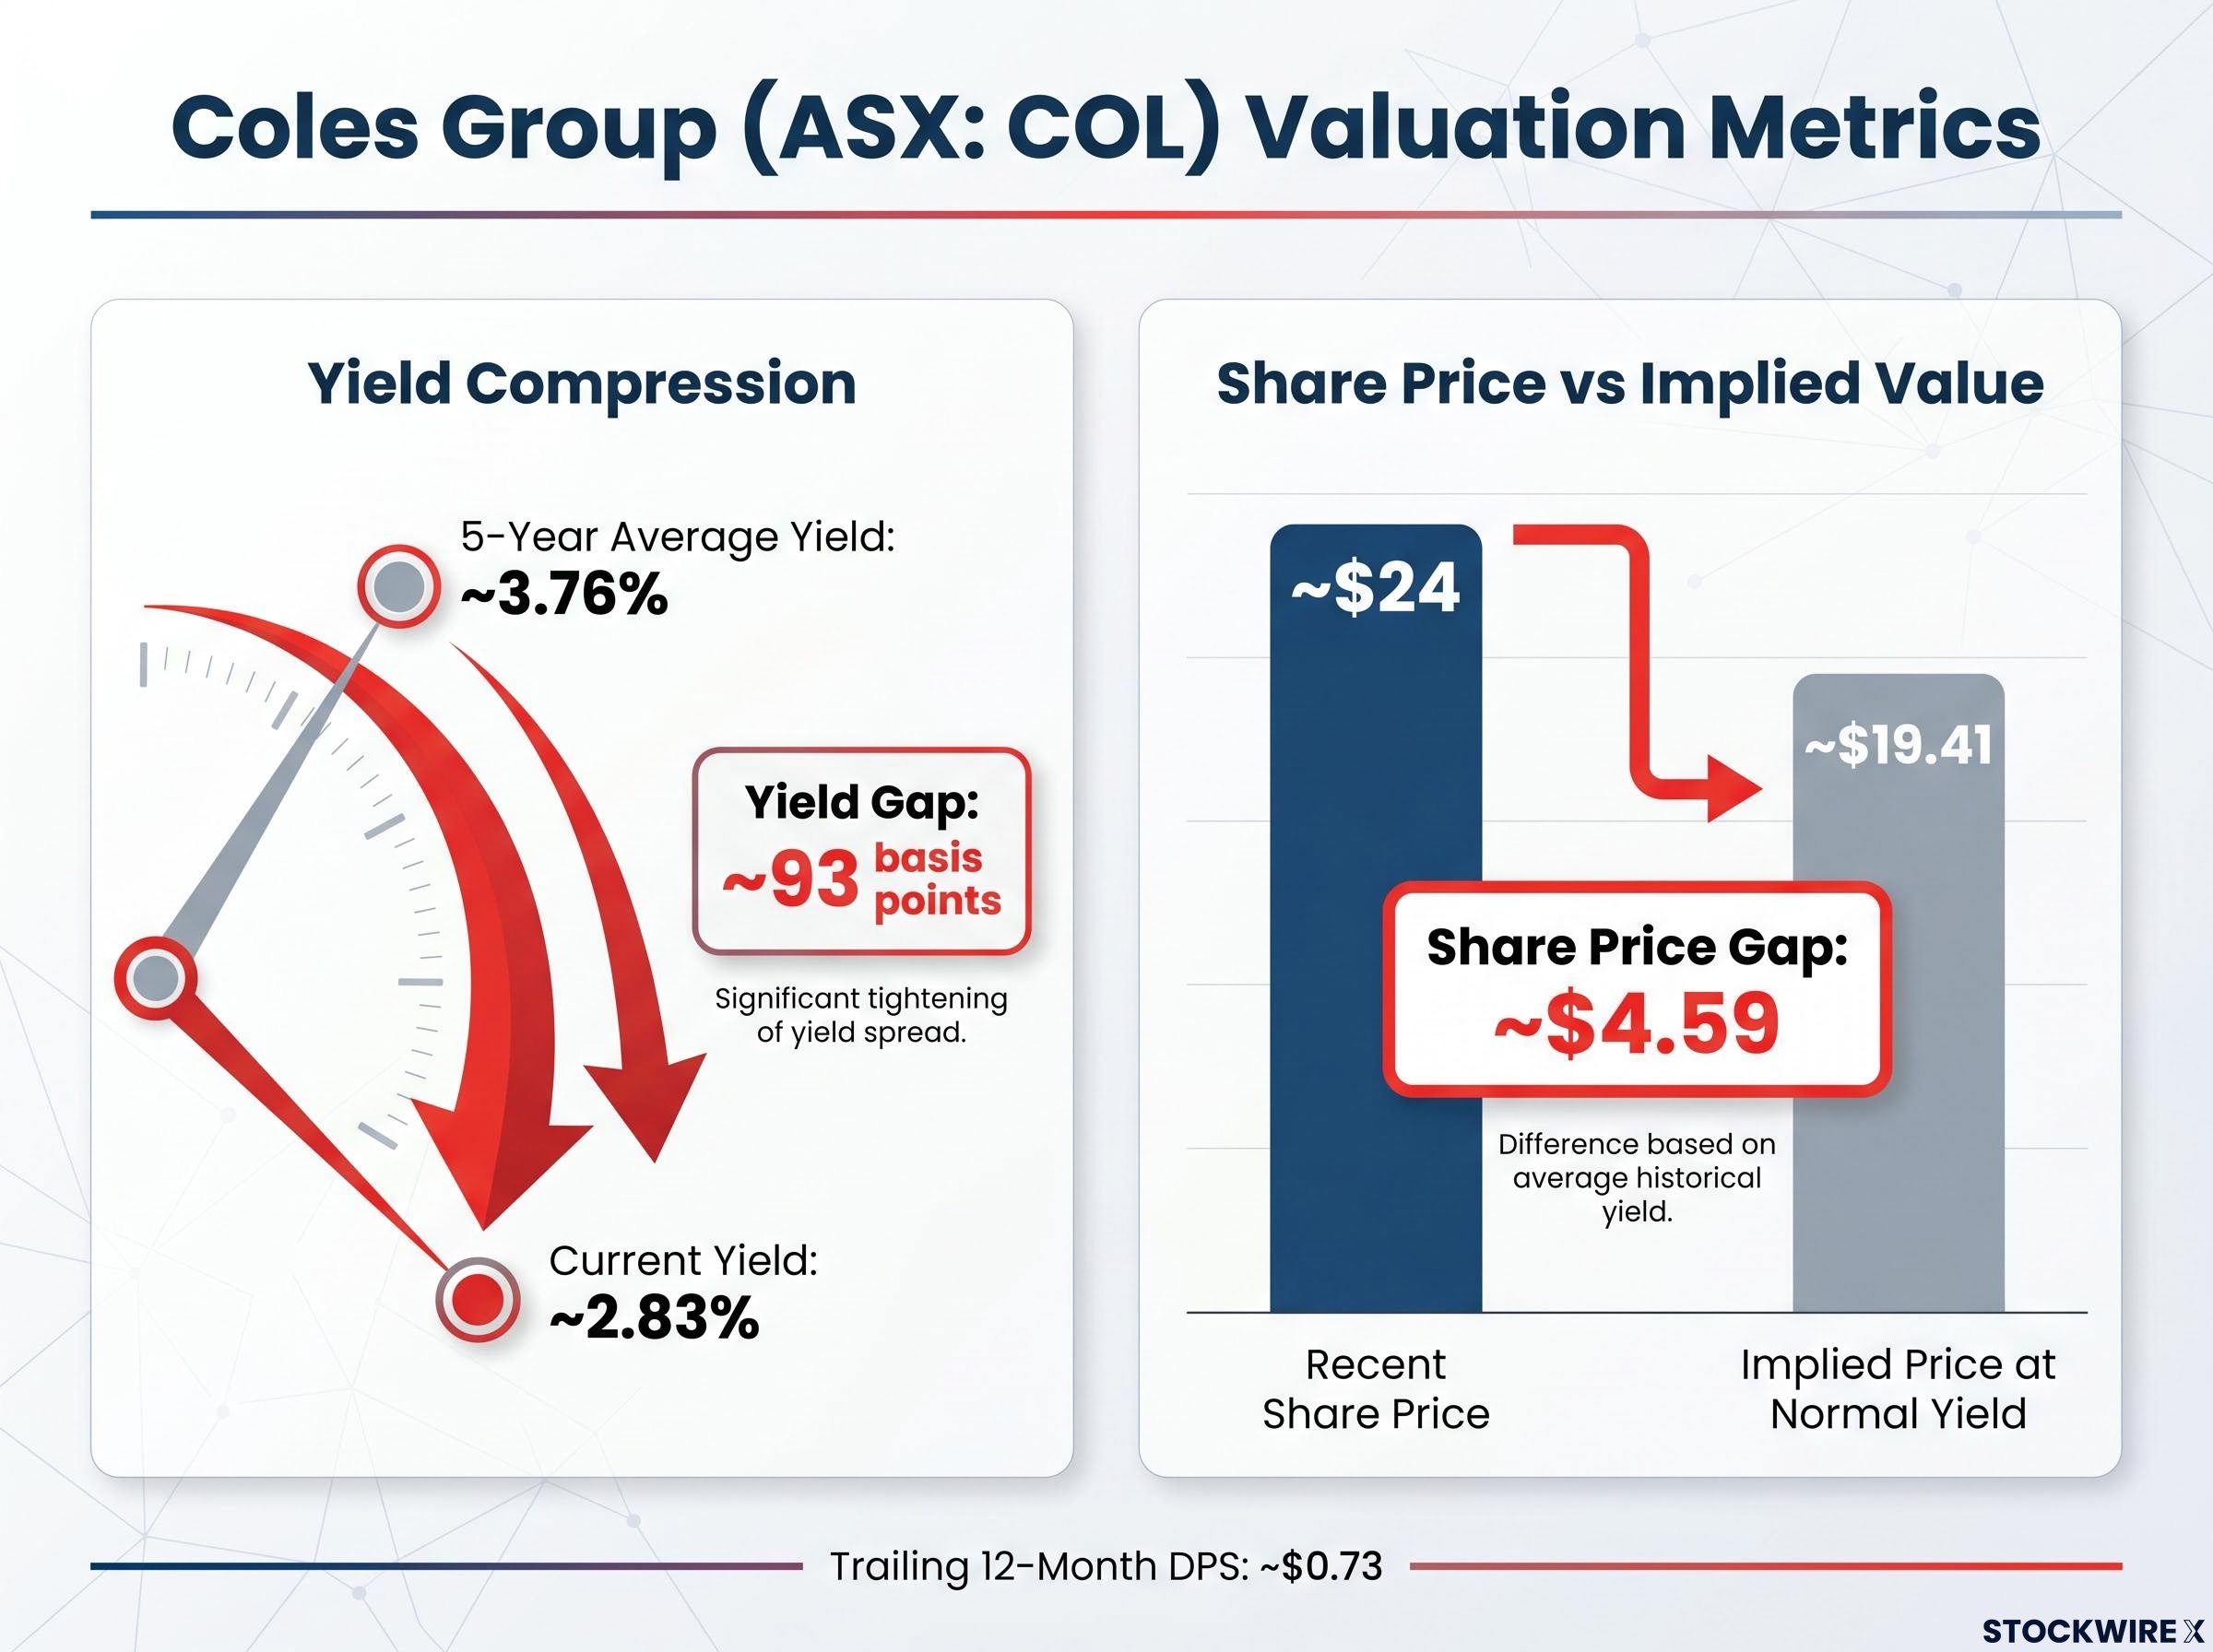
Coles Group (ASX: COL) is currently yielding approximately 2.83%, nearly a full percentage point below its five-year historical average of 3.76%. For income-focused investors, that gap raises a direct question: is the stock expensive, or has the business simply improved? Dividend yield is one of the most widely used and widely misunderstood metrics in Australian retail investing. It is intuitive, quick to calculate, and appears on almost every broker platform. Used without context, however, it leads investors to draw conclusions the data does not support. This guide explains how dividend yield works as a valuation signal, walks through the Coles example with concrete numbers, identifies the specific conditions under which yield-based analysis breaks down, and introduces the more rigorous tools, Discounted Cash Flow (DCF) and Dividend Discount Models (DDM), that should follow any yield-based screen.
The formula itself is disarmingly simple.
Dividend Yield = (Annual Dividends Per Share ÷ Current Share Price) × 100
A stock paying $0.50 per share annually and trading at $10 has a 5% yield. That number tells an investor how much cash income each dollar invested is generating right now. Where the formula becomes misleading is in what it conceals.
Yield moves in two directions, but for two very different reasons:
Without knowing which side of the fraction moved, the number alone is ambiguous. A 6% yield could signal deep value or a business in decline.
One Australian-specific consideration: local investors typically evaluate grossed-up yields that include franking credits, which can materially increase the effective income return. Franking does not change the underlying mechanics, though. The same ambiguity about what drove the yield applies whether the investor is looking at the headline figure or the grossed-up equivalent.
One Australian-specific layer adds further complexity: franking credit mechanics can make a fully franked dividend worth materially more than its headline cash amount for investors in lower tax brackets, including superannuation funds and retirees who can receive excess credits as a direct refund from the ATO, effectively boosting the real income return well above what the stated yield implies.
The ATO guidance on franking credits outlines how the imputation system works for individual investors, including the holding period rule that must be satisfied before a shareholder can claim a franking credit offset against their tax liability, a condition that affects the effective after-tax income return for Australian shareholders evaluating grossed-up yields.
Coles Group is an Australian supermarket business commanding approximately 28% of the domestic grocery market. Separately listed on the ASX since 2018 following its demerger from Wesfarmers, Coles has developed a reputation for consistent dividend distributions, making it a natural candidate for yield-based analysis.
The core yield gap tells the initial story. Coles’ current yield of approximately 2.83% sits roughly 93 basis points below its five-year historical average of approximately 3.76%. On a trailing twelve-month basis, Coles has distributed approximately $0.73 per share, with the share price recently near $24, sitting 19.5% above its 52-week low.
| Metric | Value |
|---|---|
| Current dividend yield | ~2.83% |
| Five-year average yield | ~3.76% |
| Yield gap | ~93 basis points |
| Trailing twelve-month DPS | ~$0.73 |
| Recent share price | ~$24 |
| Share price vs 52-week low | 19.5% above |
Those figures can be turned into a simple implied fair value estimate. The formula works as follows:
Implied Price at Normal Yield = Current DPS ÷ Five-Year Average Yield
Dividing $0.73 by 0.0376 produces an implied price of approximately $19.41. The actual share price near $24 sits materially above that figure, a gap of roughly $4.59 per share. Under the yield-reversion framework, this suggests Coles is trading at a premium relative to its own history. Investors are receiving less income per dollar invested today than they typically received over the past five years.
That is a signal, not a verdict. What follows is the context that determines whether the signal holds.
Each of the following limitations maps to a mistake investors regularly make when treating yield as a standalone valuation tool.
A yield trap occurs when a stock’s yield rises because the share price is falling in anticipation of a dividend cut. The yield appears generous right up until the dividend is reduced or eliminated, at which point both income and capital are lost.
Dividend trap identification is especially difficult on the ASX because the franking credit system can shift investor attention toward gross yield and away from payout sustainability, creating conditions where a position is held far longer than the underlying fundamentals justify.
Yield-reversion analysis asks: “Is this stock expensive or cheap relative to its own history?” DCF and DDM ask a fundamentally different question: “What is this business actually worth?” That shift in framing is the upgrade.
DCF values a business by estimating all future free cash flows and discounting them back to the present using a required rate of return. The process follows four steps: forecast free cash flows over a finite period (typically five to ten years), estimate a terminal value for cash flows beyond that horizon, discount all cash flows to present value using a discount rate reflecting risk, and divide by shares on issue to arrive at a value per share.
For Coles specifically, the model requires taking a view on variables that dividend yield ignores entirely:
DCF’s advantage is that it forces explicit assumptions about the future. Its limitation is that small changes in the discount rate or growth rate assumptions can shift the output materially. Results should be treated as a range of plausible values, not a single price target.
The DDM is a special case of DCF that uses future dividends as the cash flows. In the Gordon Growth Model, assuming dividends grow at a constant rate in perpetuity:
Intrinsic Value = D₁ ÷ (r – g)
Where D₁ is next year’s expected dividend, r is the required rate of return, and g is the long-term dividend growth rate.
For a mature, stable, dividend-paying business like a major supermarket, this can be a reasonable approximation. The model also reveals a useful relationship: dividend yield plus dividend growth rate approximately equals the long-term return an investor can expect, assuming the valuation multiple stays roughly constant. That makes DDM a secondary check on return expectations as well as a valuation tool.
Both methods share one important caveat. The output is highly sensitive to the gap between r and g. A small change in either assumption can produce a substantially different intrinsic value. The discipline lies in stress-testing those inputs across a range of scenarios rather than relying on a single set of assumptions.
The following sequence is designed to be applied this weekend to a stock already in a portfolio. Each step is anchored to the Coles example to make the framework concrete rather than abstract.
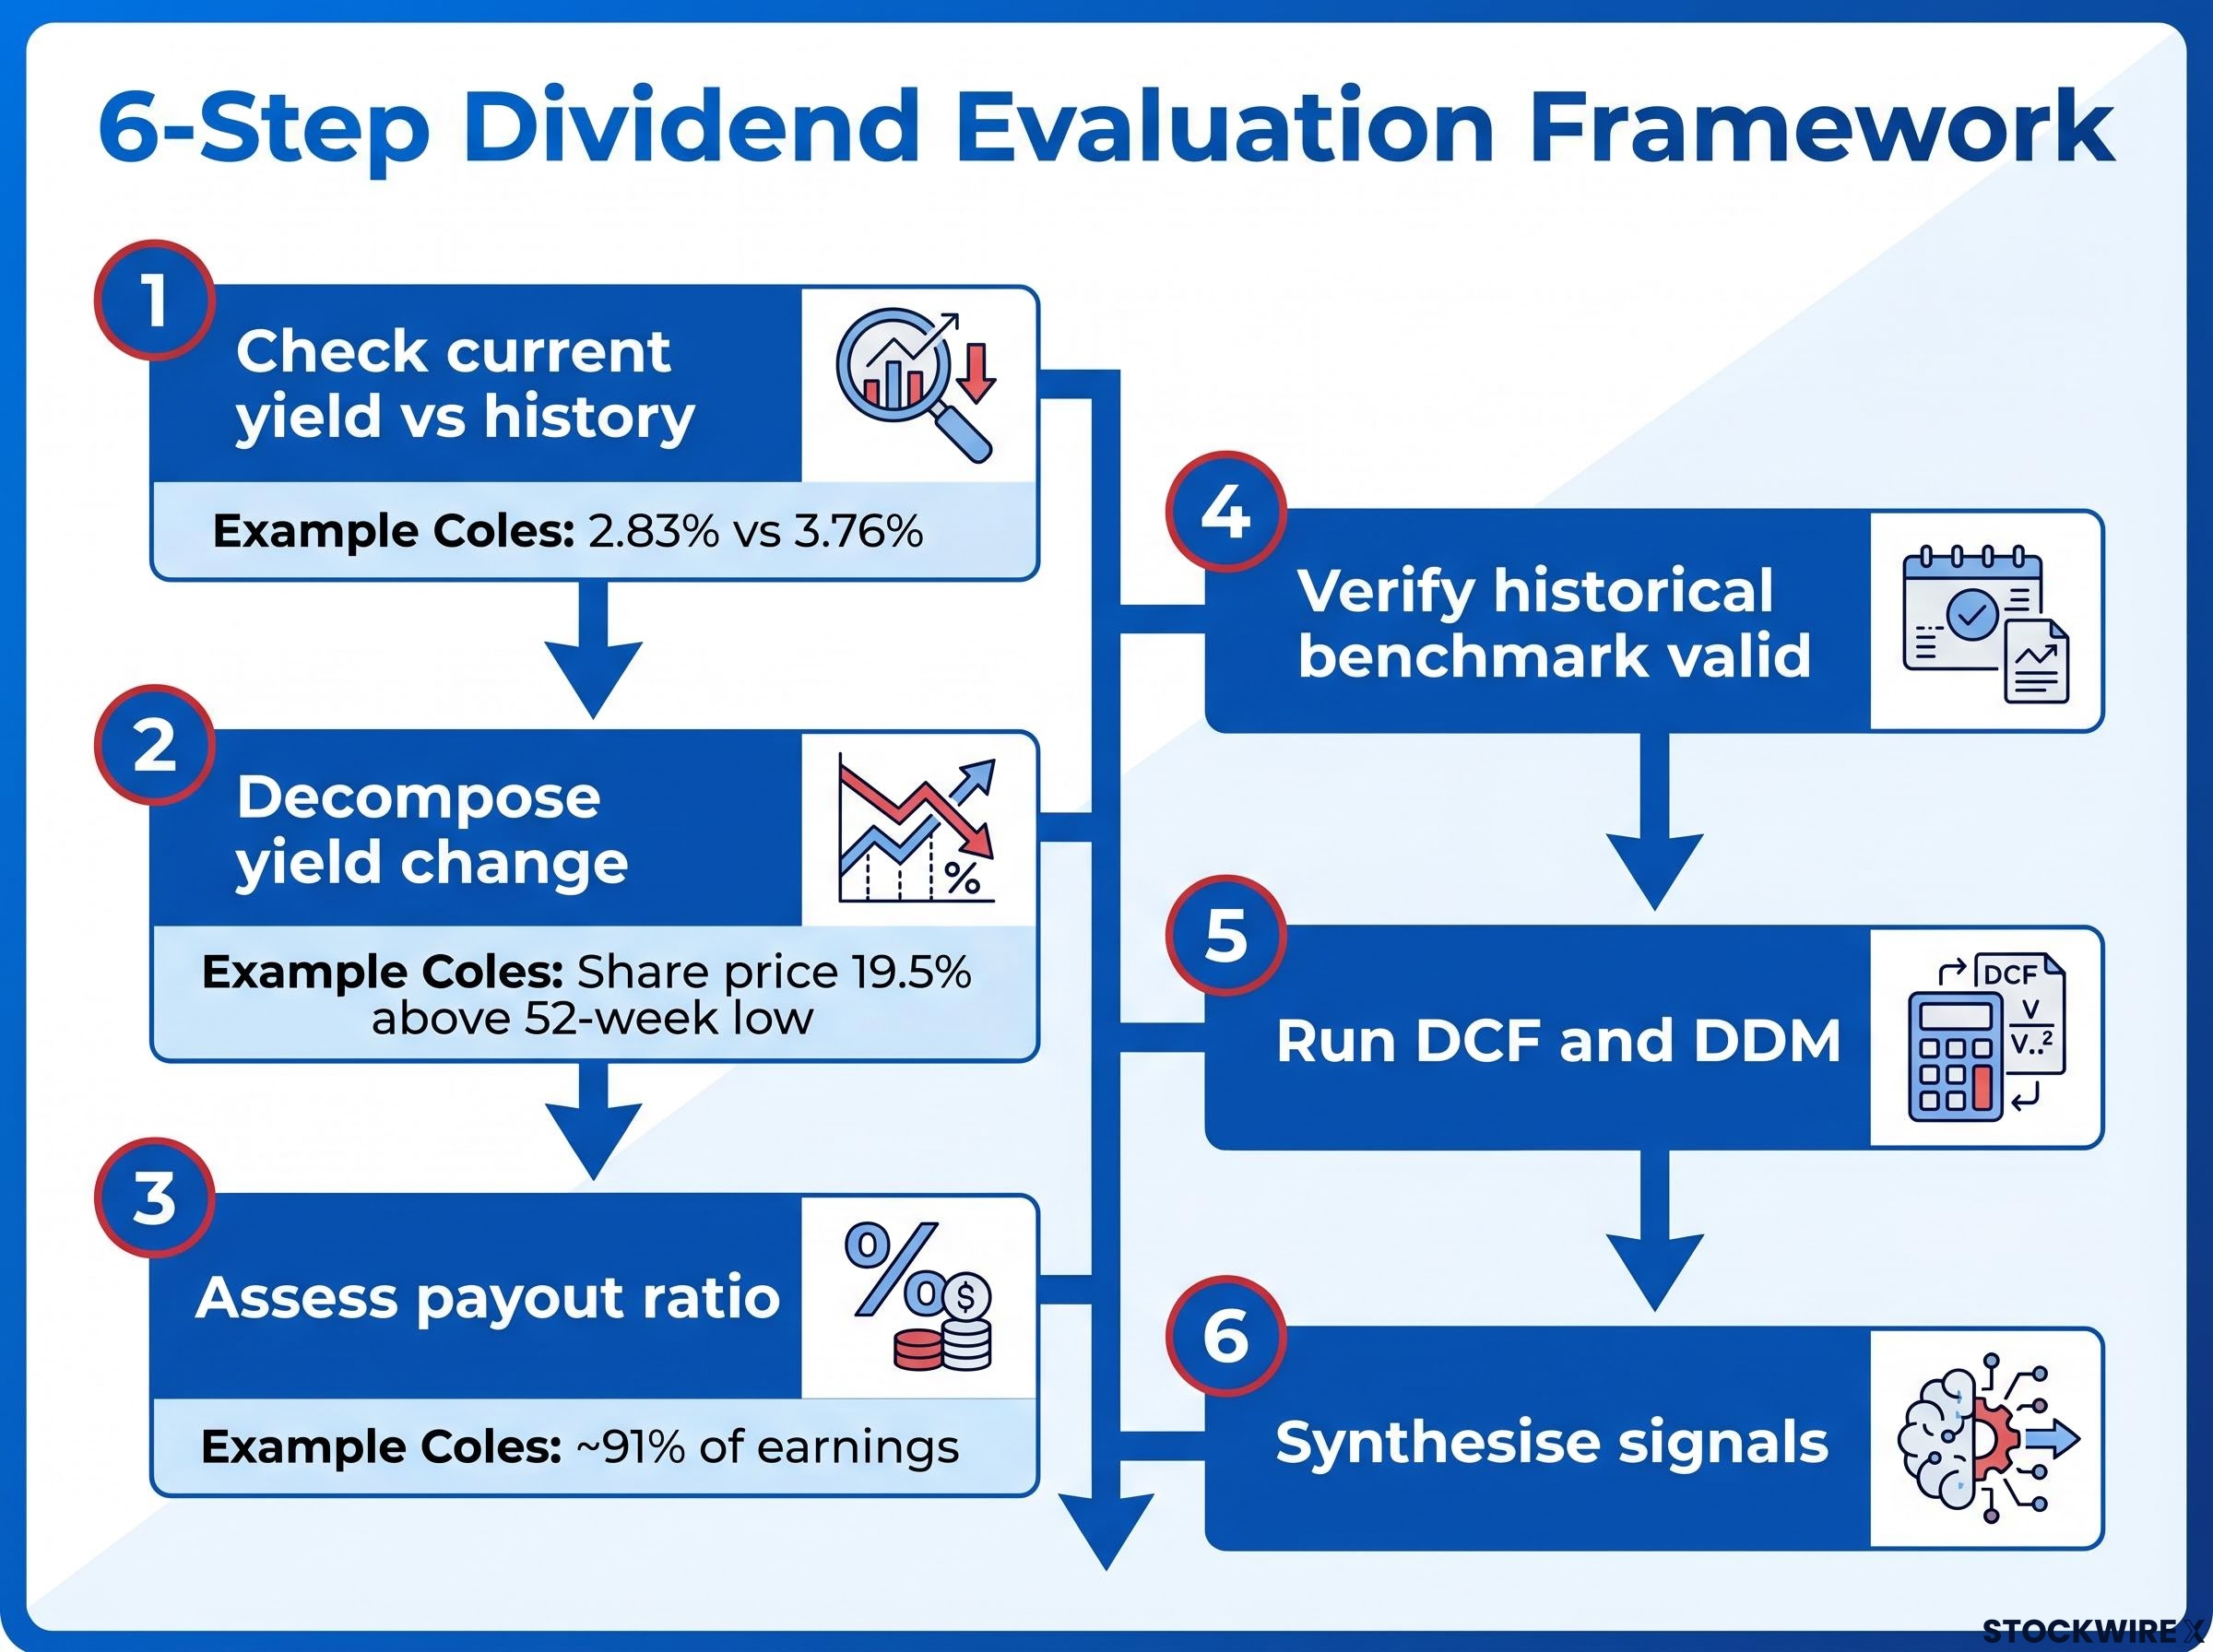
When all three methods, yield-reversion, DCF, and DDM, point in the same direction, the investment case strengthens. When they conflict, the disagreement itself reveals the assumption the investor is implicitly making.
If yield-reversion says “expensive” but DCF says “fairly valued,” the investor is effectively betting on margin expansion or a structural rerating. Making that bet explicit is more valuable than any single price target.
The yield gap of approximately 93 basis points below the five-year average is a clear premium signal under the yield-reversion framework. Whether that premium is justified depends on questions the yield number cannot answer.
The open questions investors must resolve before drawing a conclusion include:
The Coles and Woolworths valuation divergence that emerged through 2025 offers a concrete illustration of how genuine earnings differences, rather than sentiment, can drive peer stocks in opposite directions: Coles reported supermarkets EBIT growth of 14.6% in H1 FY2026 while Woolworths delivered only a partial recovery from a depressed prior-year base, a gap that makes yield comparison between the two names particularly unreliable without earnings context.
The yield number alone cannot resolve any of these. What it can do, and what this guide has demonstrated, is flag the right questions. The hierarchy matters: yield is a useful first filter, not a final answer. The discipline of moving from yield to payout coverage to intrinsic value modelling is what separates informed income investing from yield-chasing.
Dividend yield remains a fast, accessible signal that flags potential over- or under-pricing relative to a stock’s own history. It belongs in every income investor’s toolkit, but never as the sole tool. Used without context from payout analysis, business fundamentals, and intrinsic value modelling, it cannot support an investment decision.
The Coles example offers a repeatable template. Calculate the yield gap, decompose what caused it, check the payout ratio, and run a DCF or DDM before reaching a conclusion. Apply that same sequence to the next ASX dividend stock under consideration, and the one after that.
Investors who build this habit across multiple positions are building genuine analytical literacy, not simply collecting income.
For investors applying this framework with a specific retirement income target in mind, our dedicated guide to living off dividends in Australia works through the capital requirements at different yield levels, how franking credits reduce those targets in pension-phase superannuation, and which portfolio structures maximise after-tax income across different account types.
This article is for informational purposes only and should not be considered financial advice. Past performance does not guarantee future results. Investors should conduct their own research and consult with financial professionals before making investment decisions.
Dividend yield valuation compares a stock's current yield to its historical average to identify whether the stock appears expensive or cheap relative to its own income history. A yield materially below the historical average can signal a price premium, while a yield above average may indicate undervaluation or a deteriorating business.
Coles' current yield of approximately 2.83% sits about 93 basis points below its five-year average of 3.76% primarily because the share price has risen, sitting around 19.5% above its 52-week low, while dividends have remained relatively stable. This price-driven yield compression implies Coles is trading at a premium under the yield-reversion framework.
A dividend yield trap occurs when a stock's yield rises because the share price is falling in anticipation of a dividend cut, making the yield look attractive right up until the payout is reduced or eliminated. Investors can identify potential traps by checking the payout ratio, free cash flow coverage, and whether the share price decline reflects genuine earnings deterioration.
Divide the current annual dividends per share by the stock's five-year average yield to estimate an implied fair value. For Coles, dividing $0.73 in trailing dividends by the 3.76% average yield produces an implied price of approximately $19.41, compared to the actual price near $24.
Investors should use a Dividend Discount Model when they want to estimate a stock's intrinsic value based on expected future dividends rather than comparing to historical yield levels. The DDM is particularly useful for mature, stable dividend payers like major supermarkets, and it also doubles as a check on long-term return expectations by combining dividend yield with projected dividend growth.


