
How to Evaluate Thematic Investments Before the Hype Takes Hold
11 hrs ago

Every stock price contains a hidden assumption. Not a guess, not a forecast from a sell-side analyst, but a mathematical requirement: the minimum annual revenue growth rate a company must sustain for an investor paying today’s price to earn their target return by the time they sell. Most retail investors evaluate stocks using metrics like the price-to-earnings (PE) ratio, which describes only what happened in the past. No standard brokerage platform surfaces the one figure that answers the question any buyer actually needs answered: what must this company achieve to justify what I am paying today? The implied growth rate framework solves that problem directly, using five inputs and arithmetic that any investor can run in a spreadsheet. What follows is a step-by-step walkthrough of why this framework exists, how the calculation works, how to interpret the output, and how to build it into a repeatable pre-purchase routine that translates any stock price into a measurable forward expectation.
When an investor buys a share at its current market price, that price is not a neutral description of a company’s worth. It is a claim about the future. Specifically, it encodes a set of assumptions about the rate at which the underlying business must grow for the buyer to earn a satisfactory return over their holding period.
A stock’s current price is not a neutral data point. It is an implicit contract encoding what the company must deliver.
This is what the implied growth rate makes visible. It is the annualised revenue growth rate a company must achieve for an investor paying today’s price to hit their return target, and it is distinct from analyst forecasts or management guidance. Those are opinions about what a company might do. The implied growth rate is a statement about what the price is already requiring.
The relationship between price and forward expectations also explains why stocks can fall sharply on record quarterly profits: when a price already encodes a demanding growth trajectory, even strong absolute results can disappoint if they fall short of what was implicitly required, a dynamic that becomes visible only to investors who have first translated the share price into a specific forward demand.
The distinction matters because a stock’s price can be demanding something the company has never achieved, and the investor will not know that without running the calculation. Institutional investors routinely perform this type of analysis before capital allocation decisions. Retail investors, by contrast, are typically presented with price, PE ratio, and chart history on standard brokerage platforms. None of those figures communicate what the price is requiring of future performance. The implied growth rate fills that gap, converting the price into a testable hypothesis about business execution.
The calculation requires five inputs, each chosen for a specific reason. Three describe the company as it stands today and the market it operates in. Two are set by the investor based on their own return expectations.
| Input | Symbol | Baseline or illustrative value |
|---|---|---|
| Current market capitalisation | MC₀ | Company-specific |
| Trailing 12-month revenue | Rev₀ | Company-specific |
| Desired annual return rate | r | 10% (approximate long-run index fund performance) |
| Investment time horizon | T | 10 years |
| Exit price-to-sales multiple at maturity | M_exit | ~8x established tech; ~5x large pharma; ~1.5x mature retail |
The investor sets the return target and exit multiple rather than deriving them from the market. This is deliberate. It means the framework answers “what does the price demand given my requirements?” rather than “what does the market think?”
The four calculation steps follow in sequence, each output feeding directly into the next input:
Consider a company with a $100 billion market cap and $20 billion in trailing 12-month revenue.
Step 1: A 10% annual return over 10 years requires the market cap to reach approximately $259 billion ($100 billion x 1.10^10).
Step 2: Using a 5x exit price-to-sales multiple (appropriate for a large pharmaceutical or diversified technology company at maturity), the company must generate approximately $51.8 billion in annual revenue at the point of sale.
Step 3: Growing from $20 billion to $51.8 billion over 10 years implies a revenue CAGR of approximately 9.5% per year.
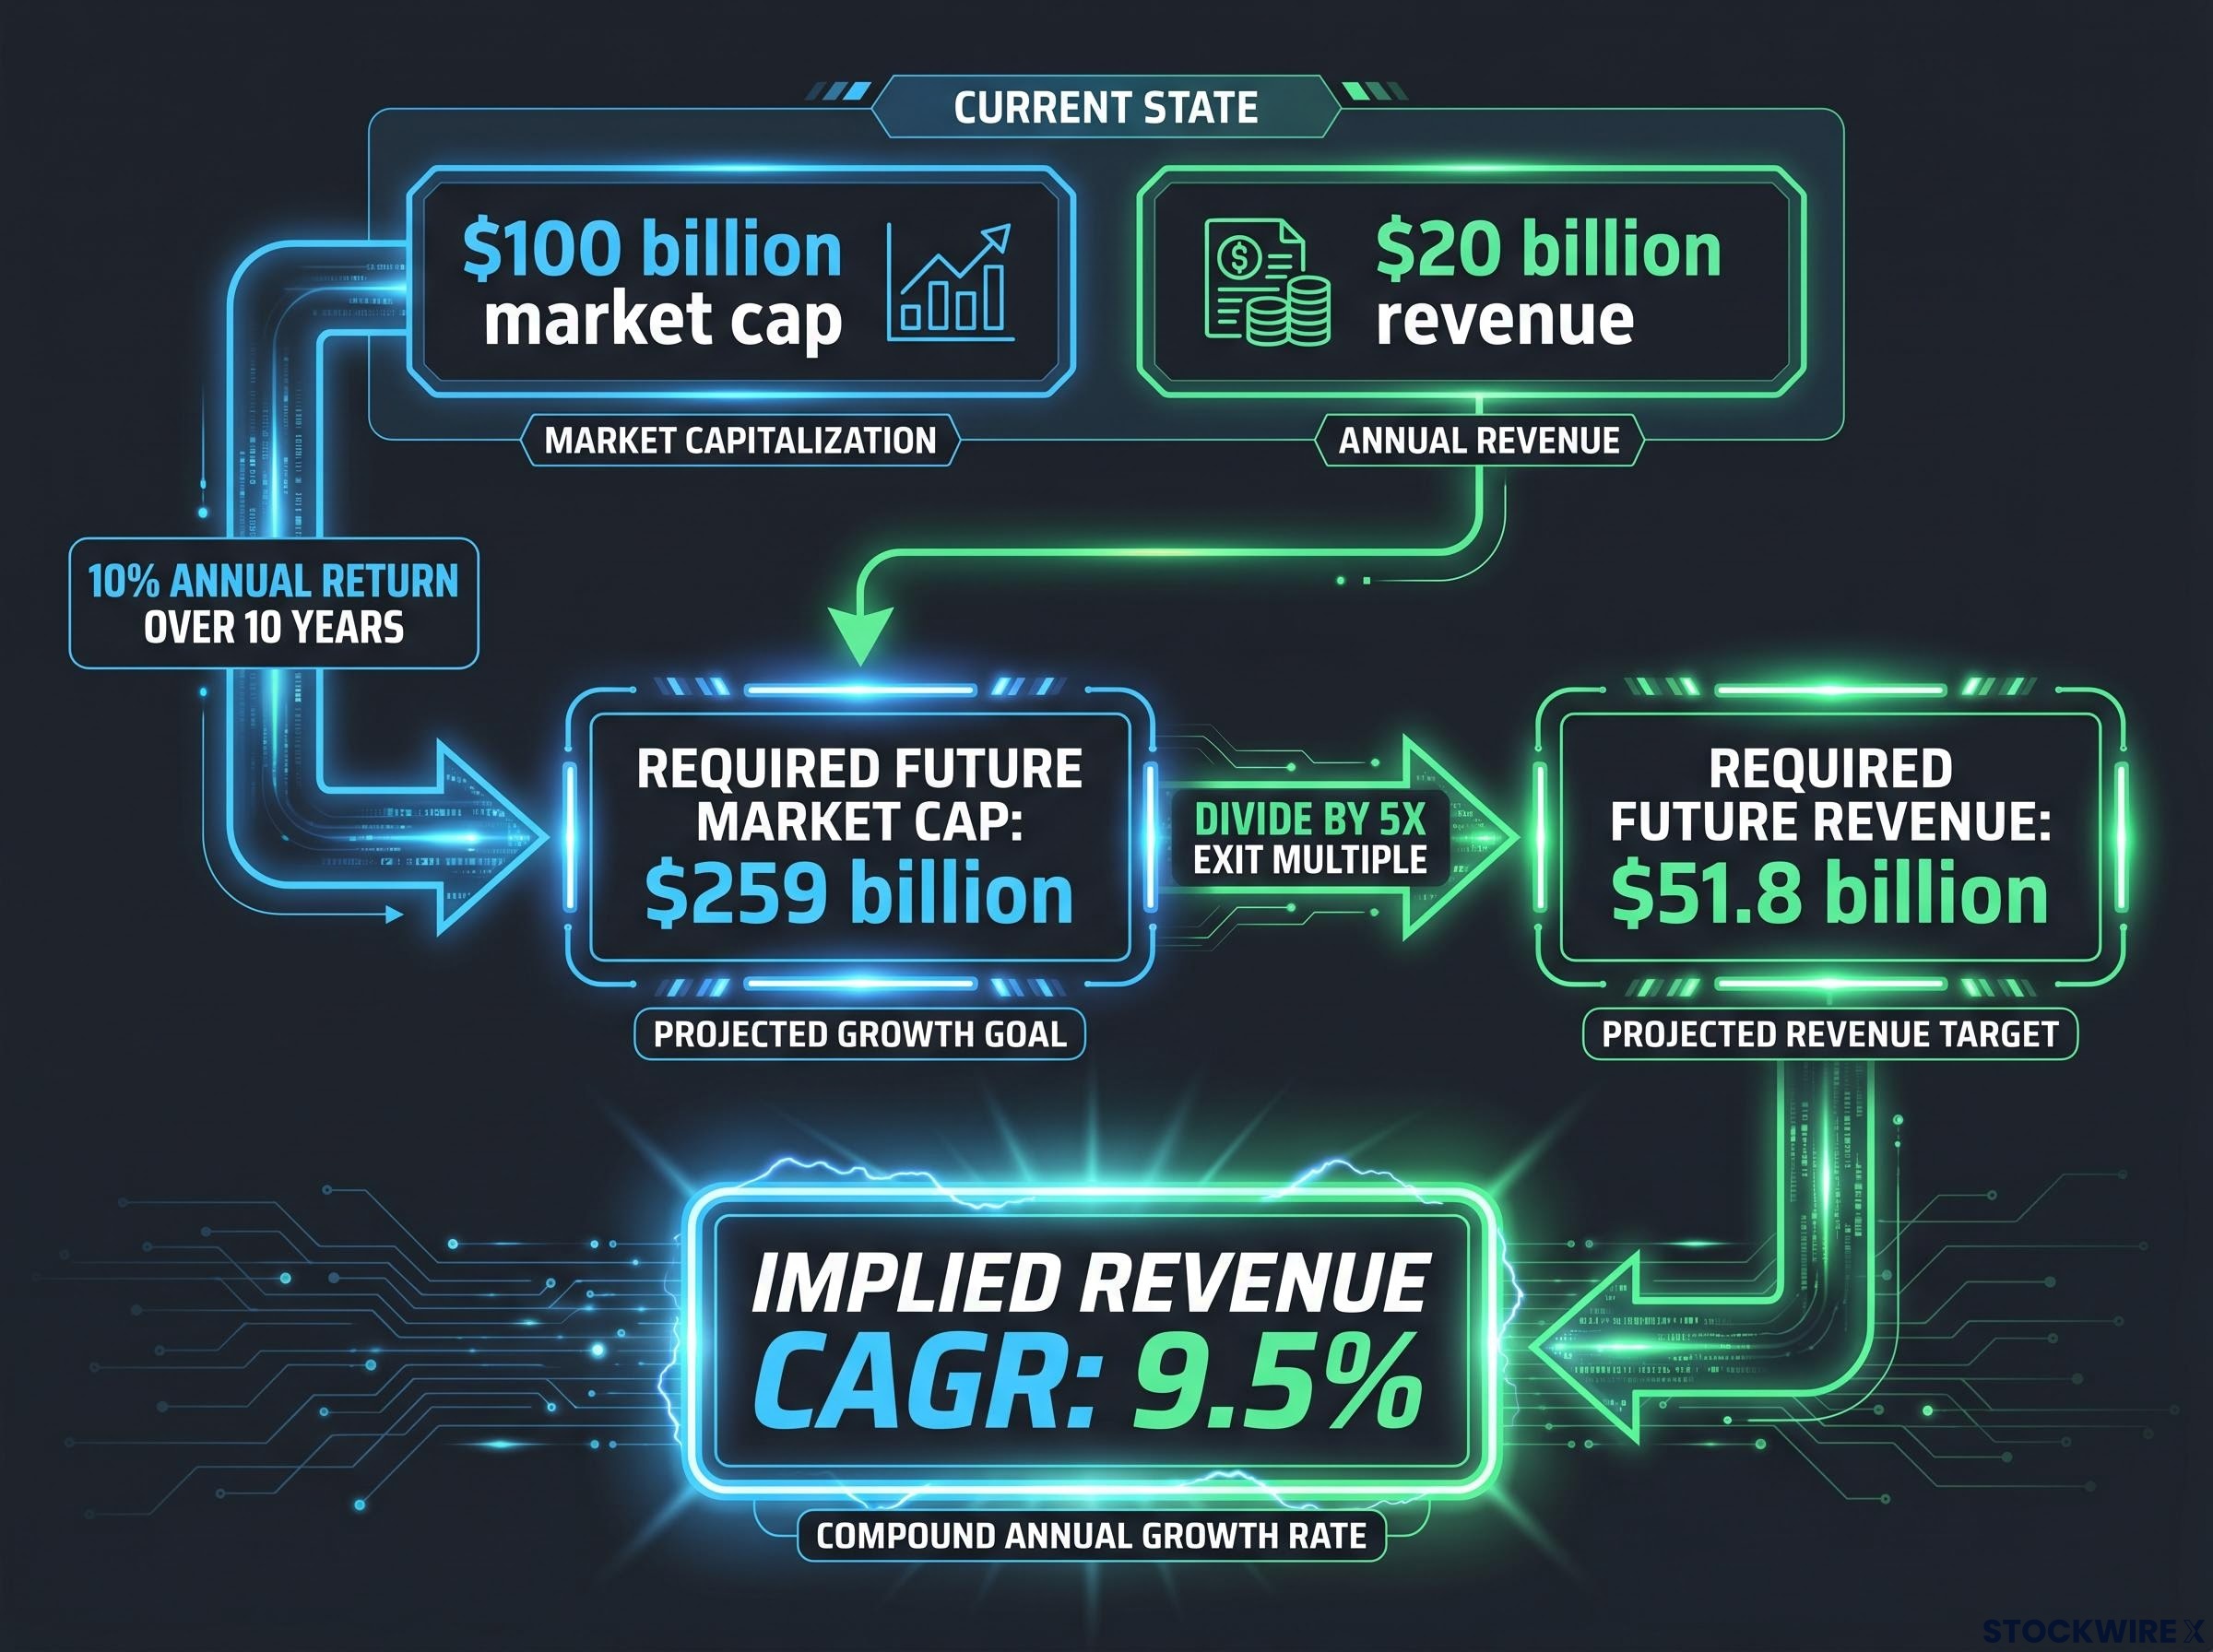
Step 4: Is 9.5% annual revenue growth for a decade feasible? That depends entirely on what this company has done historically, what it is doing now, and how large its addressable market is.
At a $100 billion market cap, $20 billion in revenue, and a 5x exit multiple, the price is demanding approximately 9.5% annual revenue growth for a decade.
The PE ratio tells investors what they are paying relative to last year’s earnings. It is a backwards-looking snapshot, and it is silent on the question that matters most before a purchase: what must this company achieve going forward?
The stock valuation metrics most widely cited on retail brokerage platforms, led by the price-to-earnings ratio, share a common structural problem: they describe a company’s past rather than specifying what the current price is demanding of its future, a distinction that becomes critical the moment an investor commits capital.
Three specific failure modes illustrate where PE analysis stops being useful:
Columbia Business School research on implied cost of capital identifies systematic deficiencies in how accounting-based valuation models handle expected earnings growth, reinforcing why a revenue-anchored framework produces more reliable forward expectations than earnings-derived metrics alone.
Revenue is harder to manipulate than earnings, available for pre-profit companies, and provides a clean basis for a terminal price-to-sales multiple. Johnson & Johnson trades at roughly 5.8x trailing revenue, illustrating how price-to-sales can anchor a revenue-based calculation even for large-cap, mature businesses.
This is why institutional exit-multiple analysis typically anchors to revenue multiples at a projected maturity point. The implied growth rate framework uses revenue because it works across all publicly listed companies regardless of profitability, avoiding the accounting noise that makes PE-based methods unreliable for a significant portion of the investable universe.
The implied growth rate’s value lies entirely in what it is compared against, not in its absolute size. An implied CAGR of 15% is neither good nor bad on its own. It is only meaningful when measured against what the specific company, and companies like it, have actually achieved.
Three classifications frame the comparison:
| Classification | What it signals | Recommended next step |
|---|---|---|
| Reasonable | Implied CAGR approximates past and current growth; plausible relative to addressable market | Shift to qualitative assessment of business quality, competitive position, and execution risk |
| Stretch / Heroic | Implied CAGR is materially above what comparable firms have sustained at similar scale | Assess whether specific, evidence-based reasons support the exceptional outcome; otherwise, flag meaningful downside risk |
| Conservative | Implied CAGR is low relative to current growth trajectory | Investigate potential underpricing; shift to qualitative assessment of sustainability |
The comparison benchmarks are the company’s own 3-year and 5-year historical revenue CAGR, its current growth rate and management guidance, and the relevant industry growth rate and total addressable market.
The framework is neither bearish nor bullish by design. It is a translation mechanism, and the classification is only as good as the benchmarks the investor assembles. A high implied growth rate is not automatically disqualifying. It is a prompt for a specific, evidence-based assessment.
The implied growth rate is not an answer. It is a question: do you have a specific, evidence-based reason to believe this company will achieve what its price demands?
The entire calculation fits into eight columns. Five hold inputs, three hold outputs, and any standard spreadsheet application can run it.
| Column | Input or output | Content |
|---|---|---|
| A | Input | Current market cap (MC₀) |
| B | Input | TTM revenue (Rev₀) |
| C | Input | Required return (r), e.g. 0.10 for 10% |
| D | Input | Years (T), e.g. 10 |
| E | Input | Exit P/S multiple (M_exit) |
| F | Output | Required future market cap |
| G | Output | Required future revenue |
| H | Output | Implied revenue CAGR |
The three output formulas (assuming data starts in row 2) are:
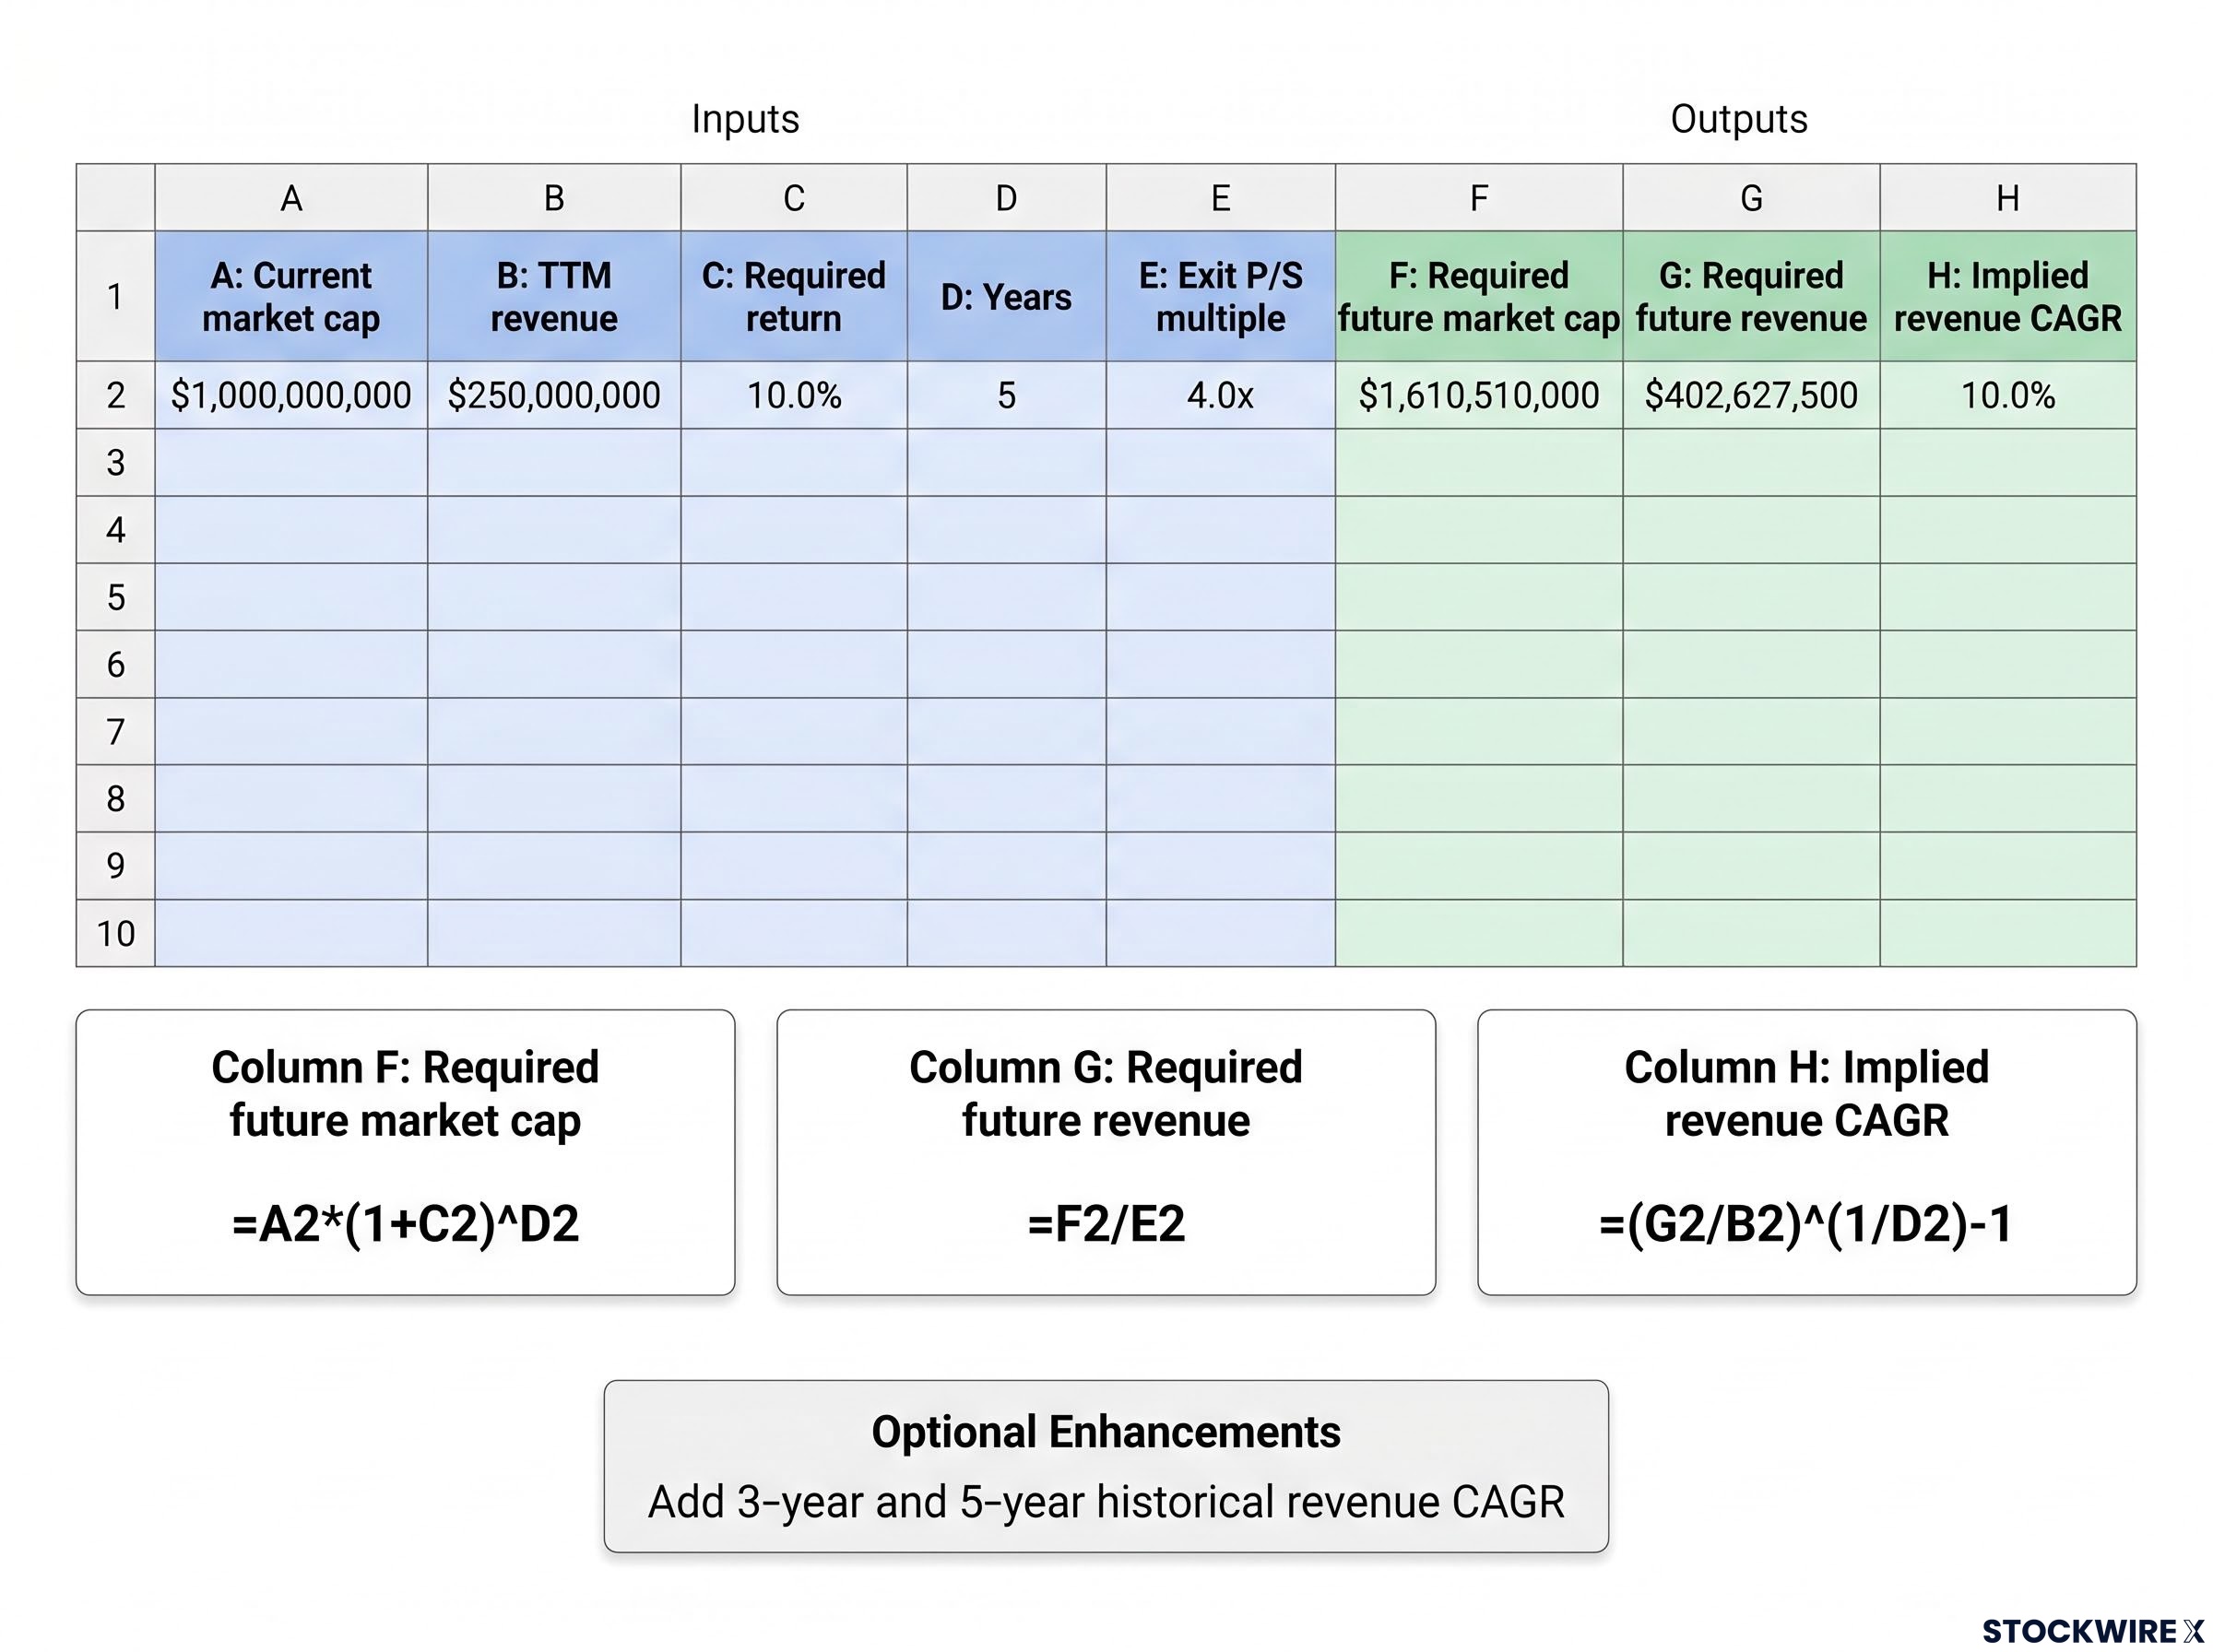
All input data, including current market capitalisation and trailing 12-month revenue, is available on any standard financial data site at no cost.
Two additions turn the basic calculator into a reusable screening tool. First, add columns for the company’s historical 3-year and 5-year revenue CAGR, sourced from public financial data. These provide the comparison benchmarks the classification step requires.
Second, add a classification flag formula. A simple implementation: `=IF(H2<=Historical_5y_CAGR, "Plausible/Conservative", "Stretch")`. This automates the first-pass classification, surfacing a judgement prompt every time the spreadsheet is populated, rather than relying on the investor to remember to make the comparison manually.
Institutional investors have used this type of analysis routinely before capital allocation decisions. The barrier for retail investors has never been analytical complexity. The arithmetic involves five inputs and basic maths. The barrier has been a lack of exposure to the method.
That barrier is now removed. The following six-step pre-purchase checklist integrates the full framework from data gathering through to a final decision:
For investors who want to move from a single implied growth rate output to a full valuation model, our dedicated guide to intrinsic value estimation walks through discounted cash flow construction, terminal value sensitivity, and margin-of-safety thresholds, covering the specific inputs and stress-test approaches that transform a CAGR check into a complete pre-purchase case.
Before buying any stock, ask one question: do I have a specific, evidence-based reason to believe this company can achieve what its price is demanding?
This is not an optional analytical exercise. It is the minimum due diligence a rational buyer performs before any single-stock investment. The calculation takes under ten minutes. The question it answers is worth every second.
Management quality signals, particularly per-share value creation over time, insider ownership alignment, and capital allocation discipline, are among the most important qualitative factors an investor should assess after the implied growth rate calculation classifies a position as Reasonable or Conservative, since a management team credibly compounding intrinsic value per share makes a sustained high-growth trajectory meaningfully more plausible.
This article is for informational purposes only and should not be considered financial advice. Investors should conduct their own research and consult with financial professionals before making investment decisions. Past performance does not guarantee future results. Financial projections are subject to market conditions and various risk factors.
The implied growth rate is the minimum annualised revenue growth rate a company must sustain for an investor paying today's price to earn their target return over a chosen holding period. It translates the current stock price into a specific, testable forward demand rather than relying on analyst forecasts or management guidance.
You need five inputs: current market capitalisation, trailing 12-month revenue, your target annual return, your investment time horizon, and an exit price-to-sales multiple. Multiply the current market cap by your return compounded over the holding period, divide by the exit multiple to get required future revenue, then solve for the annualised growth rate between current and required revenue.
Revenue is harder to manipulate than earnings, is available for pre-profit and early-stage companies, and provides a clean basis for a terminal price-to-sales multiple. This makes the framework applicable across all publicly listed companies regardless of profitability, avoiding the accounting distortions that make earnings-based metrics unreliable for a large portion of the investable universe.
A high implied CAGR is not automatically disqualifying; it is a prompt to assess whether specific, evidence-based reasons support the exceptional outcome the price is demanding. If no concrete evidence exists that the company can sustain that growth rate, the price is signalling meaningful downside risk.
The PE ratio is a backwards-looking snapshot of what investors paid relative to last year's earnings, and it says nothing about what the current price requires of future performance. The implied growth rate framework is forward-looking, converting today's price into a specific annual revenue growth target the company must hit for the investor to achieve their return.