
Most investors who encounter a listed property funds manager for the first time reach for the wrong lens. They evaluate it like a developer or a REIT, get confused by the numbers, and move on. The confusion is structural, not analytical. Australia’s ASX hosts a small but growing cohort of listed property funds managers, including Qualitas (ASX: QAL), Elanor Investors Group (ASX: ENN), and Charter Hall (ASX: CHC) at earlier growth stages, that generate revenue not from selling apartments or collecting rent directly, but from managing other people’s capital. The distinction matters enormously to how an investor reads the financials, what metrics to track, and how to assess whether the business is actually growing. What follows is a clear, reusable framework for understanding how listed property funds managers generate revenue, why analysts focus on funds under management (FUM) rather than gross development value (GDV), and how to assess a platform at an early stage of building its business.
The structural difference between a funds manager and a developer
A property developer buys land on its own balance sheet, borrows to fund construction, and earns a development margin when completed product sells above total cost. The developer wears the full risk of cost blowouts, delays, and market moves.
A listed property funds manager operates on a fundamentally different model. The assets sit in separate fund or trust vehicles, not on the manager’s own balance sheet. The manager’s role is to raise capital from investors into those fund structures, then manage that capital according to a mandate covering acquisitions, development oversight, leasing, and sales. It does not deploy its own capital to fund construction; it engages developers or service providers to deliver physical work within the fund, while it earns fees for structuring and managing the investment.
The separation of assets into fund vehicles rather than onto the manager’s balance sheet is a foundational feature of managed fund structures in Australia, where investors receive units representing proportional stakes in a pooled asset pool rather than direct ownership of the underlying property.
ASIC Regulatory Guide 134 sets out the legal requirements for the constitutions of registered managed investment schemes in Australia, establishing the framework within which listed property funds managers must structure their fund vehicles and operate their mandates under the Corporations Act.

| Concept | Property Developer | Listed Property Funds Manager |
|---|---|---|
| Main revenue source | Development margin on projects | Fees on FUM (base), deal/project fees, performance fees |
| Balance sheet risk | Owns land, takes construction and market risk | Light balance sheet; risk sits in funds, not the manager |
| Key metric | GDV, cost-to-complete, margins | FUM, fee revenue, FUM growth, fee margins |
| Revenue pattern | Highly cyclical and project-based | More stable once FUM is established; still sensitive to markets |
| Key execution risks | Cost blowouts, sales pace, financing | Capital raising failure, project delays in funds, fee compression |
“As a shareholder in a listed manager, you are buying a fee-based asset management business that happens to specialise in real estate, not a traditional property developer.”
Getting this distinction right at the outset makes every subsequent question about revenue, valuation, and risk immediately clearer.
When big ASX news breaks, our subscribers know first
What FUM actually measures and why GDV cannot replace it
A large GDV headline number in an ASX announcement can look impressive. It signals the total end value of projects a manager’s funds may undertake. The instinct is to treat that number as a measure of the manager’s revenue potential. That instinct is wrong.
FUM refers specifically to the capital already committed by investors and under management within fund structures. It is the revenue denominator for the listed manager because base management fees are calculated as a percentage of FUM. GDV, by contrast, is a leading indicator of potential future deal flow and the scale of projects funds may pursue. It is not itself a standard valuation input for the manager.
“No capital raised, no FUM; no FUM, no management fee. GDV shows the pipeline; FUM shows the engine.”
The chain of dependency works in three steps:
- Capital is raised from investors into a fund structure
- FUM is established as committed capital under management
- Base management fees begin flowing as a percentage of that FUM
Underlying property values and development margins belong to fund investors, not to the listed manager, except to the extent the manager earns performance fees on profits exceeding the hurdle. For Australian retail investors who regularly encounter GDV figures in ASX announcements, understanding exactly what GDV does and does not reveal about the manager’s revenue prevents systematic overestimation of near-term earnings.
How the fee model is structured across the fund lifecycle
Fee structures vary by manager and strategy, but most listed property funds managers earn across three broad categories. Each fee type exists because the manager adds value at a specific stage of the fund lifecycle. Understanding where a fee sits in that lifecycle tells an investor how predictable it is, how quickly it can scale, and how to weight near-term versus long-term earnings potential.
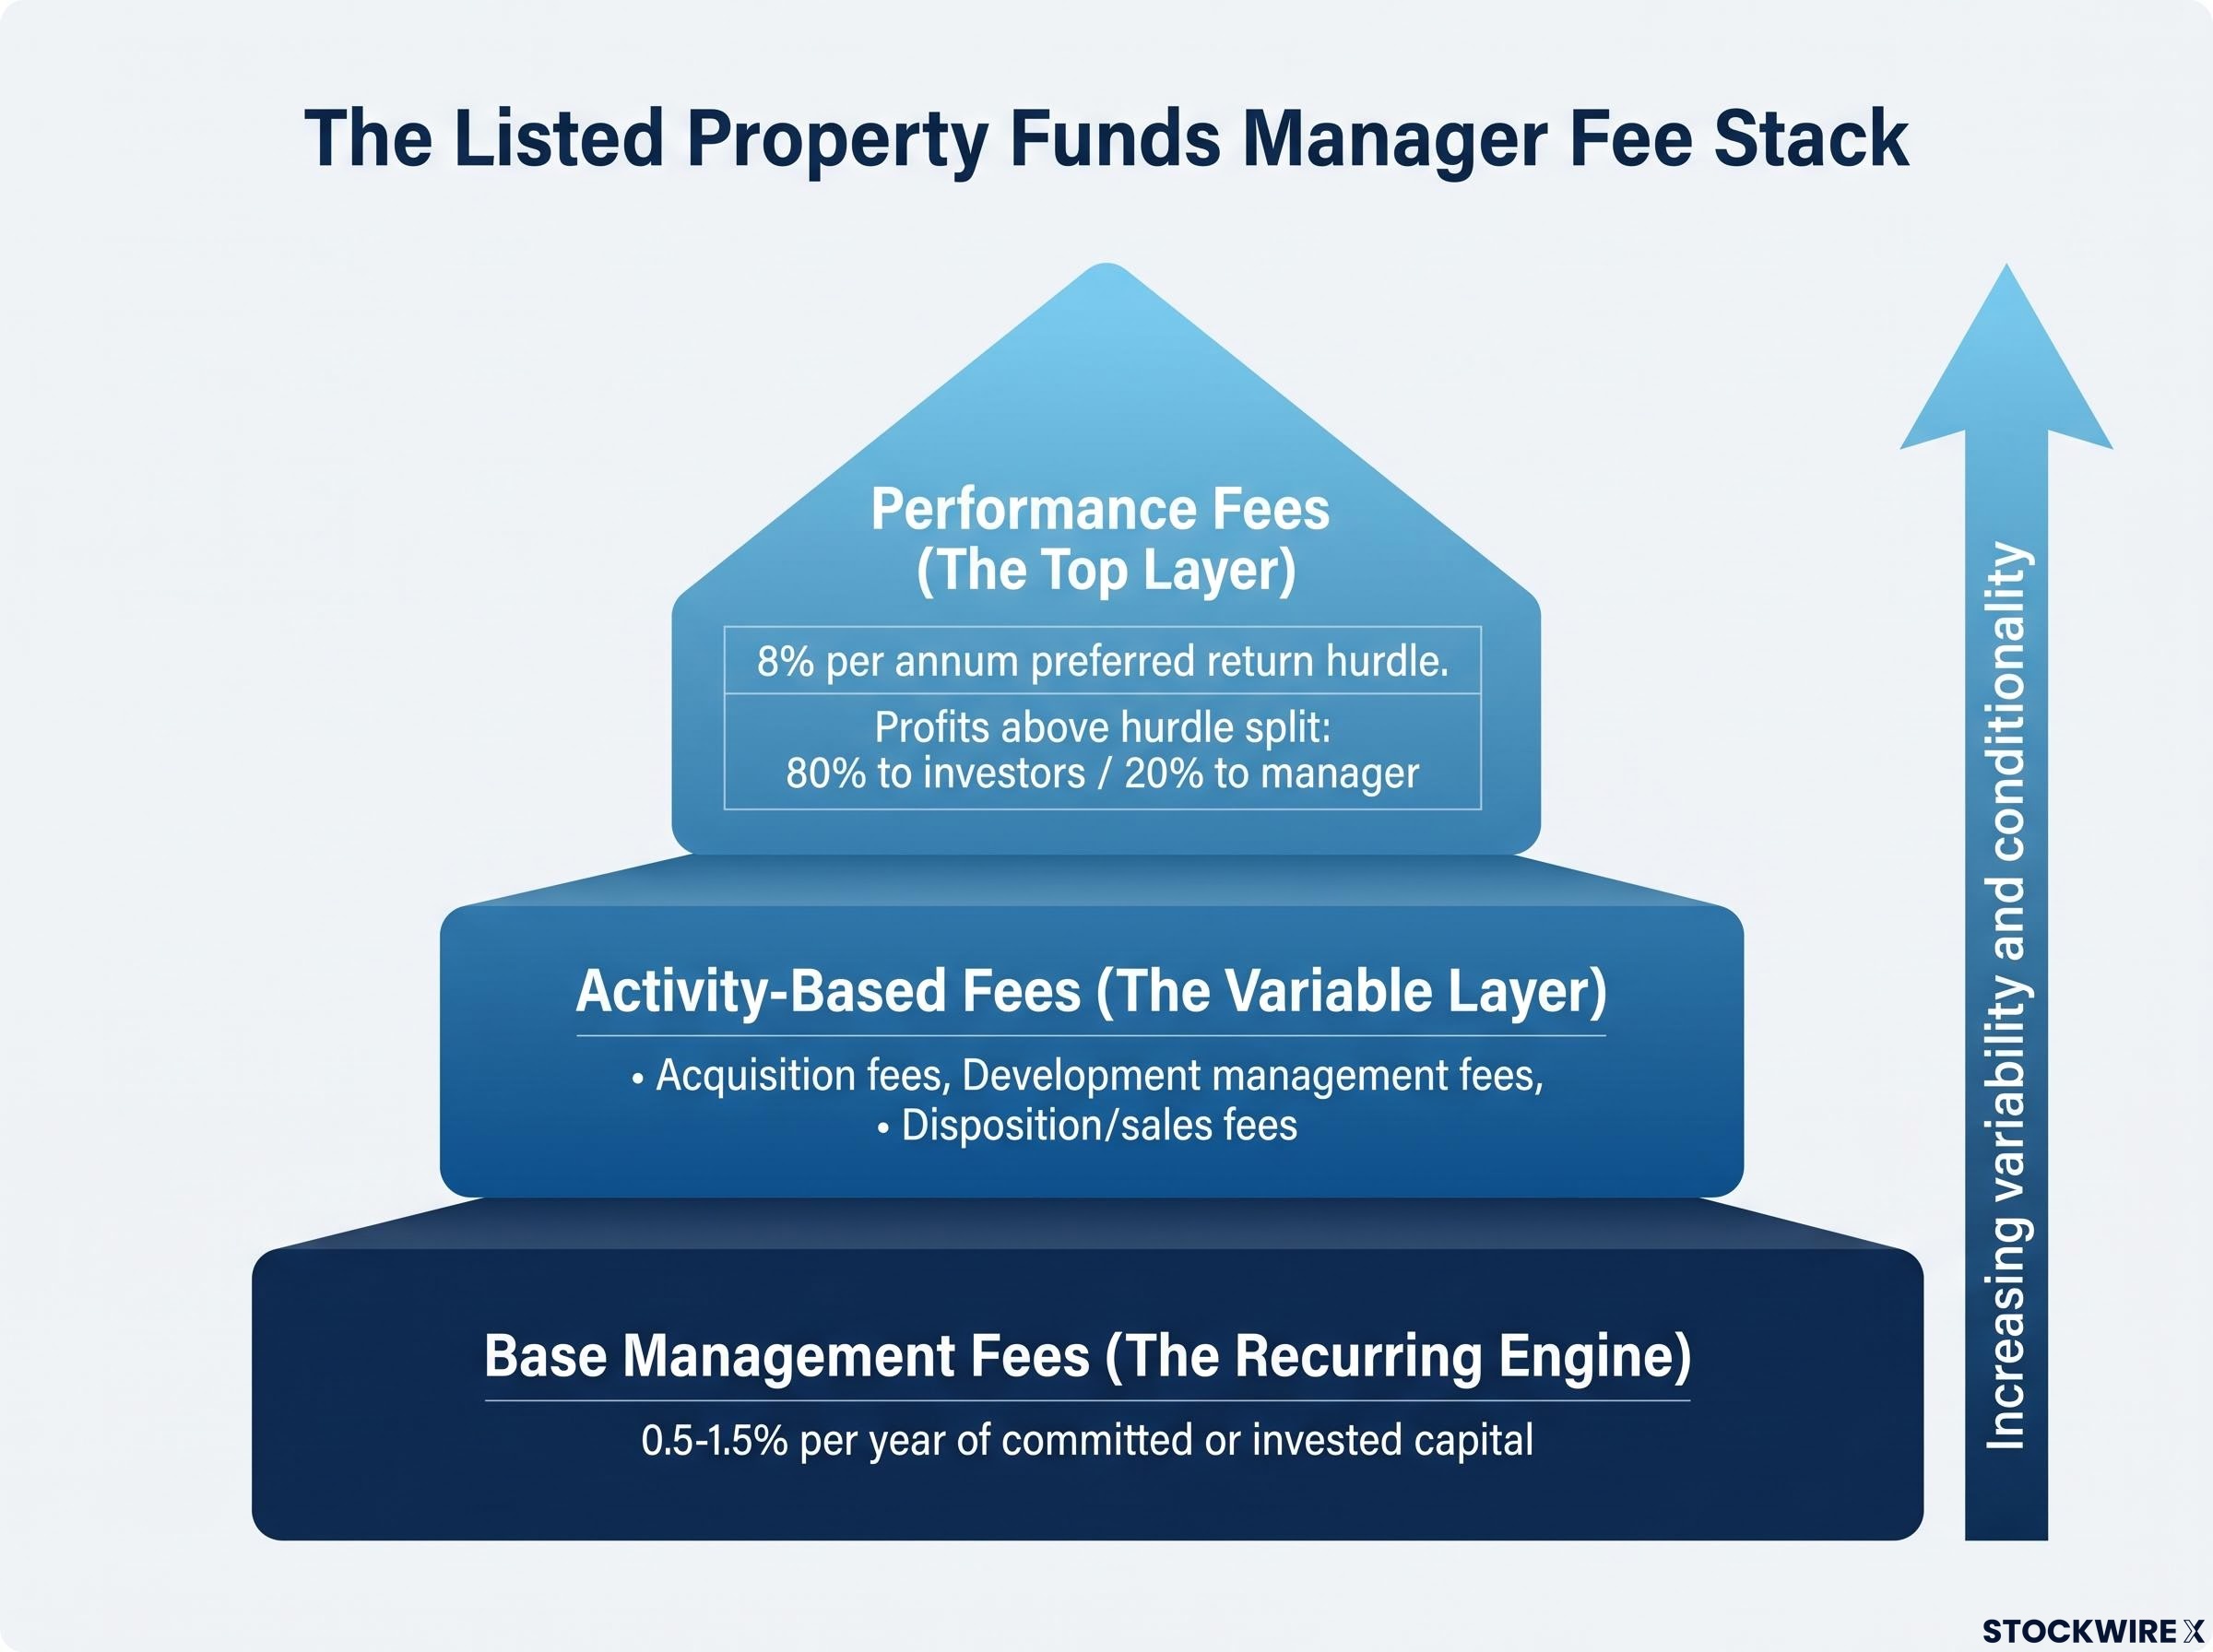
Base management fees: the recurring engine
Base investment management fees are charged as an annual percentage of FUM or assets under management (AUM), meaning the total capital already committed and deployed into fund structures. Typical structures in real estate funds range around 0.5-1.5% per year of committed or invested capital, depending on the strategy and investor type.
This fee accrues annually and recurs for the life of the fund while capital remains committed. It is the primary valuation driver of a listed funds management platform because it is directly tied to the size of the capital base. Specific forms include:
- Fund-level investment management fees
- Asset management or oversight fees on individual holdings within a fund
More FUM at a given fee rate equals higher recurring fee revenue. That said, this revenue is theoretically predictable but contingent on successful capital raising; if capital is not raised, the fee base does not grow.
Activity-based and performance fees: the variable layer
Beyond the recurring engine, managers earn activity-based fees tied to specific project or transaction milestones. These are lumpy and non-recurring, rising and falling with deal flow and development progress rather than with FUM alone. Common forms include:
- Acquisition fees: a percentage of the purchase price for sourcing and executing a transaction
- Development management fees: a percentage of total project costs or GDV for overseeing planning, construction, and delivery
- Disposition or sales fees: a percentage of the sale price when an asset within a fund is sold
Performance fees (also called carried interest or carry) sit at the top of the fee stack. These pay the manager a share of profits above a hurdle rate, which is a minimum return threshold that fund investors must receive before the manager participates in profit sharing. A common illustrative structure works as follows: investors receive all returns up to a preferred return of, say, 8% per annum; above that hurdle, additional profits are split approximately 80% to investors and 20% to the manager as carried interest.
Performance fee hurdle design is one of the most consequential and least scrutinised elements of a fund mandate: when a high-risk strategy is benchmarked against a low-volatility reference such as the RBA cash rate, the fee can reward risk-bearing rather than genuine manager skill, which matters to both fund investors assessing net returns and to listed manager shareholders trying to judge whether performance fee revenue is sustainable.
This is structurally analogous to the “2 and 20” model used in many private funds. Performance fees can be very material in strong markets but may be zero if returns do not exceed the hurdle. For early-stage managers with new funds, they are often years away from realisation.
One important caveat applies across all three categories: fee income only begins flowing once fund structures are established, investor capital is raised, and development stages commence.
How the market prices a listed property funds manager
How they are valued
Equity markets value these companies as asset managers rather than builders or REITs. Valuation is typically expressed in two ways: a multiple of earnings (price-to-earnings or enterprise value to earnings before interest and tax) driven primarily by fee income, and an implied multiple of FUM expressed in basis points. Higher-quality, larger, and more diversified managers trade at richer FUM multiples.
ASX comparators illustrate this in practice. Charter Hall at earlier growth stages demonstrated how multiples can expand as a platform matures and recurring fee revenue becomes a larger share of total income. Qualitas and Elanor Investors Group provide additional structural reference points for how the ASX has historically valued fee-income platforms at varying levels of maturity, without implying any forward-looking assessment of individual securities.
What drives the FUM multiple higher or lower
Investors monitoring listed property funds managers typically track five value drivers:
- Current FUM: the actual capital already raised and managed, directly driving base fee revenue
- Fee revenue and profitability: composition of revenue by type and operating margins on fee income
- FUM growth outlook: visible pipeline of new funds, strategies, or mandates that could expand the capital base
- Track record and platform quality: history of raising capital, delivering projects, and meeting return targets
- Revenue mix (recurring versus lumpy): platforms with a high proportion of recurring management fees and diversified FUM command richer multiples; those heavily reliant on one-off transaction fees or a single fund trade at a discount
Revenue mix is the single most consequential driver of the gap between a mature-manager multiple and an early-stage multiple. A platform generating 70% or more of fee income from recurring base management fees across diversified fund vintages presents a very different risk profile from one dependent on a handful of transaction fees within a single fund.
Six steps for evaluating a platform in its early stages
When a platform is young and fee revenue is still small, traditional metrics such as earnings per share and historical price-to-earnings ratios can be misleading. The most important first step is separating actual committed and deployed FUM from management’s stated pipeline or target FUM, because only the former generates base fees today.
A six-step assessment sequence provides a reusable framework:
- Confirm real FUM. Verify how much capital is already committed and deployed versus what management hopes to raise. Only the former drives current fee revenue.
- Calculate the genuine fee run-rate. Apply the disclosed management fee percentage to actual FUM to produce a base fee estimate, then layer in contracted development or project fees reasonably expected within 12-24 months.
- Examine the FUM growth path. Review upcoming fund launches, target fund sizes, and the status of capital raising, distinguishing between soft commitments and signed first closes.
- Interrogate track record and alignment. Assess the team’s prior history of raising funds and delivering returns, even at previous firms. Evaluate co-investment levels and fee structure fairness as indicators of alignment with investors’ interests.
- Map key milestones and timing risk. Identify first and final closes of new funds, deployment deadlines, major asset sales, and potential performance fee crystallisation points. Run a sensitivity analysis on what happens to the revenue model if fund close dates or deployment milestones slip by 6-12 months.
- Apply a risk discount in valuation. Until the platform has demonstrated repeatable FUM growth and stable recurring fee revenue, it should trade at a discount to mature managers. This discount is rational rather than a mispricing signal.
A benchmark scrutiny checklist covering hurdle identification, appropriateness assessment, and fee term review applies directly to the fourth step of the assessment framework above, because a performance fee benchmark set below the fund’s actual risk level can make a manager’s reported outperformance look stronger than it genuinely is.
“Until a platform has proven FUM growth and recurring fee stability, it will, and should, trade at a discount to mature managers with diversified, long-dated FUM.”
This framework applies regardless of the specific real estate strategy or fund type. The core question is always whether the fee revenue is real today or contingent on milestones that have not yet been achieved.
For investors who want to take the six-step framework above into a more systematic evaluation process, our dedicated guide to professional fund screening frameworks covers the three-pillar people, process, and parent methodology used by institutional analysts, including how team stability and parent culture function as leading indicators of strategy durability before any performance numbers are examined.
Scaling the platform: where operating leverage meets execution risk
The operating leverage logic of a funds management platform is straightforward. Once the fixed cost base (team, systems, compliance, investor relations) is established, incremental FUM growth drops through to earnings at a high margin because the cost structure does not scale linearly with FUM. A platform managing $2 billion in FUM does not need twice the headcount of one managing $1 billion.
That compounding dynamic, however, sits alongside three specific risk categories:
- Capital raising failure: if new funds do not close or existing fund commitments are not renewed, FUM stagnates and fee revenue flatlines despite the fixed cost base remaining in place
- Project delays within funds: if developments or acquisitions within fund structures are delayed, activity-based fees are deferred and performance fee crystallisation is pushed further out
- Fee compression: competitive pressure from other managers, or institutional investors negotiating harder on terms, can reduce the rate charged on new mandates over time
The risk profile contrasts with the developer model in an important way. The manager does not face cost-blowout or unsold-stock risk directly; those risks sit with the fund and its investors. What the manager faces instead is revenue-that-never-arrives risk if capital raising stalls or fund deployment is delayed.
Performance fees add another layer of variability. They can be very material in strong markets but may be zero if fund returns do not exceed the hurdle rate. For early-stage managers, performance fee realisation is often years away, making near-term earnings heavily dependent on base management fees alone.
Capital management, not capital ownership, is the core of the model
The listed property funds manager is an asset management business whose product is real estate funds. Valuing it correctly requires tracking FUM, fee revenue, and platform milestones rather than GDV or development margin. The six-step assessment framework outlined above applies to any ASX-listed property funds manager, regardless of the specific strategy, sector focus, or fund type.
Well-run platforms that grow FUM consistently, maintain fee margins, and prove their track record over time can generate attractive returns precisely because the fee model scales without the capital intensity of direct development. The compounding works in the investor’s favour when the platform executes; the risk sits in the gap between aspirational FUM targets and the capital that is actually raised, committed, and generating fees today.
This article is for informational purposes only and should not be considered financial advice. Investors should conduct their own research and consult with financial professionals before making investment decisions.
—