
You have probably done this before. You found a stock with strong earnings, a clean balance sheet, and a sector tailwind that made the thesis feel obvious. You bought it. Within three weeks it was down 15%, and you spent the next two months watching it recover to your entry price, wondering whether you had missed something or simply bought at the wrong time.
You had not missed anything fundamental. You had missed the structure. Market structure is the layer between knowing what to buy and knowing when to buy it. It does not replace your stock-picking process; it tells you whether price itself supports the timing of your decision. In the current Australian equity environment, where the ASX 200 has spent much of 2026 consolidating within a range and volatility has remained elevated, getting that timing layer right has become more consequential than it was during the trending conditions of 2023 and 2024.
After working through this framework, you will have a structured way to answer three questions every trade forces you to confront: when to enter, when to hold through a pullback, and when to cut. The process applies to any ASX stock, ETF, or index, and you can start using it tomorrow morning.
What market structure actually is (and why it outperforms headline-watching)
Headlines tell you what happened. A rate decision, an earnings beat, a geopolitical flare-up. What they cannot tell you is what price is actually doing in response. Two stocks can receive the same headline catalyst and move in opposite directions, because the underlying structure of each one was different before the news arrived.
Market structure is the sequence of swing highs and swing lows that reveals who is in control of price at any given moment. Instead of reacting to a single candle or a single headline, you are reading a pattern of price swings to determine whether buyers, sellers, or neither side holds a directional edge. That pattern falls into one of three states:
- Bullish structure: higher highs (HH) and higher lows (HL), meaning buyers are in control and each pullback holds above the last one
- Bearish structure: lower highs (LH) and lower lows (LL), meaning sellers are in control and each rally fails below the prior peak
- Range-bound structure: roughly flat highs and lows oscillating between defined levels, meaning neither side has a sustained directional edge
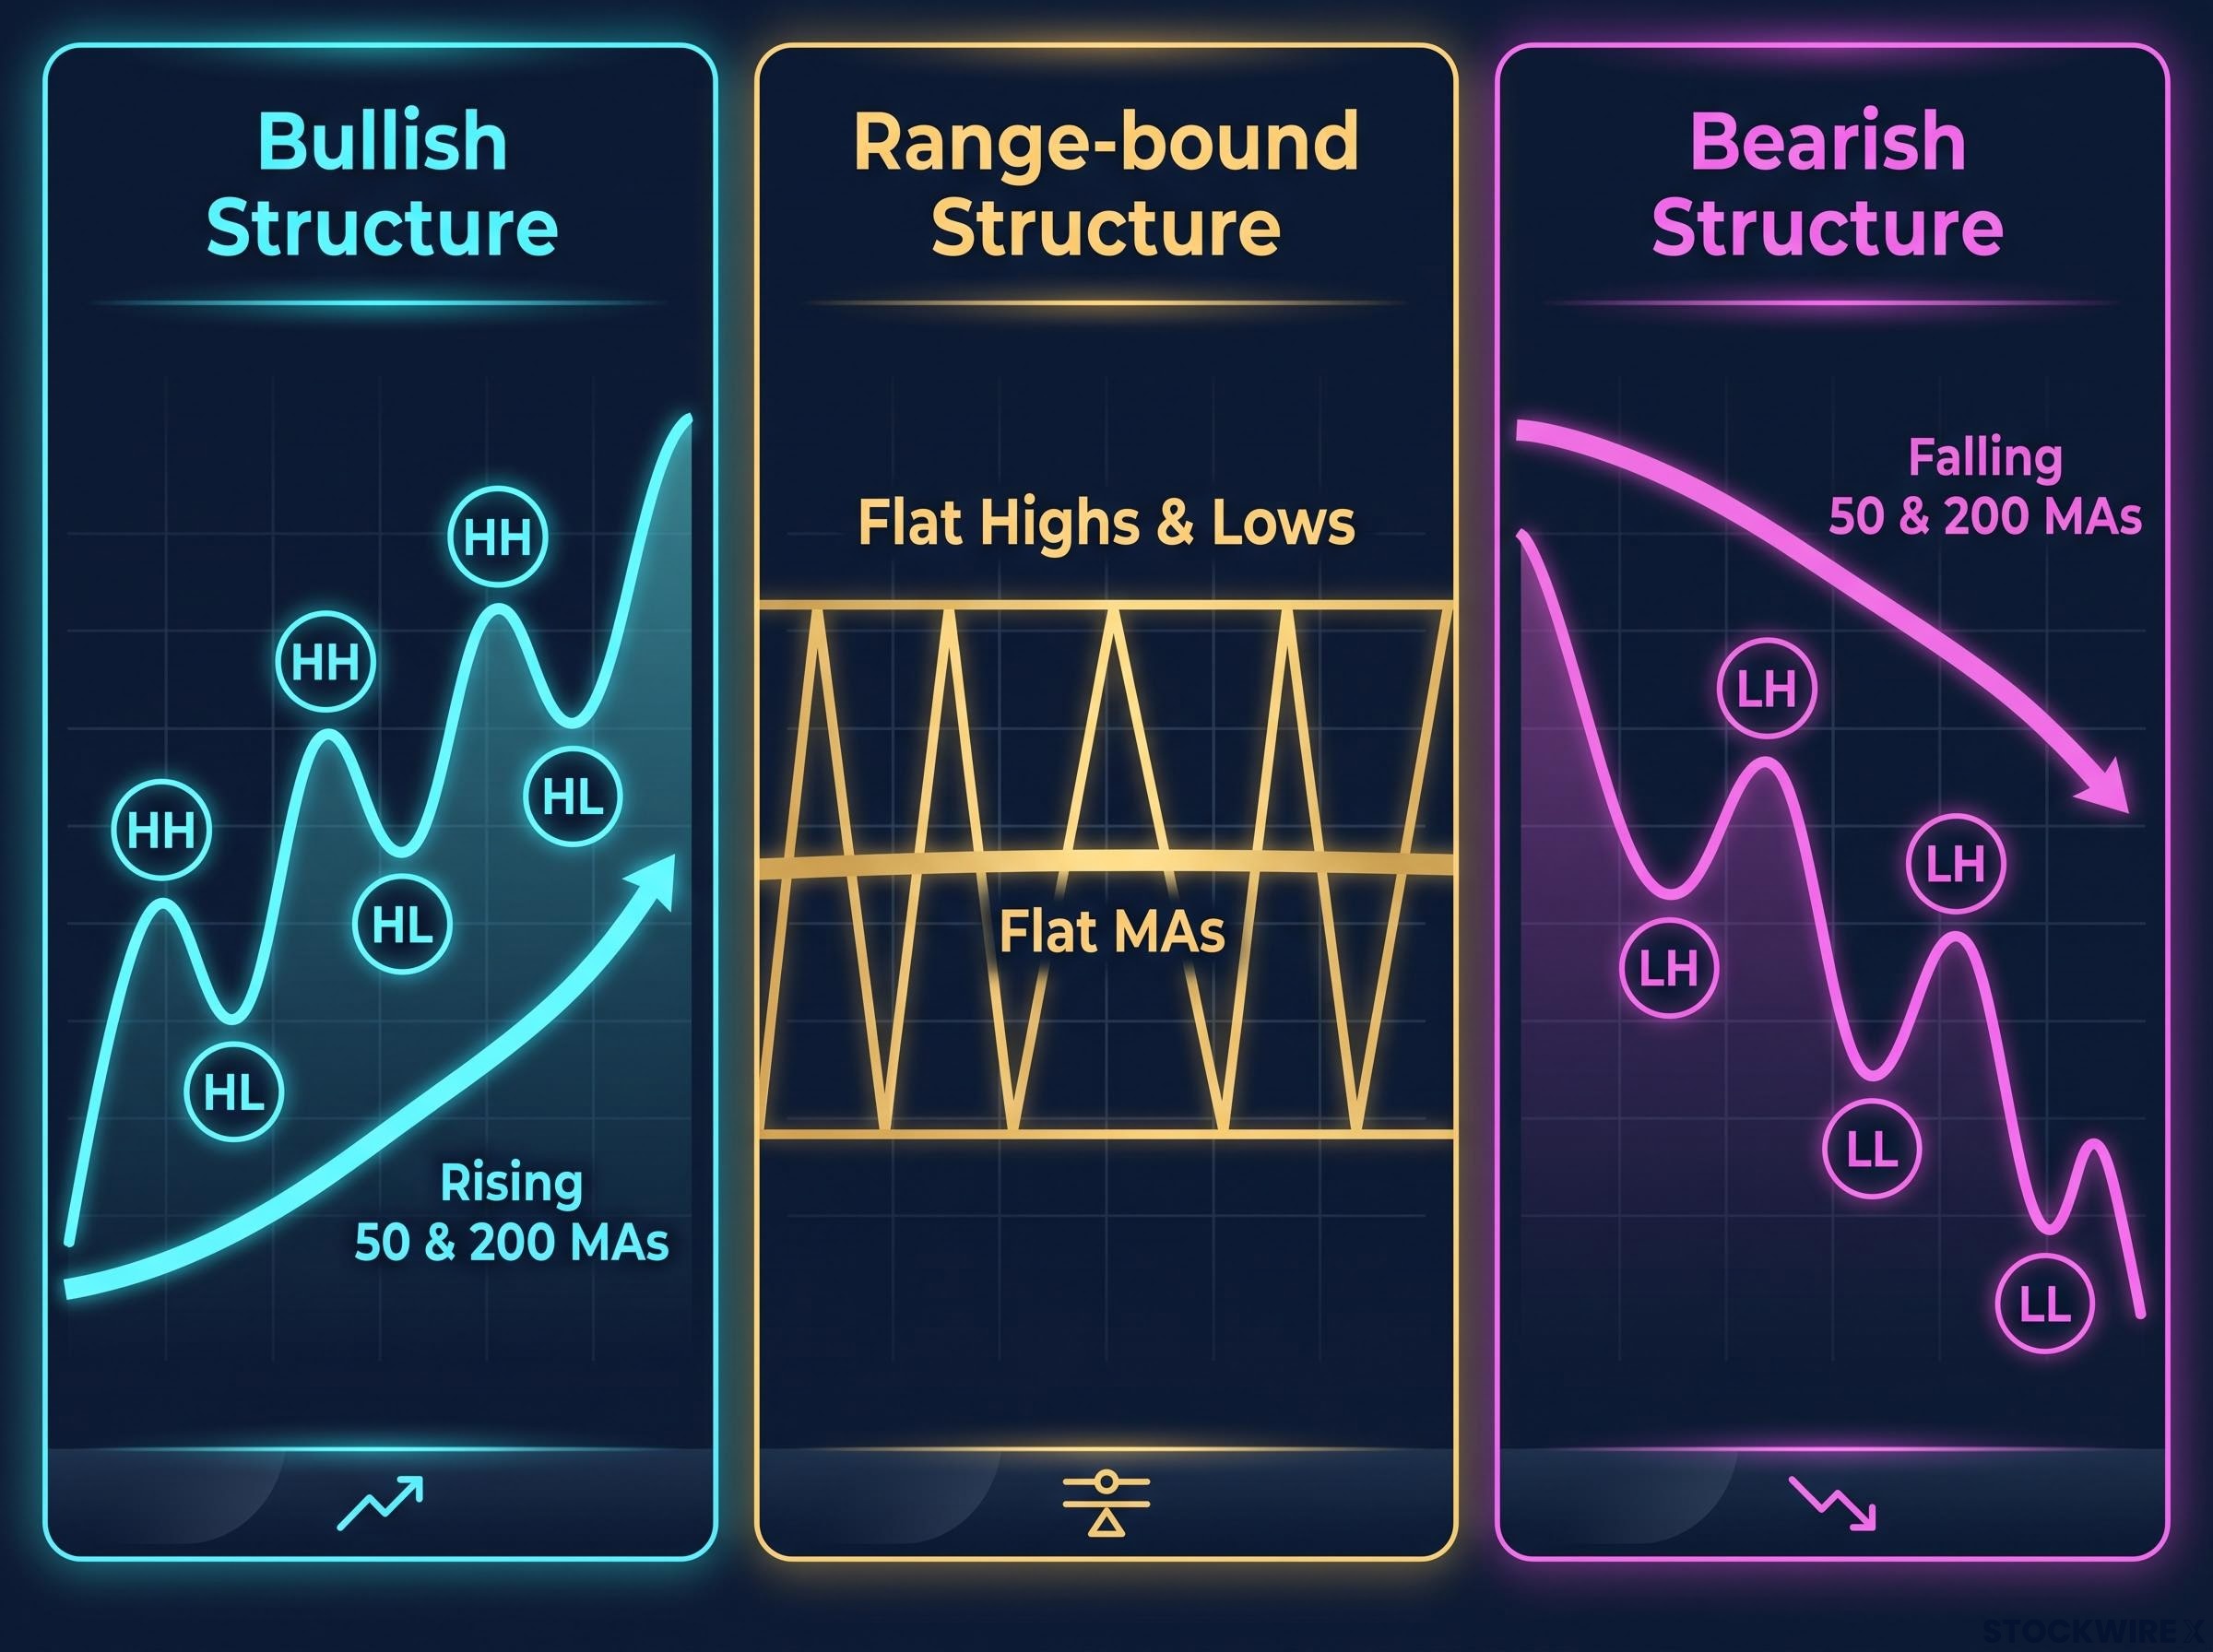
Rather than forecasting where price ought to go, this framework reads what price is actually doing right now and maps out likely outcomes from that point. That distinction matters, because it sets your expectations correctly from the start. Structure-reading is a diagnostic tool: it tells you what kind of environment you are operating in, which determines every subsequent decision about position size, entries, and exits.
Focus on the last 2-3 clear pivots rather than every minor wiggle. That filter removes noise and reveals the genuine structure underneath.
Swing highs and swing lows defined
A swing high is a local peak in price with lower highs on either side of it. Think of it as the point where a rally paused and sellers pushed price back down.
A swing low is a local trough with higher lows on either side. It marks the point where a decline stalled and buyers stepped in.
These two building blocks are the raw material for everything else in the framework. If you can identify them correctly on a chart, you can classify any market.
When big ASX news breaks, our subscribers know first
The essential tools: support, resistance, moving averages, and volume
Structure alone tells you the pattern. To act on it, you need four tools, each solving a problem the previous one cannot.
Support and resistance are price zones (not single price points) derived from prior swing lows and swing highs. They represent areas where buying or selling interest has concentrated before. A support zone drawn from a prior swing low tells you where price is likely to find demand. A resistance zone drawn from a prior swing high tells you where supply may emerge.
Moving averages provide trend context. The 50-period moving average (MA) captures intermediate trend direction; the 200-period MA captures the long-term trend. Their slope and where price sits relative to them give you an immediate structural read.
Volume confirms what price is already doing. A breakout accompanied by expanding volume carries more conviction than one on thin participation, which is more prone to failure.
Volume expansion on a break of structure is not a minor detail; trading volume confirmation is what separates a genuine trend initiation from a low-conviction move that reverses within a few sessions and traps the traders who acted on it.
When price breaks beyond a major support or resistance level and holds there, rather than snapping back, that is a break of structure (BOS). It signals that the trend is either continuing or transitioning. For a BOS to carry weight:
- Price must close convincingly beyond the level, not just wick through it
- The move should hold on a retest rather than immediately reversing
- Volume expansion on the break improves confidence it is genuine
| Tool | What it shows | How to read it |
|---|---|---|
| Support / Resistance zones | Where price is likely to find demand or face supply | Mark prior swing lows (support) and swing highs (resistance) as zones, not exact lines |
| 50-period MA | Intermediate trend direction | Price above a rising 50 MA = bullish context; price below a falling 50 MA = bearish |
| 200-period MA | Long-term trend direction | Price above a rising 200 MA = structurally bullish; below a falling 200 MA = structurally bearish |
| Volume | Conviction behind price moves | Rising volume on breakouts = genuine; weak volume on breakouts = suspect and more likely to fail |
For an ASX-listed stock, these four tools answer four questions in sequence: where is price likely to pause or reverse (zones), what is the dominant trend context (MAs), and is the current move backed by genuine participation (volume)?
Bullish market structure: what it looks like and how to trade it
A bullish structure is the easiest to recognise and the environment where most long-only ASX investors spend the majority of their time. The visual signature is a clear pattern of higher highs and higher lows. Price trades above rising 50- and 200-period MAs, and pullbacks get contained at support zones or near the rising averages before resolving higher.
What trips investors up is the middle of the trend, not the beginning. Consolidation phases within a bullish structure are typically continuation pauses, not major tops. The difference matters, because mistaking a normal pause for a reversal is one of the most common reasons investors exit a winning position too early.
Market breadth divergence is one of the earliest warning signs that a bullish headline index is masking structural deterioration underneath: when the number of stocks printing new 52-week lows begins to outpace new highs, the higher high on the index level may reflect a narrowing leadership base rather than broad buying participation.
Pullbacks of 20-30% or more have been a regular feature of strong, sustained trends before those trends ultimately continued. That figure is not a reason to abandon risk controls. It is the foundation for deciding, before you place a trade, what separates a routine correction from a structural breakdown, so that a drawdown does not force that judgement in the moment.
Trend-following evidence points to a consistent pattern: portfolios that stayed aligned with the prevailing market direction and did not overreact to temporary setbacks tended to outperform those that tried to anticipate peaks and troughs.
Your bullish structure playbook comes down to three elements:
- Entries: buy pullbacks to support zones or near rising MAs, with a bullish candle or volume confirmation signalling that demand is stepping in
- Stop placement: use the prior swing low as your invalidation point; if that level breaks, the structure that justified the trade is weakening
- Exit signals: reduce or exit when the first lower high followed by a lower low appears, or when price decisively breaks below the 200 MA and it begins sloping downward
Getting these three right in a bullish environment has the highest practical impact for your ASX portfolio, because this is where most of your capital is deployed most of the time.
Range-bound market structure: navigating the consolidation phase
If you have been watching the ASX oscillate without clear direction for stretches of 2026, the frustration is understandable. The instinct is to treat the range as a problem to solve or a signal that something is wrong. It is neither. A range is a recognised market phase with its own rules, and it requires a different strategic posture entirely.
The visual signature is flat swing highs and swing lows oscillating between defined support and resistance zones. The 50- and 200-period MAs flatten out, and price whipsaws through them repeatedly. False breakouts are common: price briefly punches above resistance or below support, traps aggressive buyers or sellers, then snaps back inside the range.
When strong market advances give way to sideways conditions, the data shows those consolidation periods can run for years rather than quarters. Sustained flat phases that follow prolonged uptrends are a recurring feature of market history, and they typically give way eventually to a fresh directional move.
That resets a common expectation. If you are waiting for the range to “end next month,” the historical evidence suggests patience measured in quarters, not weeks.
Your tactical approach inside a range shifts meaningfully:
- Position sizing: reduce. The reward-to-risk ratio on directional trades deteriorates when there is no clear trend to ride.
- False breakout warnings: a break beyond the range boundary on weak volume that immediately reverses is the signature of a trap, not a trend initiation.
- Confirmed breakout criteria: a genuine shift requires price to break and hold beyond the range, then form a higher low on retest (transitioning toward bullish) or a lower high on retest (transitioning toward bearish), ideally with volume expansion.
For your portfolio, understanding the range’s rules directly reduces the reactive turnover that erodes returns in choppy conditions. Concentrating on price structure rather than media commentary helps you avoid unnecessary trades that look decisive but carry poor odds.
Bearish market structure: shifting to capital preservation mode
A bearish structure forms a clear pattern of lower highs and lower lows. Price trades below falling 50- and 200-period MAs, and the averages themselves act as dynamic resistance, capping countertrend rallies that feel convincing in the moment but fail at prior structural levels.
The temptation in this environment is to hold because the fundamentals still look strong. Structure is telling you something different: the market itself is not supporting those fundamentals right now, and ignoring that message is a documented way to turn a manageable loss into a large one.
Sector rotation signals often reveal a bearish structure forming in one part of the market while a bullish structure persists in another, as occurred when ASX energy stocks slid to 52-week lows while utilities and healthcare simultaneously pressed fresh highs, a divergence invisible at the index level but clearly readable through sector-specific swing analysis.
Your strategic posture shifts decisively:
- Reduce long exposure: positions that have broken key support and formed a LH/LL pattern are candidates for reduction or exit, regardless of the underlying thesis
- Short entry criteria (for those who short): sell rallies into resistance zones or toward declining MAs, with stops above the prior swing high
- Cash and defensive positioning: cash carries no opportunity cost while the market is sliding; high-beta long exposure carries a large opportunity cost in a clear bearish structure
Bear market rallies: what they look like and why they matter
Countertrend rallies in bearish structures are sharp and fast, driven by short-covering and oversold bounces. They feel like the bottom is in. They tempt you to re-enter.
The structural tell is what happens next. A rally that reaches a prior swing high and fails there, forming a lower high, confirms that the bearish structure remains intact. The sellers who drove the decline are still in control. Until you see a higher low form after a rally, meaning the sequence of LH/LL has broken, the structural bias stays bearish.
For long-only Australian investors who do not short, this section is primarily about defining the threshold at which reducing exposure becomes a structurally justified decision rather than a fear response. Structure gives you that threshold in advance.
A repeatable five-step process for classifying any market
Everything above converts into a sequential process you can open a charting platform and follow right now. The sequence matters because each step depends on the one before it.
- Zoom out to a weekly or daily chart and identify the dominant bias using swing patterns and the slope and position of the 50- and 200-period MAs
- Mark the last 2-3 clear swing highs and lows as zones, not single price points
- Classify the state using the HH/HL, LH/LL, or flat criteria in combination with MA context
- Drop to an intermediate timeframe (daily or 4-hour) to identify entry zones: support levels, MA levels, retest levels within the higher-timeframe bias
- Define stops and targets based on structure. Stops sit just beyond the price level that invalidates your structural view; targets sit at the next significant structural level
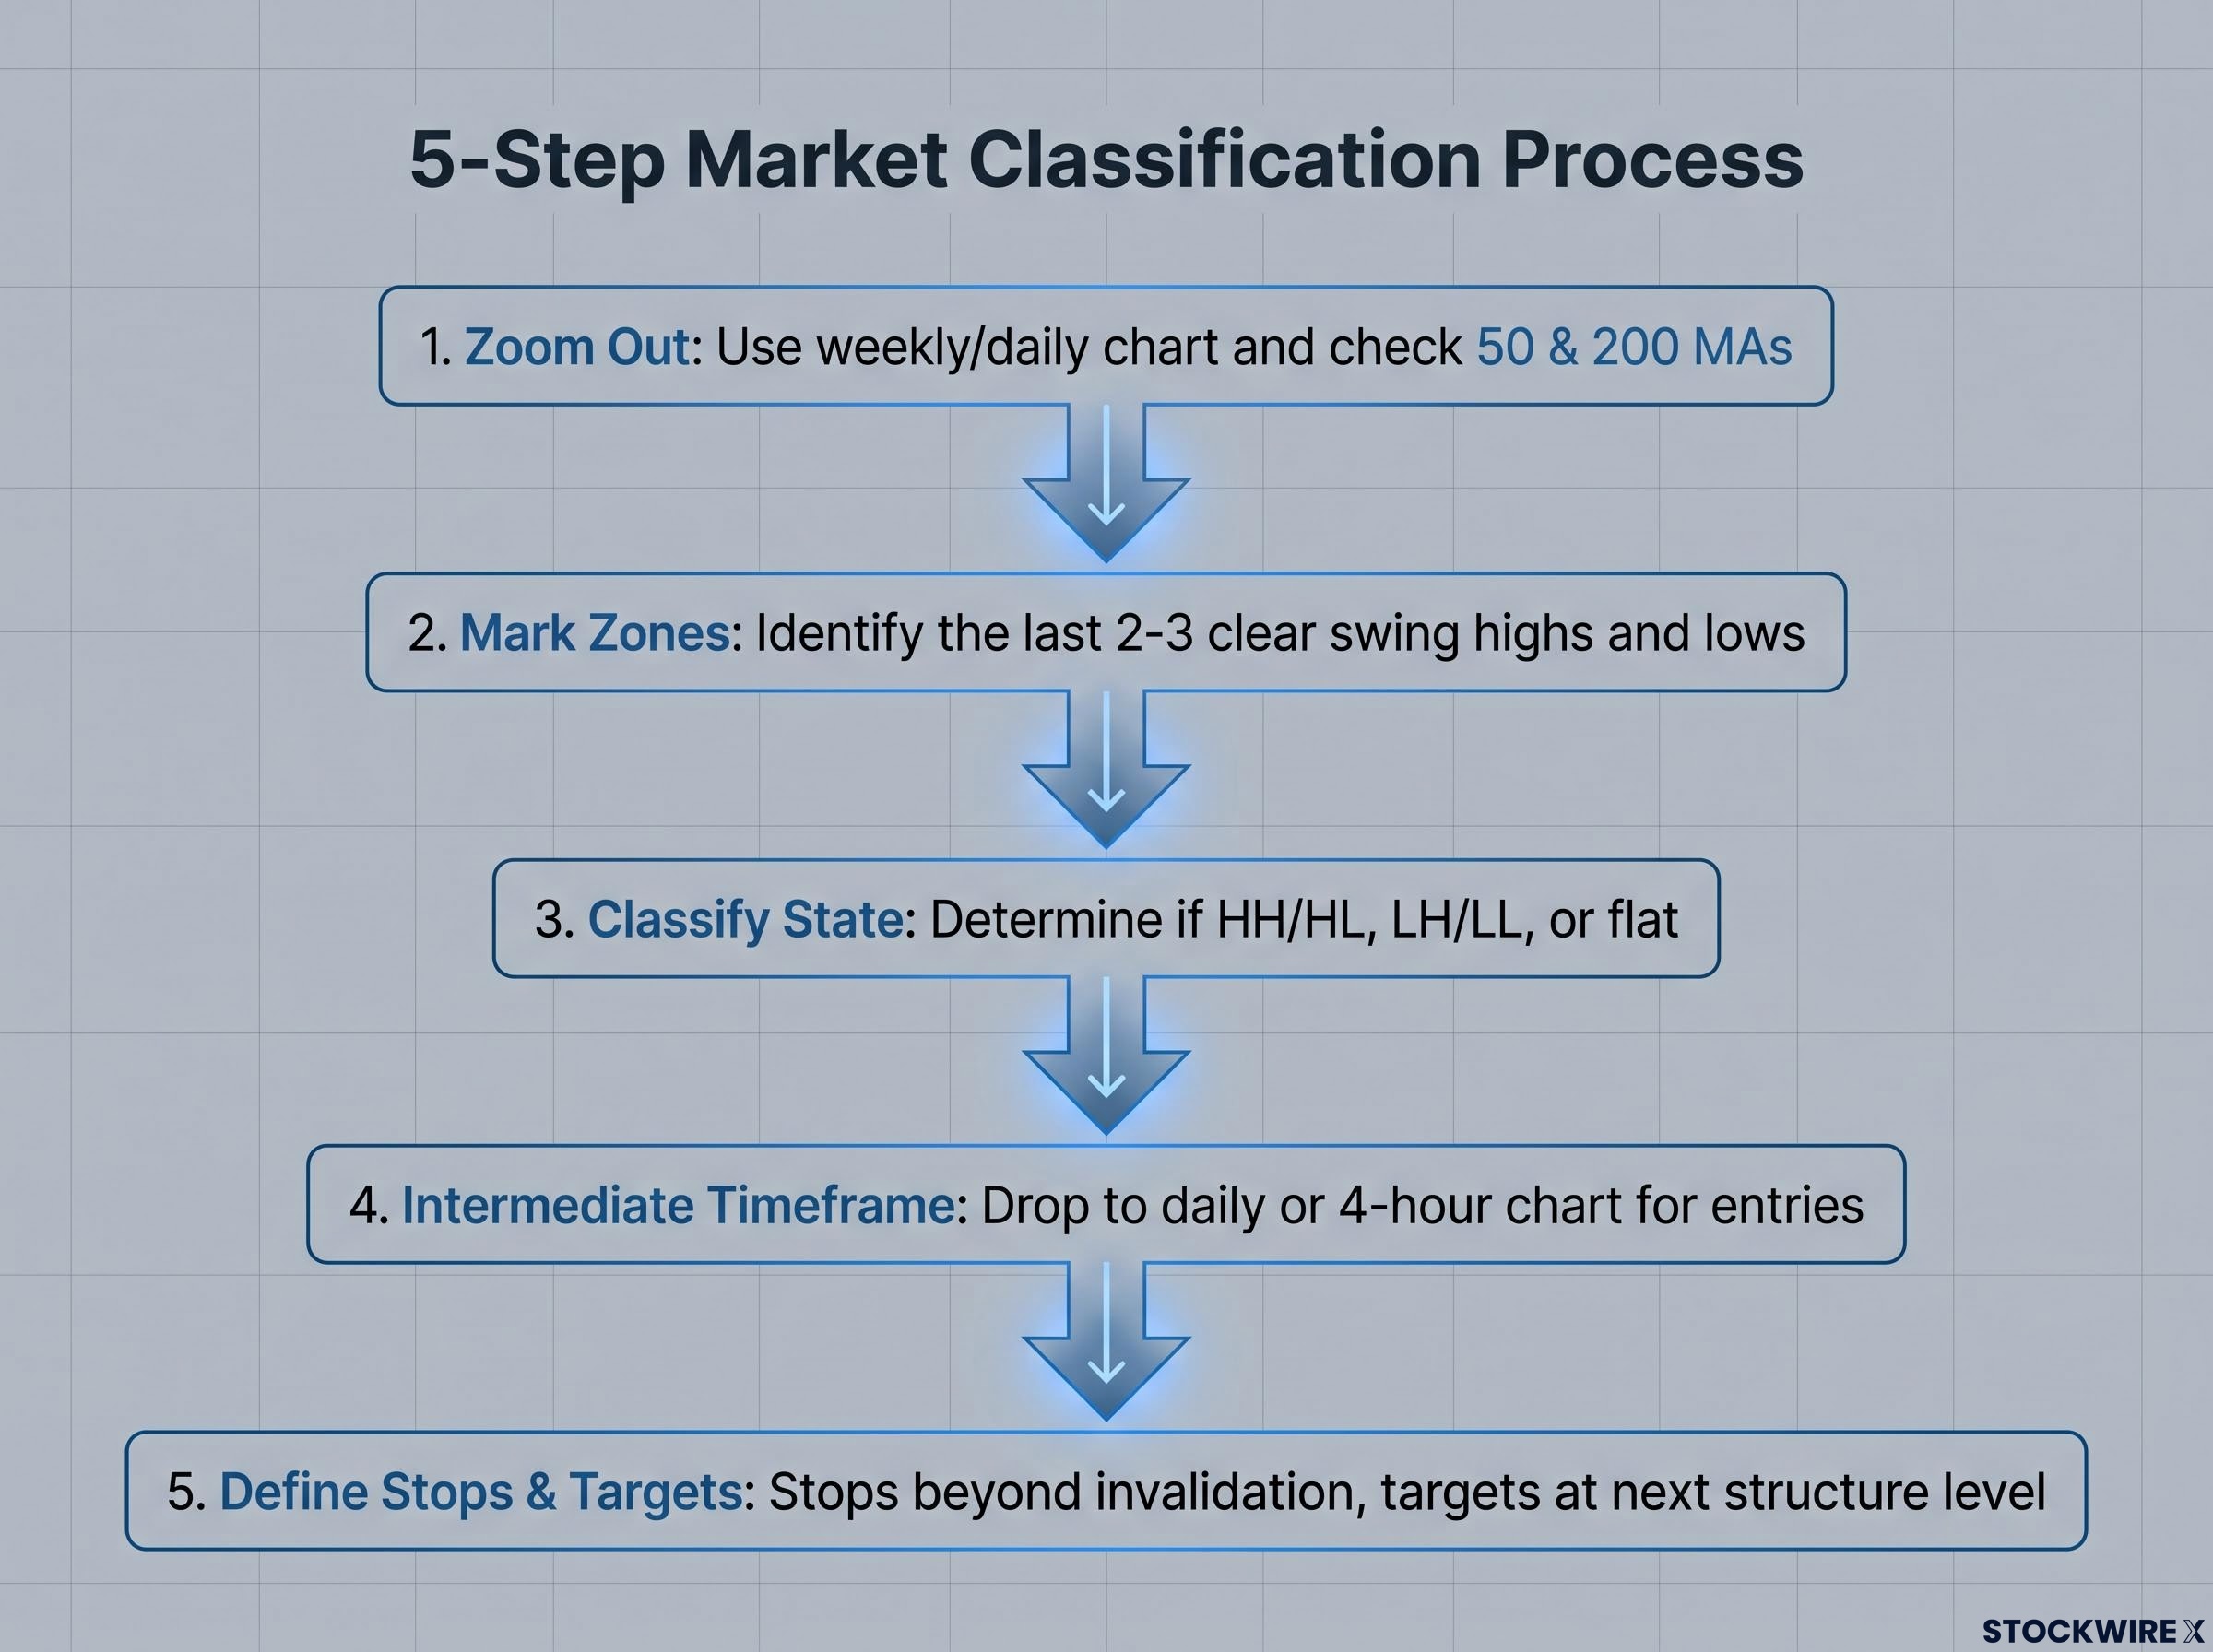
This top-down approach prevents the most common structural error: reacting to short-term noise on a 15-minute chart that contradicts what the weekly chart is clearly showing you.
Following this sequence before every trade ensures that your position sizing, stop placement, and target selection are all anchored to the same structural reading. That is the practical difference between a framework applied consistently and a loose set of concepts applied selectively under pressure.
Each time you complete the process, it answers the same three questions: when to enter, when to hold through a correction, and when to cut.
| Market state | Price pattern | Strategic posture |
|---|---|---|
| Bullish | Higher highs, higher lows; price above rising 50/200 MAs | Buy pullbacks to support; hold through normal corrections; exit on structural breaks |
| Range-bound | Flat highs and lows; MAs flat, price whipsaws through them | Trade the range; reduce position size; wait for confirmed breakout with structural confirmation |
| Bearish | Lower highs, lower lows; price below falling 50/200 MAs | Reduce longs; consider shorts on rallies to resistance; prioritise capital preservation |
What to do with this framework from here
Rather than projecting where price will move next, this framework reads the current state of the market and uses that to weigh probable outcomes. That distinction shapes how you apply it: you are classifying what is, not forecasting what will be.
Price charts for major Australian and US equity indices show that the broad upward direction across both markets has persisted over the past decade, even as both experienced meaningful corrections and extended sideways phases along the way. Accepting that markets move through expansion, consolidation, and contraction as a normal sequence, rather than in a straight upward line, takes much of the emotion out of decisions made during difficult periods. Anchoring to longer-term weekly or daily charts keeps short-term fluctuations in their proper context and reduces the urge to act unnecessarily.
Practitioners who apply this kind of structural framework consistently tend to find the same thing: staying with the direction the market is already moving, rather than trying to call where it will turn, produces more reliable results over time.
Your practical next steps:
- Apply the five-step process to the ASX 200 this week: zoom out, mark the swings, classify the state, and compare the structural read to your current positioning
- Classify your current holdings by structural state: which are in bullish structures, which are range-bound, and which have shifted bearish
- Audit your stop placements against structure rather than arbitrary percentage levels; every stop should sit at a price that, if broken, invalidates the structural thesis behind the trade
Applying the five-step process to the current index reveals why ASX 200 structural levels matter so concretely right now: with the index range-bound between 8,500 and 9,000 for more than 14 weeks and internal breadth showing a four-to-one ratio of declining to advancing stocks on flat headline closes, the structural read diverges sharply from what the index print alone suggests.
You will not avoid all losing trades by reading structure. But you will know precisely why you are in each trade, when the structure that justified it has changed, and what your exit looks like before you enter. That is the genuine edge this framework offers.
This article is for informational purposes only and should not be considered financial advice. Investors should conduct their own research and consult with financial professionals before making investment decisions. Past performance does not guarantee future results.
—