UBS Backs Five Non-Dollar Currencies as Bearish Dollar Bet Builds
10 hrs ago

At approximately $3.20 per gallon, U.S. jet fuel prices in mid-2026 are functioning less as a uniform cost headwind and more as a competitive sorting mechanism. The gap between carriers with genuine pricing power and those reliant on fare discipline alone is widening with each quarterly earnings release. United Airlines CEO Scott Kirby’s remarks at the IATA annual meeting in June 2026 crystallised a thesis aviation investors have been circling for months: in a sustained high-fuel-cost environment, the industry’s competitive map is being redrawn around operating profitability rather than network scale or balance sheet size. What follows is an analysis of the specific mechanisms by which rising fuel costs are separating major carriers from their rivals, the contested strategies of hedging and refinery ownership, and the investor implications for positioning across airline stocks in the back half of 2026.
The intuitive assumption is straightforward: fuel prices rise, all airlines suffer, margins compress across the board. The reality is more uneven than that, and the unevenness is where the investment signal lives.
Fuel costs represent roughly 20-30% of total operating expenses for major U.S. carriers, making fuel the single largest variable cost line and the most consequential lever in margin performance. At $3.20 per gallon, per EIA and Argus benchmarks through late May to early June 2026, the cost shock is identical across competitors. The ability to pass it through to customers is not.
The $3.20 per gallon figure does not emerge from ordinary market tightening: jet fuel tanker loadings collapsed 50% week on week in early May 2026 as the Iran conflict produced a jet fuel supply crisis that ConocoPhillips warned could generate critical shortfalls by June, a structural disruption that has pushed the cost environment well above pre-conflict baselines and made the competitive sorting described here more acute than it would be under normal market conditions.
This is the distinction Kirby has been sharpening in public commentary. The divide is not between large and small carriers as such. It is between carriers whose brand-loyal customers accept fare increases and carriers whose customers will switch to a cheaper alternative the moment fares rise.
Kirby’s framing: The competitive gap is widening between carriers with established customer loyalty and those whose primary competitive tool remains a low ticket price. The cost shock is shared; the capacity to absorb it is not.
That asymmetry converts a shared input cost into a relative margin advantage for carriers positioned on the right side of it. Investors who treat fuel price movements as a uniform sector-wide headwind will misprice relative exposure.
Two distinct approaches to fuel cost management are on display across the U.S. carrier landscape, and the current price environment has made the gap between them more consequential than it was when fuel costs were stable.
United Airlines maintains no fuel hedging programme. Kirby has argued that hedging becomes structurally self-defeating when it generates net losses over extended periods, and that operational efficiency and revenue management are the preferred substitutes. The position is a deliberate strategic bet: revenue quality, not derivative instruments, is the buffer.
Southwest Airlines takes the opposite approach, maintaining an active hedging programme with derivative instruments that provide short-term fuel price dampening. The protection is real but comes with competitive constraints; in price-sensitive leisure markets, hedging gains do not translate into the same fare flexibility that brand-loyal carriers enjoy.
Air New Zealand’s experience illustrates why hedging programmes carry a structural gap that the Southwest comparison does not fully capture: despite 83% Brent crude hedging for H2 FY2026, Air New Zealand faced guidance suspension because crack spread exposure, the refinery margin component sitting outside crude price coverage, widened by up to 423% as Middle East conflict pushed jet refining margins from US$20 to approximately US$115 per barrel.
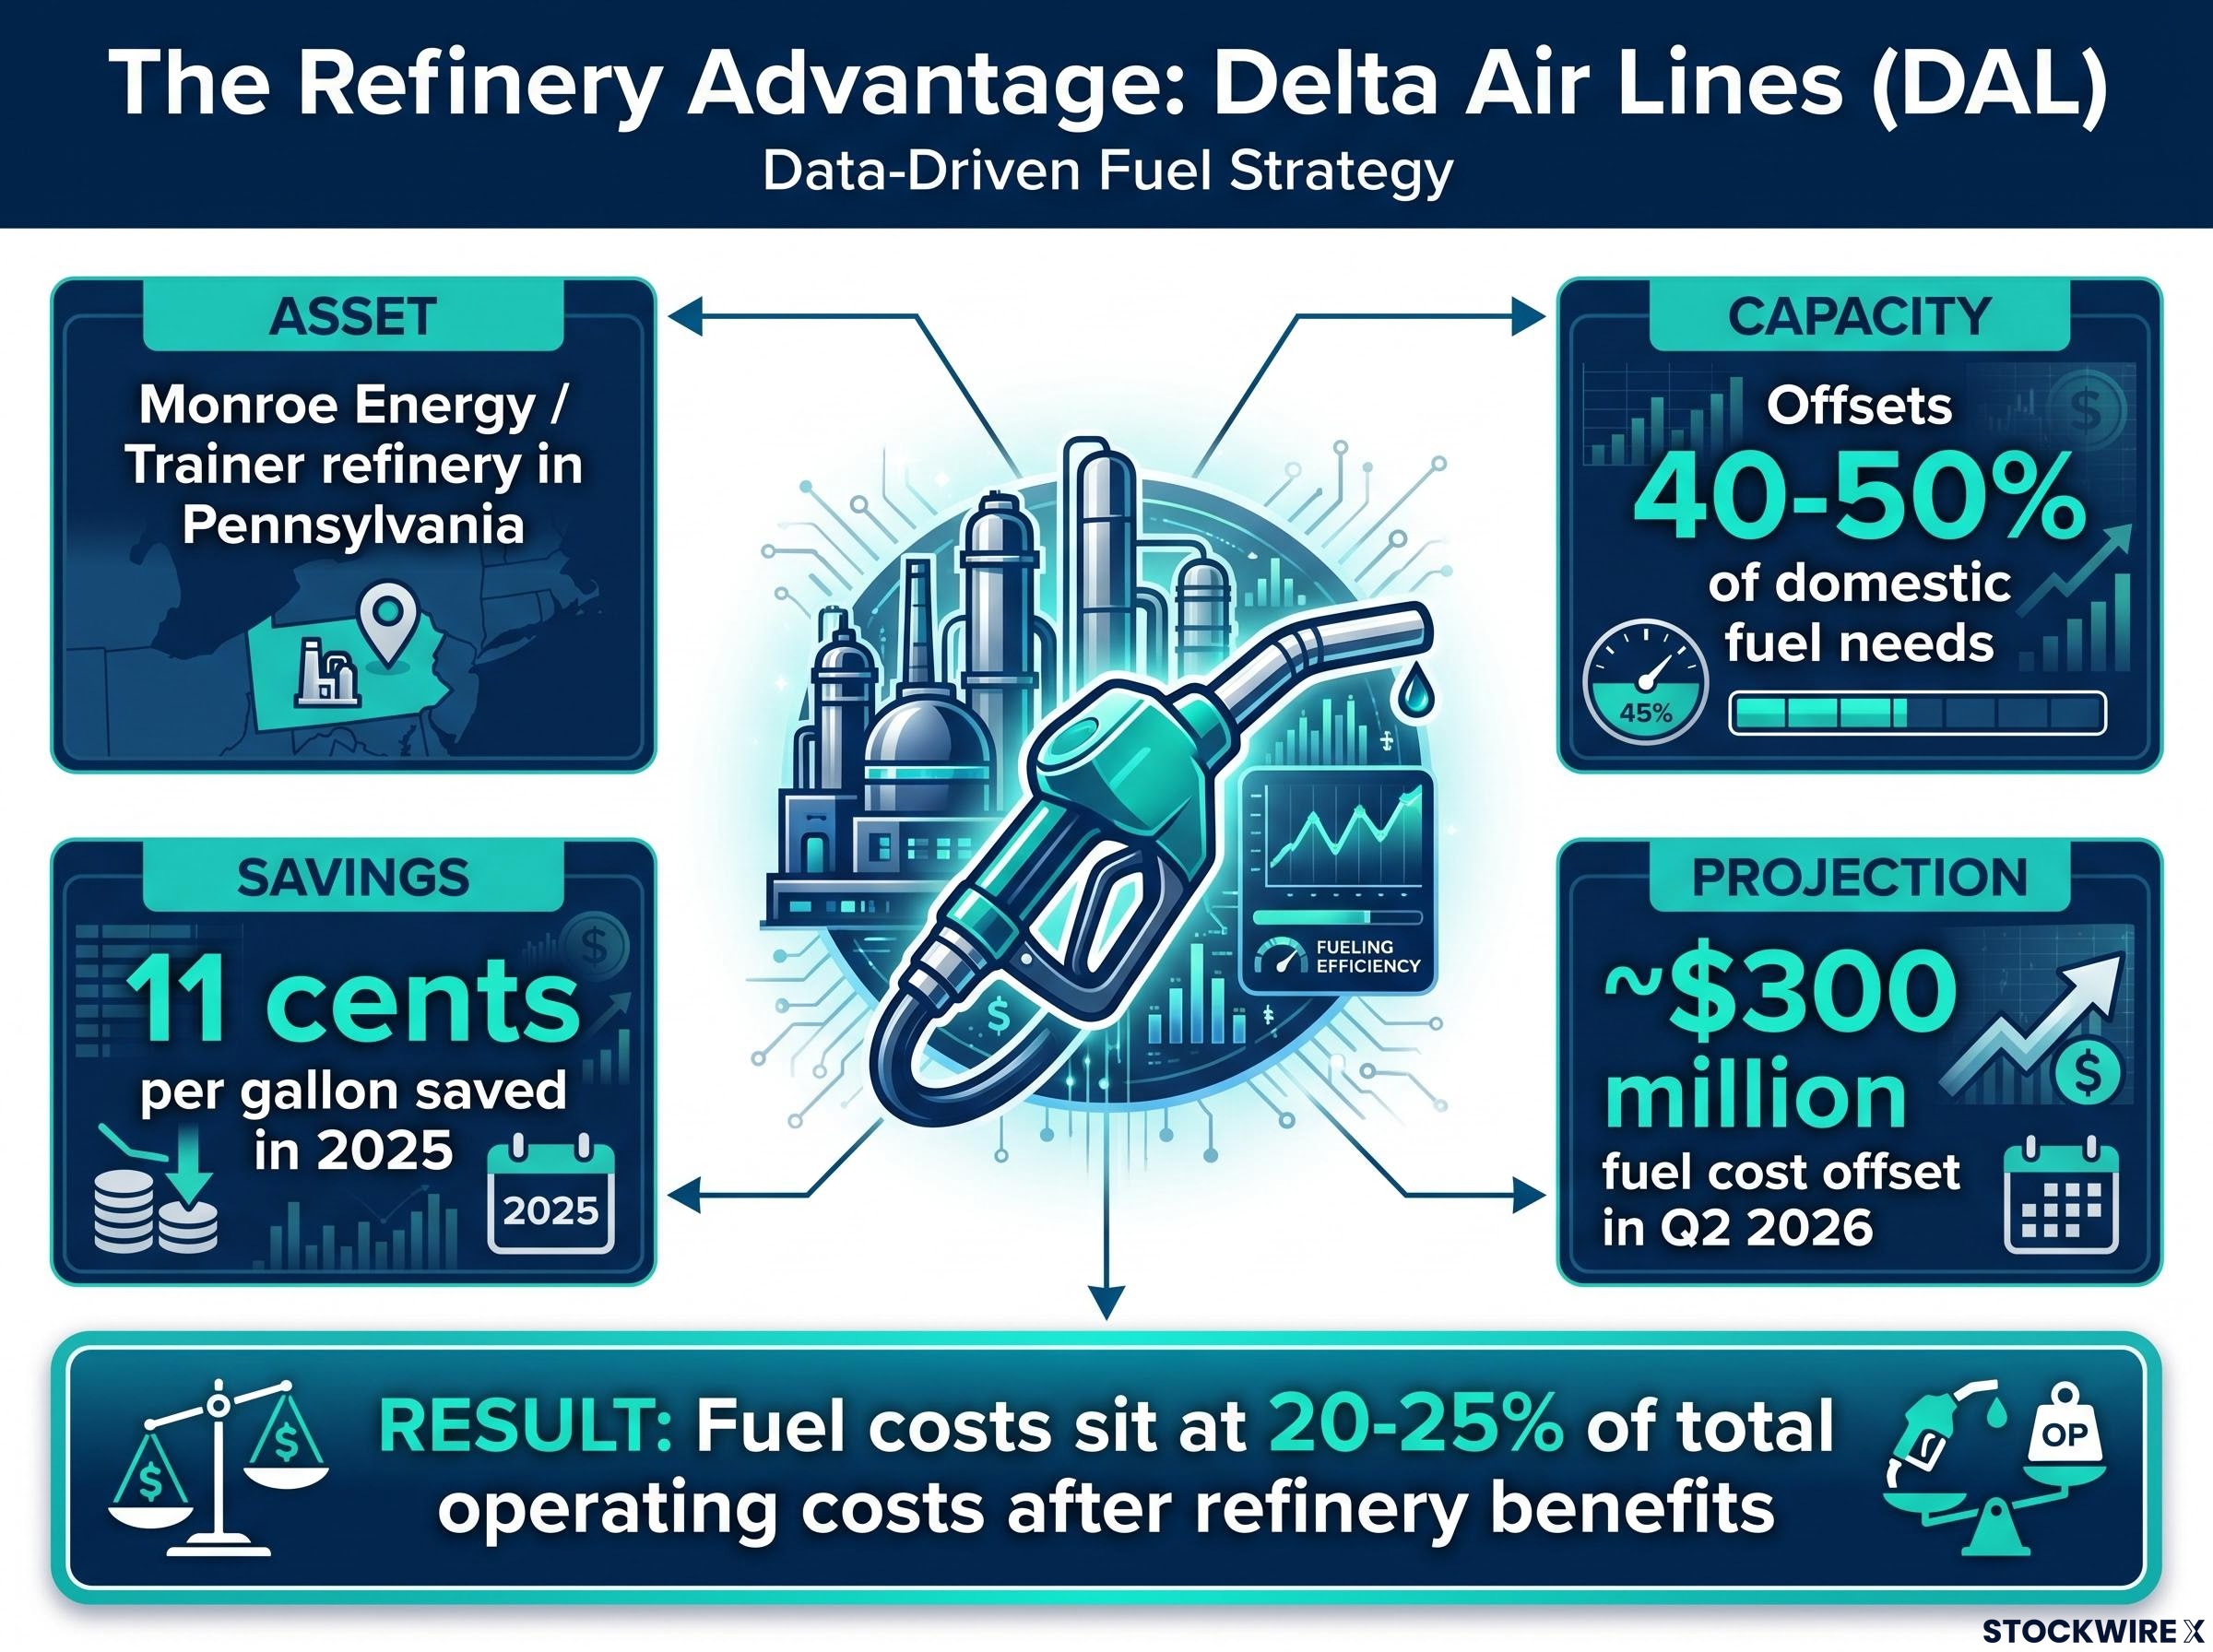
Delta Air Lines occupies a category of its own. Through Monroe Energy, Delta owns the Trainer refinery in Pennsylvania, which offsets approximately 40-50% of Delta’s domestic fuel needs. Monroe delivered approximately 11 cents per gallon in cost savings for Delta in 2025 and is projected to provide approximately $300 million in fuel cost offsets in Q2 2026.
Kirby has acknowledged that Delta’s refinery is providing a relative cost advantage in the current environment, while confirming United has no intention of replicating the model. Delta’s fuel costs sit at approximately 20-25% of total operating costs after refinery benefits, a meaningful structural discount against carriers buying entirely at spot.
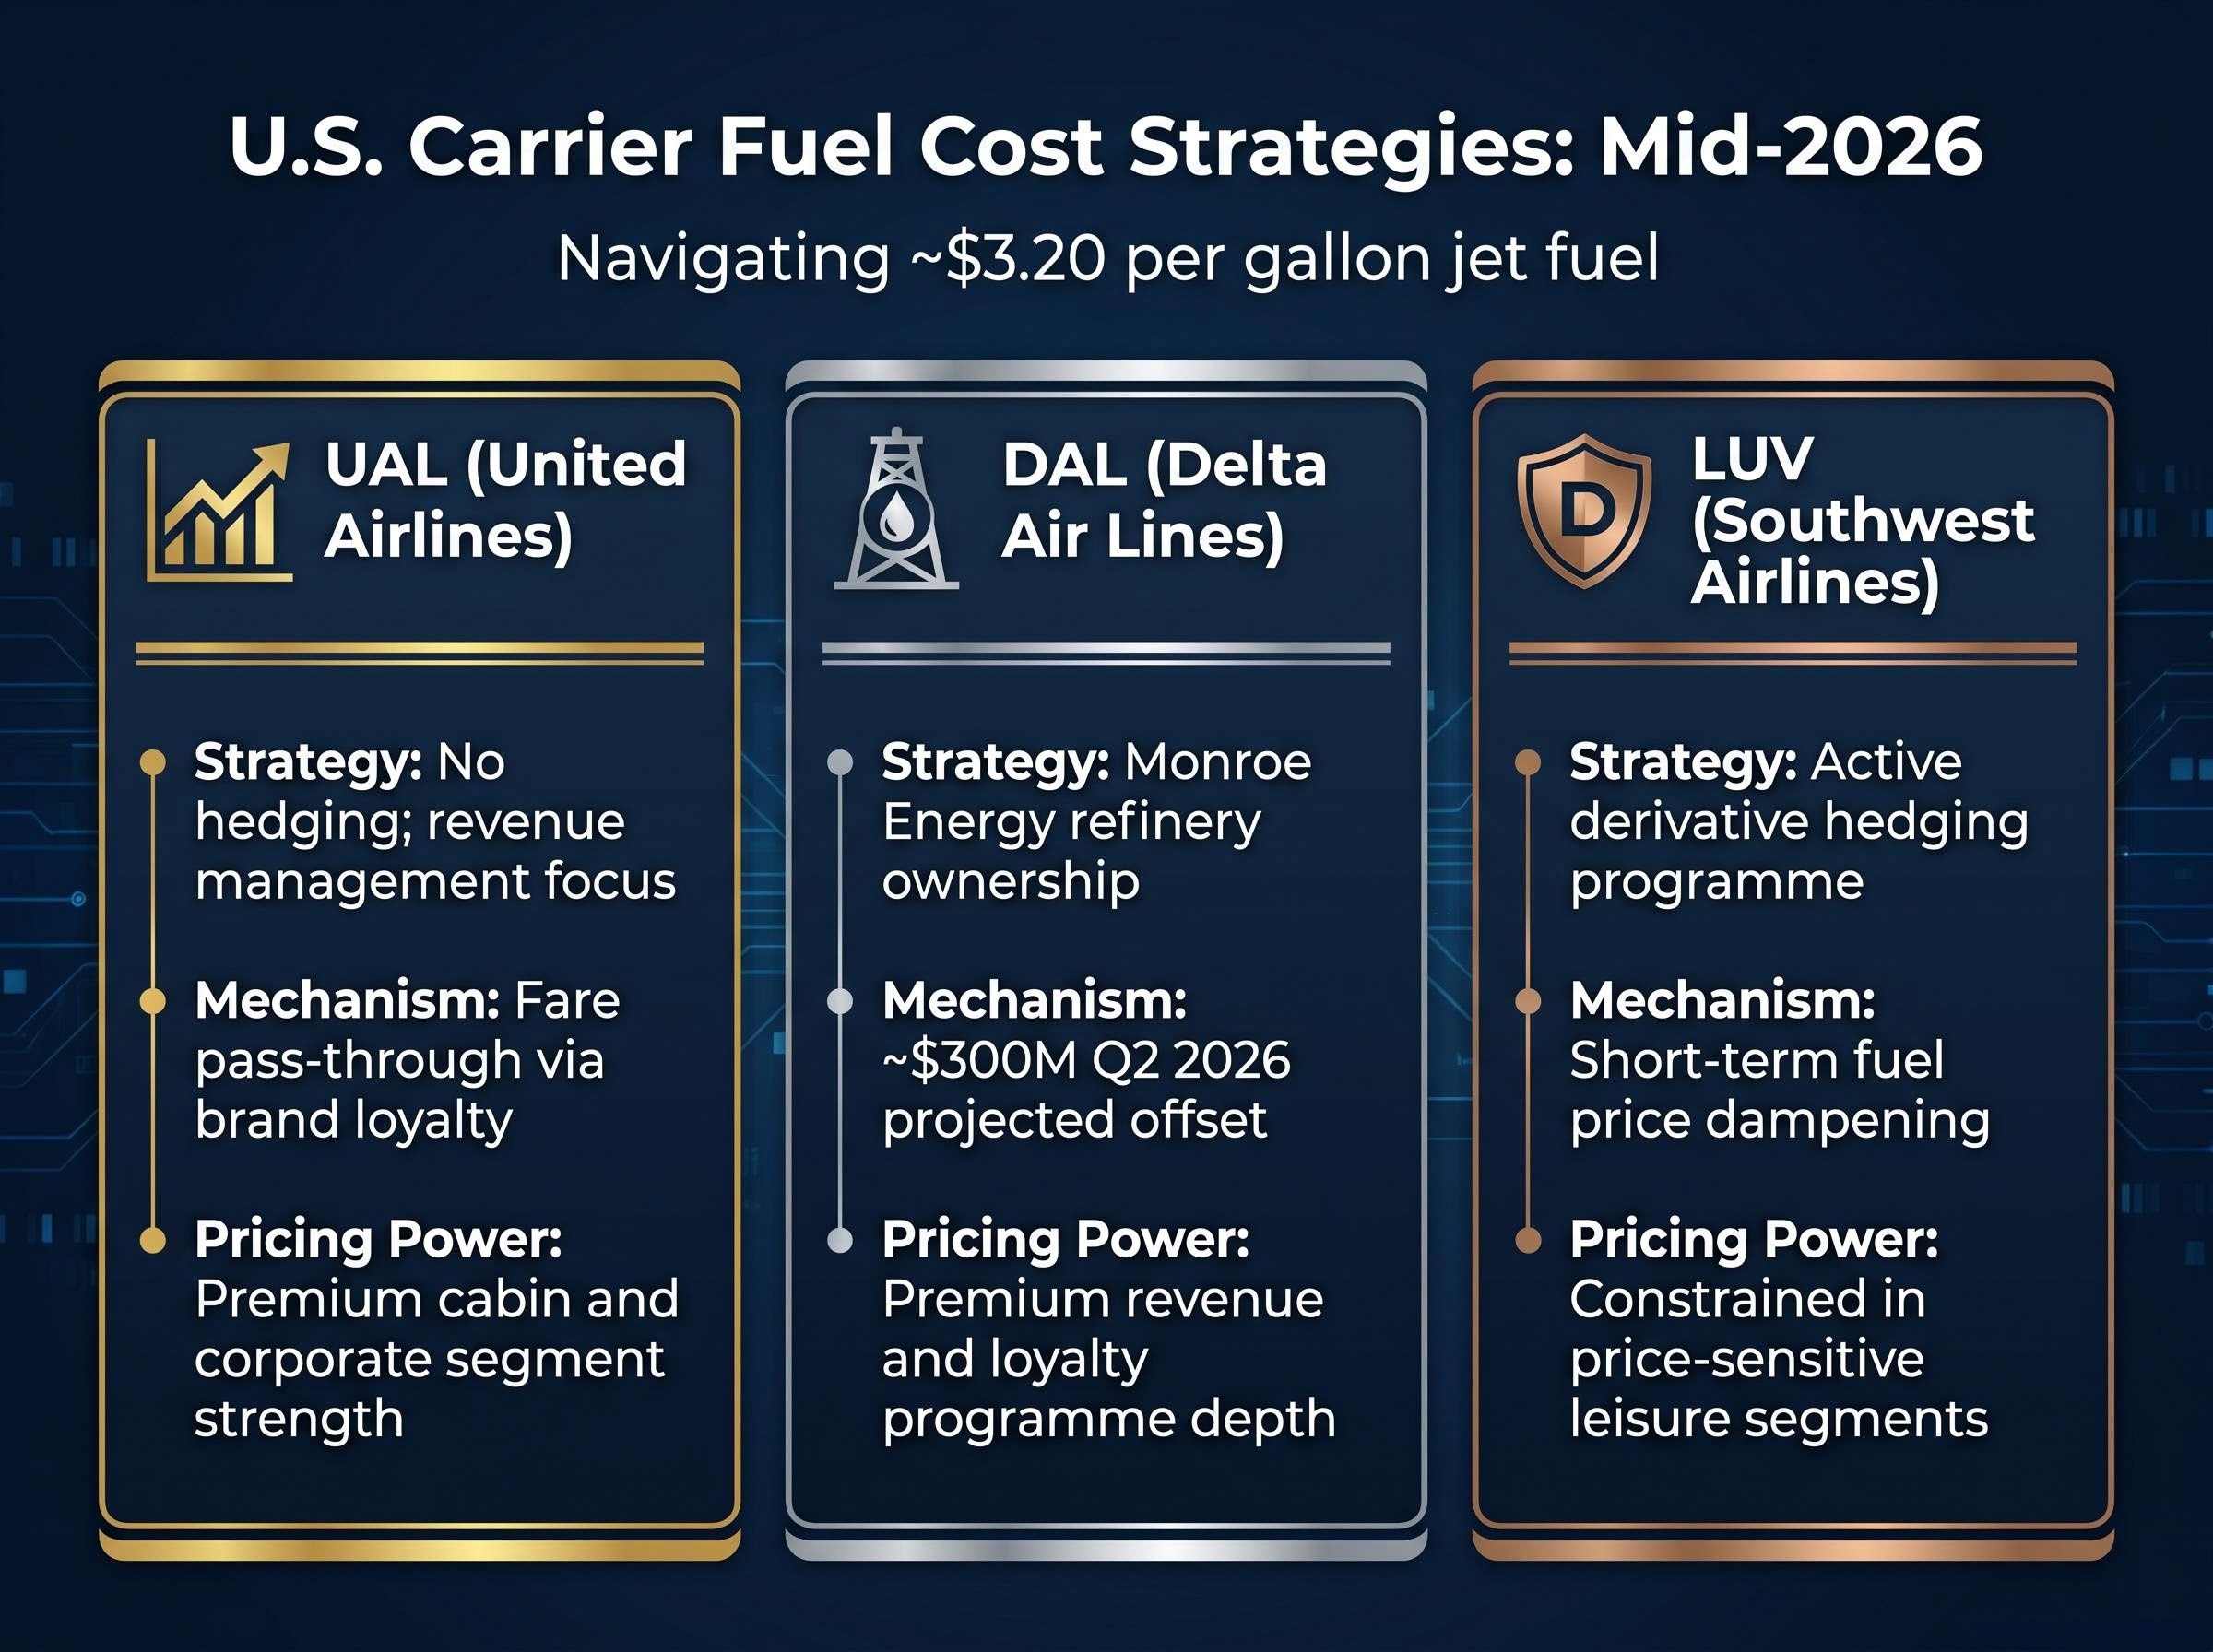
| Carrier | Fuel cost strategy | Cost protection mechanism | Key pricing power characteristic |
|---|---|---|---|
| UAL | No hedging; revenue management focus | Fare pass-through via brand loyalty | Premium cabin and corporate segment strength |
| DAL | Monroe Energy refinery ownership | ~$300M Q2 2026 projected offset | Premium revenue and loyalty programme depth |
| LUV | Active derivative hedging programme | Short-term fuel price dampening | Constrained in price-sensitive leisure segments |
Investors assessing DAL versus UAL on fuel cost exposure need to account for the Monroe Energy offset as a genuine near-term margin differentiator, while recognising that neither hedging nor refinery ownership eliminates the underlying revenue quality question.
The mechanism connecting product investment to fuel cost resilience is specific, and it follows a logic that accumulates rather than announces itself.
Kirby has argued that United’s competitive edge derives from operating profitability funded by sustained investment across four categories:
Each category contributes to a customer relationship where fare increases are absorbed rather than triggering defection. United and Delta’s premium cabin and corporate segment pricing power stands in structural contrast to carriers whose primary competitive tool is a low ticket price.
Kirby pushed back directly against IATA head Willie Walsh’s criticism that large U.S. carriers are crowding out competition, positioning the advantage as earned through investment rather than scale dominance. The argument is that sustained capital deployment into product and service creates a pricing moat that competitors cannot replicate through fare cuts alone.
Qantas provides the international case study in fare pass-through under fuel pressure: doubling its international RASM guidance to 4-6% growth for 2H26 while simultaneously cutting domestic capacity by 5 percentage points, the carrier demonstrated that redeploying capacity toward high-yield routes rather than absorbing costs uniformly is the operational expression of the same pricing moat logic that Kirby describes for United’s premium and corporate segments.
Kirby projected that higher fares will fully offset the financial drag from surging fuel costs by late 2026, citing brand strength and customer loyalty as the primary buffers against fare sensitivity.
Demand, according to United’s management commentary, has held up despite rising ticket prices, with no significant softening materialised through June 2026. For investors, this establishes why United and Delta’s fare recovery trajectory is credibly supported by structural customer loyalty rather than aspirational guidance, a distinction that matters when discounting forward earnings estimates.
Identical fuel price movements produce different margin outcomes depending on carrier type, and the framework for understanding why is more accessible than airline cost accounting might suggest.
Fuel as a percentage of total operating expenses varies meaningfully across the competitive spectrum. Network majors such as United and Delta typically see fuel at 20-30% of total costs under normal conditions. Low-cost carriers carry a similar or slightly higher share, depending on fleet efficiency. Ultra-low-cost carriers such as Spirit Airlines face amplified sensitivity because their entire competitive model depends on maintaining the lowest possible fare, leaving almost no room to pass fuel cost increases through to passengers.
IATA’s June 2026 industry profit outlook places fuel at 31.4% of total operating expenses globally, with fuel costs running nearly 40% above 2025 levels, a cost environment that makes the revenue quality divide between network majors and ultra-low-cost carriers more consequential than at any point in the post-pandemic recovery.
The investor’s operative metric is not any single cost or revenue figure in isolation. It is the spread between two numbers:
A three-step framework for evaluating any carrier’s fuel cost exposure:
Spirit Airlines sits at the vulnerable end of this framework, with high fuel sensitivity, limited pricing power, and ongoing financial stress compounding its exposure. The CASM-RASM spread for carriers in Spirit’s position narrows faster and recovers slower than for network majors with brand-backed fare flexibility.
The analytical case for network majors in a high-fuel environment is coherent. It is also incomplete without addressing the one variable that could fracture it: the point at which fare increases begin to suppress demand.
Kirby acknowledged that no significant demand deterioration had materialised through the period covered by his June 2026 comments, while noting that higher fare levels are eventually expected to produce some degree of softening.
That word, “eventually,” is where the forward risk lives.
In corporate and premium segments, fare increases have been absorbed without significant volume loss. Business travellers booking through negotiated corporate programmes and loyalty-driven frequent flyers represent demand that is structurally less price-sensitive. United’s emphasis on RASM performance in long-haul and business travel reflects confidence that this segment will continue to hold.
The picture is more nuanced in discretionary and leisure markets. Broader 2025-2026 aviation industry commentary characterises U.S. domestic demand as generally resilient, but with some softness appearing in price-sensitive leisure segments. This is the margin where the fare recovery thesis meets its limit.
United projects full cost offset through fares by late 2026, with brand strength and loyalty cited as the primary buffers. Whether that projection holds depends on the speed and magnitude of leisure demand softening, the one variable that management commentary frames as probable but not yet visible in the data.
For investors, the demand elasticity question is where the fuel cost thesis either holds or fractures. Early signals of softening in leisure segments would be the first indication that the fare recovery timeline needs recalibrating.
The preceding analysis points toward a tiered framework for evaluating airline stocks under sustained fuel cost pressure.
| Carrier | Fuel cost strategy | Pricing power tier | Key investor watch metric |
|---|---|---|---|
| UAL | No hedging; revenue management | High (premium and corporate) | RASM trajectory and fare yield in H2 2026 |
| DAL | Monroe Energy refinery offset | High (premium and loyalty) | Monroe per-gallon savings and CASM-ex fuel |
| LUV | Active hedging programme | Moderate (leisure fare constraints) | Hedging realised gains vs fare competitiveness |
| SAVE | No structural buffer | Low (ultra-low-cost model under stress) | Liquidity position and load factor trends |
Three specific metrics to monitor in Q2 and Q3 2026 earnings releases:
A sustained high-fuel environment may also accelerate consolidation or capacity reduction among carriers with limited pricing power. If ultra-low-cost carriers contract operations or exit routes, network majors stand to benefit from reduced competitive pressure on pricing, a second-order effect that could further widen the gap this analysis has described.
For investors wanting to understand how Kirby’s competitive positioning strategy extends beyond fuel cost management into network consolidation, our full explainer on the United Airlines merger collapse covers the abandoned American Airlines deal, United’s pivot toward acquiring gates and slots from distressed competitors, and the structural implications for the big-four carrier landscape through 2026 and beyond.
Fuel costs at $3.20 per gallon are not compressing margins uniformly. They are sorting the U.S. airline industry by the quality of each carrier’s revenue, the depth of its customer loyalty, and the durability of the product investments made over the preceding several years. Carriers that deployed capital into premium product, operational reliability, and loyalty infrastructure are now collecting the return on that investment in the form of pricing power their competitors cannot match.
The specific question this analysis positions investors to answer independently is direct: which carriers in a portfolio have the RASM trajectory and loyalty infrastructure to absorb further fuel cost pressure, and which are exposed if the fare recovery thesis does not fully materialise by Q4 2026?
The filter is running. The separation is measurable. The earnings releases in Q2 and Q3 will show whether the gap is still widening.
This article is for informational purposes only and should not be considered financial advice. Investors should conduct their own research and consult with financial professionals before making investment decisions. Past performance does not guarantee future results. Forward-looking statements, including management projections on fare recovery and demand resilience, are subject to change based on market developments and carrier performance.
Rising fuel prices compress airline margins, but the impact varies significantly by carrier. Airlines with strong brand loyalty and premium pricing power can pass fuel cost increases through to customers via higher fares, while ultra-low-cost carriers with price-sensitive customers face sharper margin deterioration because they have little room to raise ticket prices.
The CASM-RASM spread is the gap between cost per available seat mile (what it costs to fly one seat one mile) and revenue per available seat mile (what that seat earns). This spread represents the airline's margin, and when fuel prices rise, investors should track whether a carrier's RASM growth is outpacing its CASM increase to assess whether margins are expanding or compressing.
Delta Air Lines owns the Trainer refinery in Pennsylvania through its subsidiary Monroe Energy, which offsets approximately 40-50% of Delta's domestic fuel needs. The refinery delivered roughly 11 cents per gallon in savings in 2025 and is projected to provide approximately $300 million in fuel cost offsets in Q2 2026, giving Delta a structural cost advantage over carriers buying entirely at spot prices.
United Airlines CEO Scott Kirby has argued that hedging programmes become structurally self-defeating when they generate net losses over extended periods. United's strategy instead relies on revenue management and brand loyalty to pass fuel cost increases through to customers via higher fares, treating pricing power as the preferred buffer rather than derivative instruments.
Investors should track three key metrics: RASM trajectory to assess whether revenue per seat mile is growing fast enough to absorb fuel cost drag, CASM excluding fuel to identify whether non-fuel cost inflation is compounding the pressure, and for Delta specifically, the Monroe Energy per-gallon savings figure which directly affects its margin differential against competitors.