How to Read Industrial Economic Indicators Like an Analyst
2 hrs ago

The MSCI USA Industrials Index delivered a 10.6% annualised return over the ten years ending 31 March 2025, a track record that positions industrial ETFs as direct competitors to broader equity benchmarks for a place in a diversified US portfolio. The sector spans aerospace and defence, heavy machinery, logistics, construction, and waste management, which means an industrial fund is never a single bet. The four major ETFs tracking this space use different benchmarks, carry meaningfully different expense ratios, and expose investors to different mixes of large-cap and mid-cap names. Choosing among them without a framework can mean paying five times more in fees for a product that is structurally similar to a cheaper alternative, or inadvertently concentrating a portfolio in one subsector.
This guide lays out what the long-run benchmark returns actually show, compares the four primary funds across AUM, cost, holdings, and performance, examines the macro tailwinds and headwinds active in 2025, and provides a practical decision framework so readers can match the right fund to their portfolio role and conviction level.
The numbers are reassuring. As of 31 March 2025, the MSCI USA Industrials Index posted a 5-year annualised return of 11.2% and a 10-year annualised return of 10.6%, according to MSCI factsheet data published in April 2025.
The MSCI USA Industrials Index has delivered a 10.6% annualised return over ten years ending March 2025, placing the industrial sector broadly in line with wider US equity benchmarks over the same horizon.
Those figures place the industrial sector roughly on par with broader US equity benchmarks over the same period, which frames the risk-reward proposition: investors are not paying a volatility premium for dramatically higher returns, nor are they accepting significantly lower performance for sector concentration.
The composition of the index explains both the stability and the ceiling of that return history. As of April 2026, the MSCI USA Industrials Index held 89 constituents with a median market capitalisation of $42.17 billion. This is a large-cap-weighted, diversified slice of the sector, not a concentrated thematic bet. That breadth smooths returns over full cycles but also means the index is unlikely to capture the outsized gains (or losses) of a narrower subsector play.
The MSCI USA Industrials Index factsheet confirms an 89-constituent universe with a median market capitalisation of $42.17 billion, figures that reflect how deeply large-cap names dominate the benchmark and why tracking funds built on this index carry relatively modest idiosyncratic risk.
Understanding what the benchmark has historically delivered prevents investors from chasing recent one-year outperformance without context.
The label “industrial sector” covers a remarkably wide range of businesses. Two funds both marketed as industrial ETFs can feel very different in a portfolio depending on how their benchmarks weight the subsectors underneath.
The major subsectors include:
Companies such as Honeywell, Union Pacific, Caterpillar, 3M, and Boeing all sit within this sector, yet they respond to different economic drivers. A surge in defence spending lifts Boeing and the aerospace names. A housing construction boom benefits machinery and lumber producers. A freight slowdown pressures logistics operators while waste management firms continue generating relatively stable revenue.
That subsector diversity is precisely why benchmark weighting within a fund matters. An investor whose macro thesis centres on infrastructure spending needs a fund weighted toward construction and machinery, not one tilted heavily toward airlines or freight carriers.
Industrial businesses move through four distinct growth phases: accelerating growth, decelerating growth, accelerating decline, and decelerating decline. Firms in the accelerating growth or decelerating decline phases tend to attract higher valuations because investors price in improving conditions ahead.
Several subsectors, including aerospace and homebuilding, have historically experienced extended bullish expansions lasting multiple years before reversing. By contrast, industrial conglomerates and waste management operations tend to generate more consistent revenue streams with less pronounced cyclicality.
This distinction matters for fund selection. A broad industrial ETF blends both types of business, smoothing the ride. A subsector fund concentrates the investor in one phase of the cycle, amplifying both the upside and the drawdown risk.
Four funds dominate broad US industrial sector exposure, and each has a distinct character worth understanding before comparing the numbers.
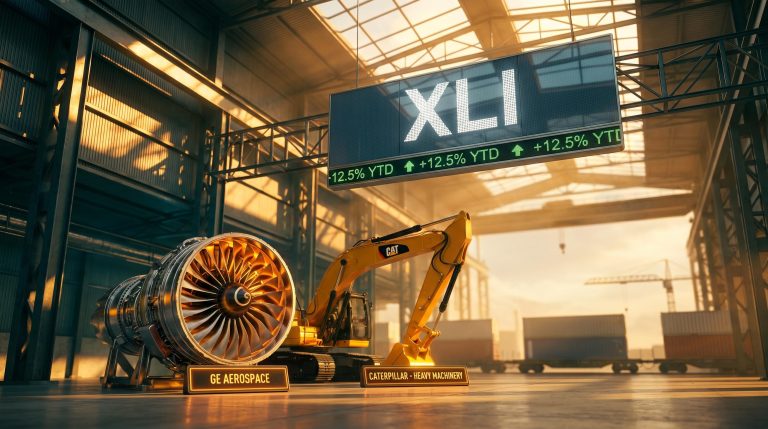
XLI (State Street) is the largest by assets under management at $22.3 billion. It tracks the S&P 500 Industrials Select Sector Index, meaning it holds only S&P 500 constituents, large-cap names exclusively, with no mid- or small-cap exposure. Its trading volume is the highest of the four, producing tight bid-ask spreads that matter for investors placing market orders.
VIS (Vanguard) manages $5.9 billion and tracks the MSCI US IMI Industrials 25/50 Index. The “IMI” designation is significant: it includes mid- and small-cap stocks alongside large-caps, giving VIS the broadest coverage of the four funds.
FIDU (Fidelity) is smaller at $1.6 billion but carries the lowest expense ratio of the group at 0.08%. It tracks the MSCI USA Industrials Index, making it the cost-optimised option for long-term buy-and-hold investors.
IYJ (BlackRock) holds $1.9 billion in assets and tracks the Dow Jones U.S. Industrials Index. It charges 0.40%, the highest fee of the four.
The following table summarises fund sponsor data as of 31 March 2025. Minor discrepancies exist between fund sponsor and Morningstar figures; fund sponsor data is used as primary.
| ETF Ticker | AUM | Expense Ratio | 1-Year Return | 3-Year Ann. Return |
|---|---|---|---|---|
| XLI | $22.3B | 0.10% | 18.7% | 8.9% |
| VIS | $5.9B | 0.10% | 19.4% | 9.3% |
| FIDU | $1.6B | 0.08% | 19.2% | 9.0% |
| IYJ | $1.9B | 0.40% | 20.1% | 9.5% |
The returns cluster within a narrow band. The spread between the highest one-year return (IYJ at 20.1%) and the lowest (XLI at 18.7%) is just 1.4 percentage points. Three-year annualised figures show an even tighter range.
FIDU charges 0.08% versus IYJ’s 0.40%, a fivefold cost difference. Over a long holding period, that gap compounds meaningfully, even though recent return figures are broadly comparable.
Fee drag over long holding periods is deducted silently from net asset value each day, meaning investors never see a line-item charge, yet the 0.32 percentage point gap between FIDU and IYJ compounds into a material wealth difference over a 20-30 year holding period without any market downturn required.
The four funds are more similar than different on returns. They diverge on cost, benchmark construction, and liquidity, which are the variables actually within an investor’s control.
Aerospace and defence ETFs have posted strong recent performance, outperforming broad industrial funds over the one-to-three-year periods ending early 2024, according to Morningstar analysis from June 2024. Rising US and NATO defence budgets have driven demand for contractors, and the returns reflect that tailwind.
The three primary subsector alternatives are:
Barron’s noted in February 2025 that defence-focused ETFs “behave more like thematic plays on geopolitics,” while broad industrial ETFs spread exposure across logistics, construction, and capital goods, offering a smoother ride over a full cycle. CFRA Research characterised aerospace and defence ETFs as “overlays” tied to defence-spending cycles in its March 2025 sector strategy report.
The tension is real: subsector funds have delivered higher recent returns, but that performance comes with higher concentration risk and sensitivity to geopolitical events rather than economic cycles.
Concentration risk in thematic funds is not hypothetical: technology-themed ETFs fell by up to 25% during 2026’s sector rotation while diversified industrial and resources funds gained, illustrating that the same behavioural pattern the article cautions against in defence ETFs applies across every narrow thematic allocation.
CFRA’s practical guidance is straightforward. Before adding ITA or XAR, review the top 10 holdings of the broad fund first. Aerospace and defence is already a meaningful weight in XLI and similar broad industrial ETFs. Holding both without adjusting can inadvertently double up on the largest defence contractors.
Defence sector valuations had reached forward P/E multiples of roughly 24x by May 2026, approximately 10-20% above five-year historical averages and above the broader S&P 500, which adds a valuation dimension to the overlap consideration: investors adding ITA or XAR on top of a broad industrial fund may be compounding exposure at the point of maximum pricing.
The Wall Street Journal recommended in January 2025 treating sector ETFs as cyclical tools rather than permanent core positions, and monitoring how the industrial bet interacts with value and small-cap style tilts in the broader portfolio. ETF.com and CFRA both endorse a core-and-satellite approach: broad industrial ETFs as the core position, with subsector funds sized modestly for investors with specific conviction.
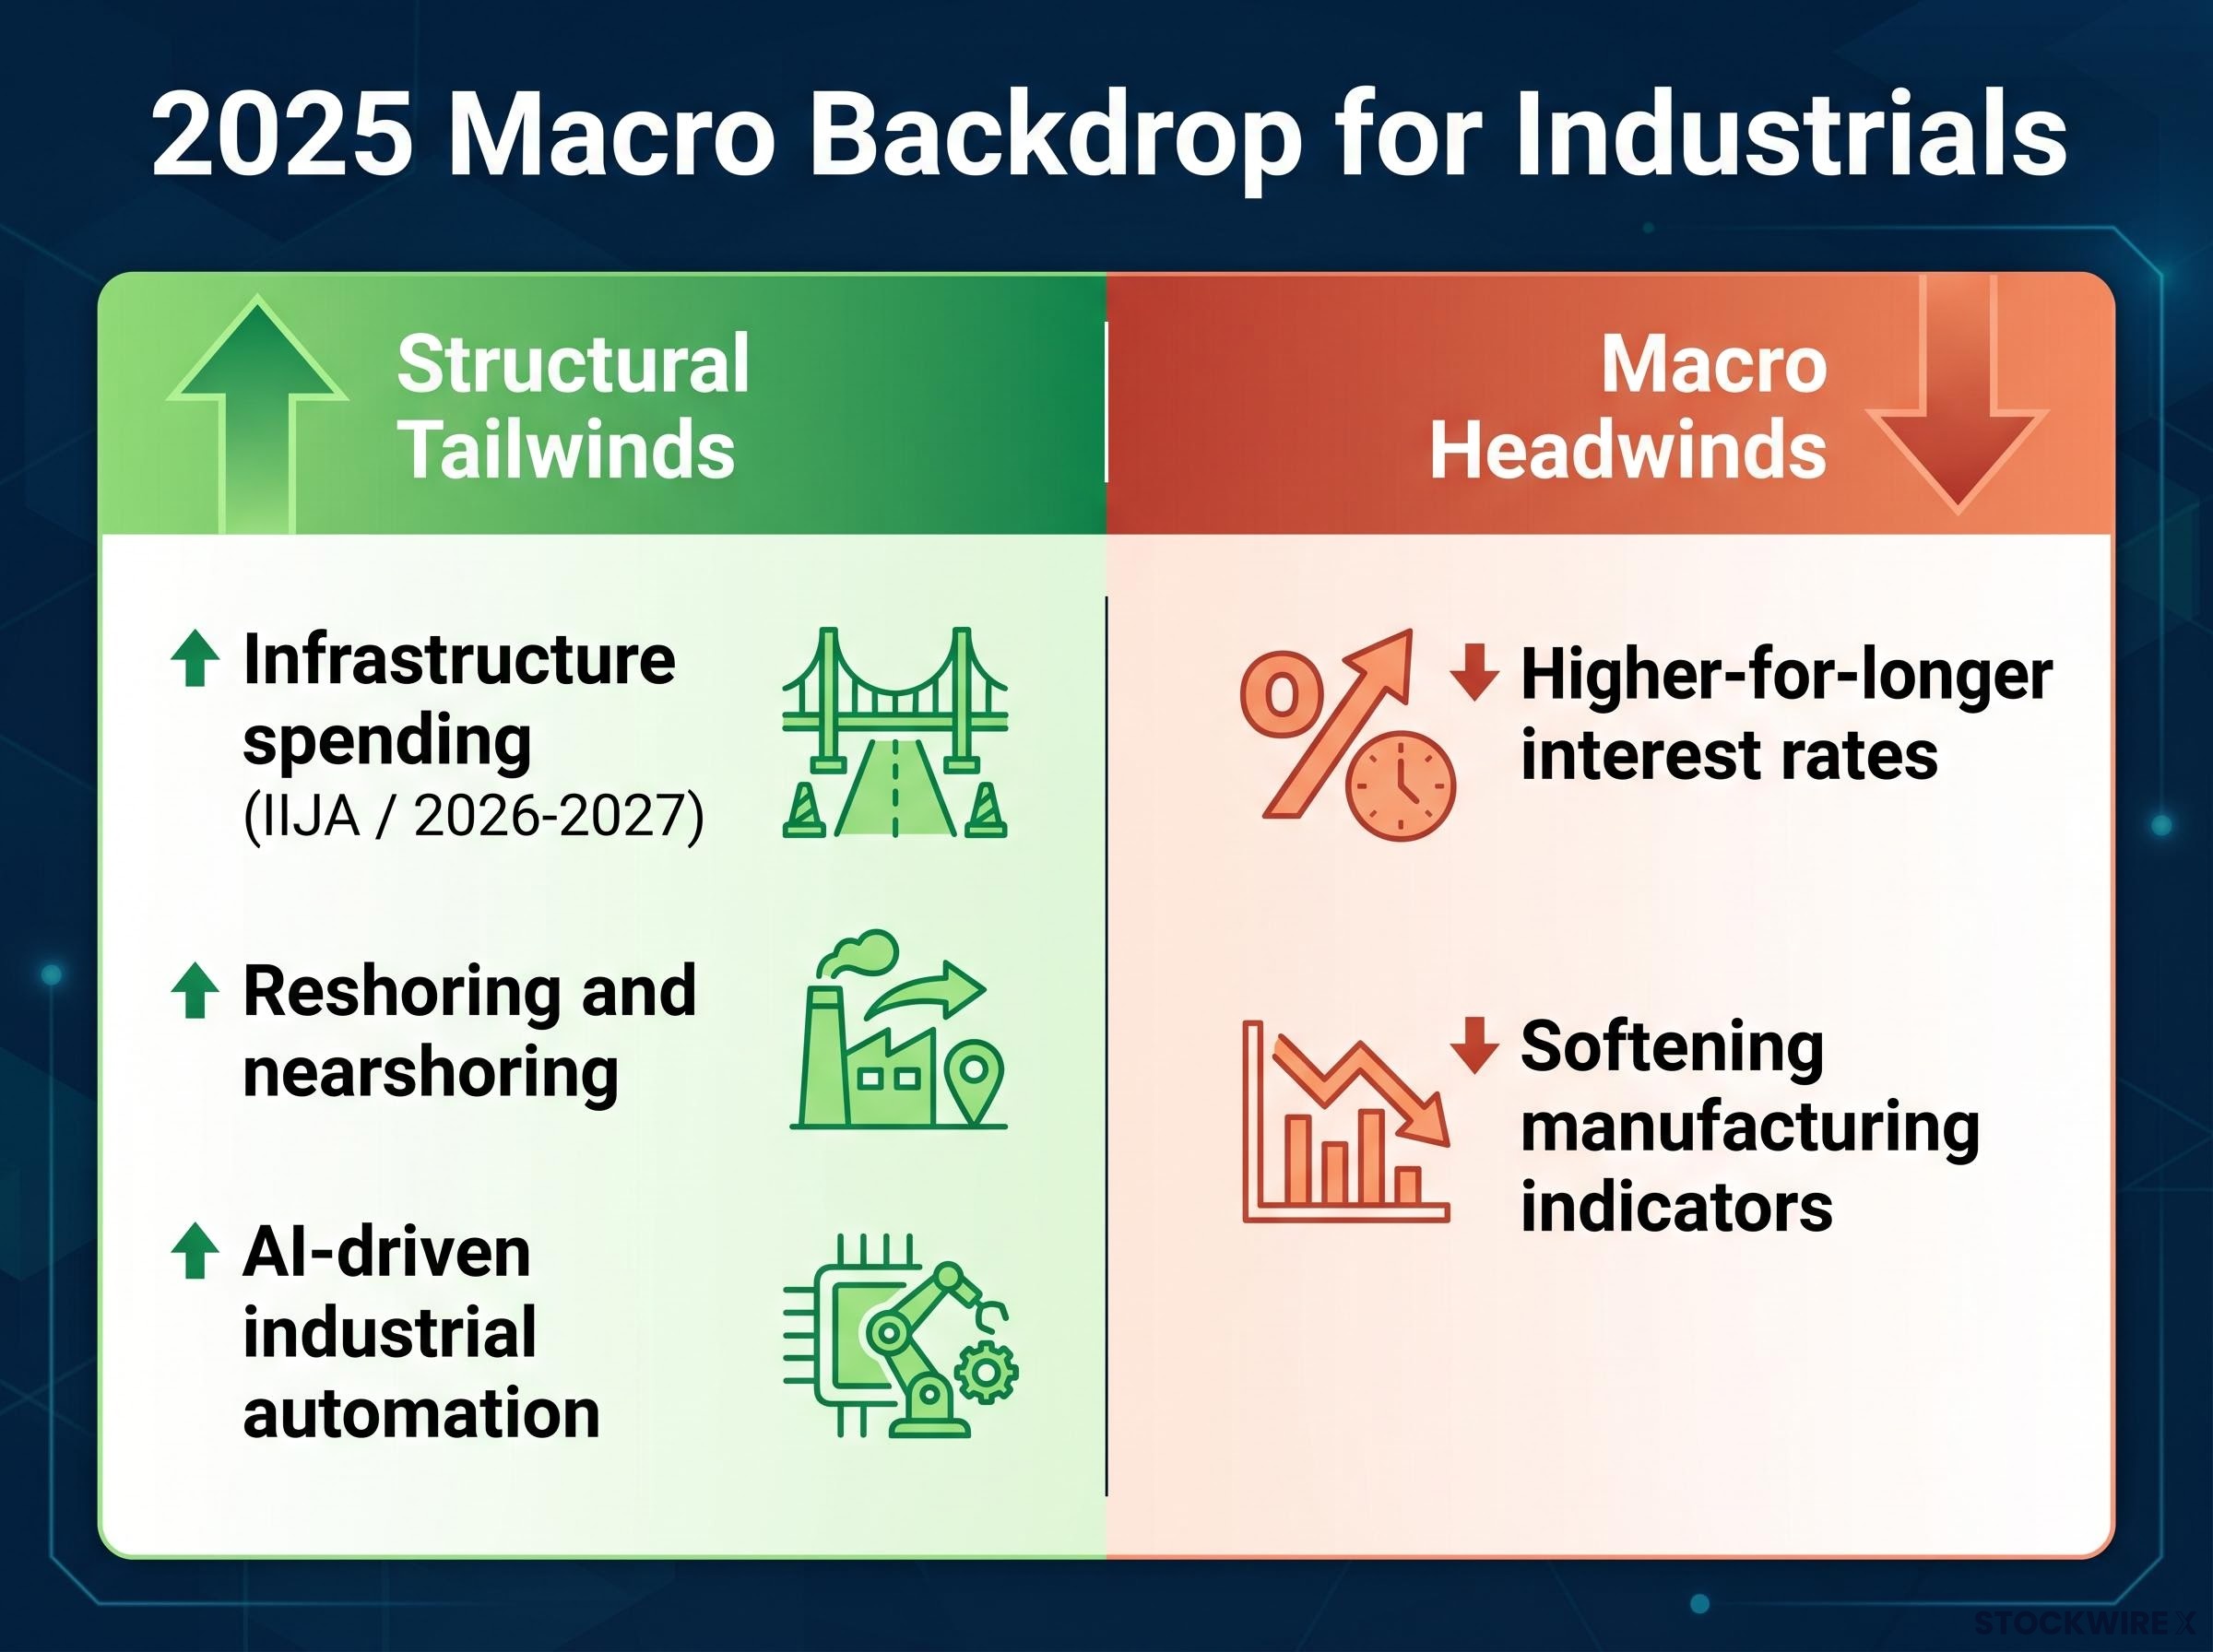
Three structural tailwinds support the sector’s medium-term outlook:
Two headwinds deserve equal weight:
Defence spending acts as a tailwind for the aerospace and defence subsector within broad funds but also presents the double-edged positioning consideration covered in the previous section. Investors who already hold a broad industrial ETF have some defence exposure built in.
The structural tailwinds support a multi-year positive backdrop, but trailing returns were partly driven by specific conditions that may not persist at the same intensity. Past performance does not guarantee future results, and financial projections remain subject to market conditions and various risk factors.
Start with the highest-stakes question: what role does this fund play in the portfolio? An investor adding a broad-market industrial allocation as a core equity position needs a different product than one making a targeted sector bet based on a specific macro thesis around infrastructure or defence.
Evaluate the four leading funds in this order:
The SEC investor guidance on ETF expense ratios quantifies how even small annual fee differences reduce net returns through compounding over multi-decade holding periods, making FIDU’s 0.08% figure materially significant for investors with horizons extending beyond five years.
Vanguard’s October 2024 investor guide advises that sector funds should generally represent a minority slice of an investor’s equity allocation, with a focus on long-term goals rather than attempting to time the industrial cycle.
Three investor archetypes point toward three different funds. The cost-focused long-term holder seeking minimal tracking error fits best with FIDU. The investor wanting the broadest US industrial exposure including mid- and small-cap names is better served by VIS. The investor prioritising maximum liquidity and the largest fund by AUM for easy entry and exit is best matched with XLI.
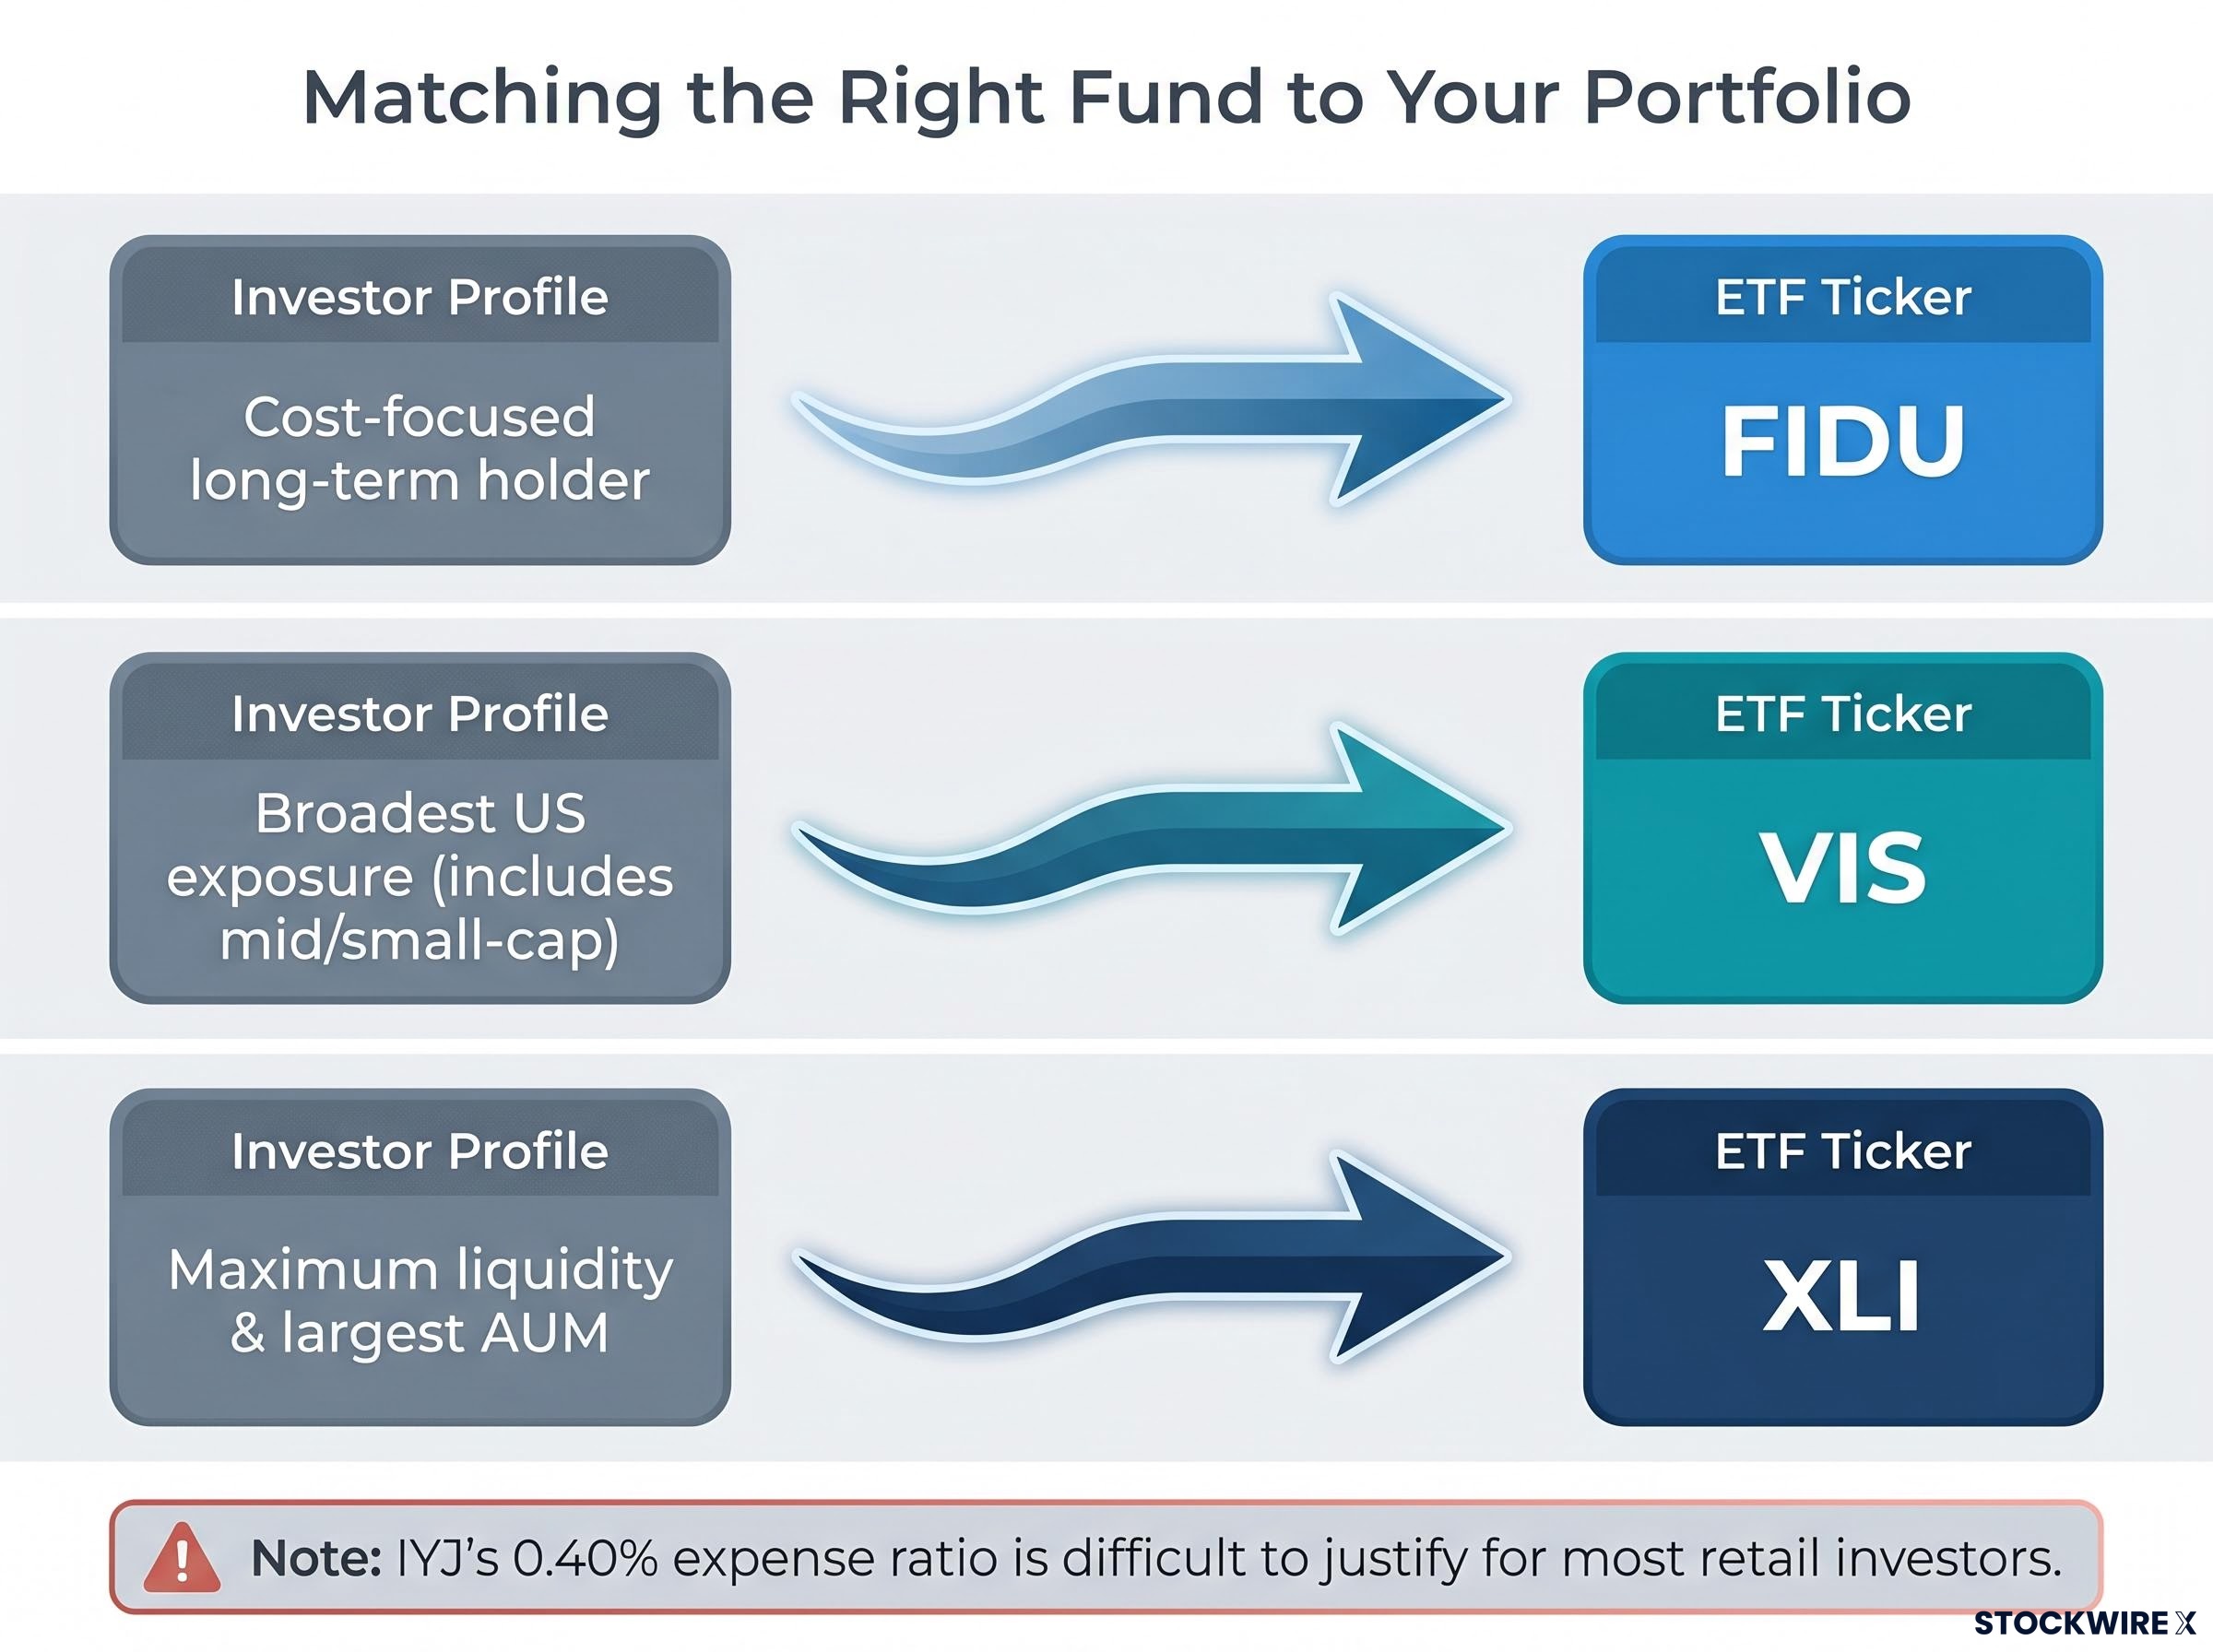
IYJ’s 0.40% expense ratio is difficult to justify for most retail investors when FIDU, VIS, and XLI all deliver comparable exposure at a fraction of the cost.
The MSCI USA Industrials Index’s 10.6% ten-year annualised return reflects a full cycle of economic conditions, including periods of rate pressure and manufacturing slowdowns. That track record makes industrial sector funds a durable long-run holding rather than a short-term trade.
The decision hierarchy is straightforward: establish the portfolio role first, then evaluate benchmark construction and cap-range coverage, then cost, then liquidity. CFRA’s annual review of top holdings and subsector breakdown keeps the position aligned with the original investment thesis over time.
Structural tailwinds from infrastructure spending, reshoring, and industrial automation support a multi-year positive backdrop for the sector. Investors should size industrial ETF positions in proportion to their overall equity allocation rather than treating recent performance as justification for overweighting.
This article is for informational purposes only and should not be considered financial advice. Investors should conduct their own research and consult with financial professionals before making investment decisions.
An industrial ETF is a fund that tracks the industrial sector of the stock market, covering businesses such as aerospace and defence, heavy machinery, transportation and logistics, construction, waste management, and manufacturing. These funds provide diversified exposure across multiple subsectors rather than concentrating on a single industry.
XLI is the largest fund at $22.3 billion and holds only S&P 500 large-cap industrials, VIS includes mid- and small-cap stocks for the broadest coverage, FIDU offers the lowest expense ratio at 0.08%, and IYJ charges the highest fee at 0.40% while tracking the Dow Jones U.S. Industrials Index.
FIDU charges 0.08% versus IYJ's 0.40%, a fivefold cost difference that compounds significantly over a 20-30 year holding period even though recent return figures across the four funds are broadly comparable, with one-year returns clustered within a 1.4 percentage point range.
Three structural tailwinds support the sector: infrastructure spending from the Infrastructure Investment and Jobs Act moving into project execution, a multi-year reshoring and nearshoring capital expenditure cycle identified by Goldman Sachs, and AI-driven industrial automation raising manufacturing productivity across equipment and sensor producers.
Broad industrial ETFs spread exposure across logistics, construction, and capital goods for a smoother ride over a full cycle, while subsector funds like ITA or XAR behave more like thematic plays on geopolitics and carry higher concentration risk; analysts at CFRA and ETF.com recommend a core-and-satellite approach with broad funds as the foundation.