
UBS Warns Markets Are Underpricing ECB Hikes Beyond June
13 mins ago

June is the only calendar month in which the ASX 200 has finished higher less than half the time since 1980. The average price return of -0.40% and a positive hit rate of just 43% make it, statistically, the most consistently negative month on the Australian equity calendar. Yet the last eight years have looked nothing like that long-run record, and the index enters June 2026 at 8,731.70 on a 12-month forward price-to-earnings ratio of roughly 16.7x, well above the long-run average of 14.9x, while consensus earnings forecasts for FY26 and FY27 sit at double-digit growth. That is an unusual combination to carry into history’s weakest month. What follows is an assessment of whether the historical June pattern is a meaningful signal for 2026, or whether current conditions make it a poor guide, along with the specific variables to watch across the month.
The numbers are unusually clear. Since 1980, June has delivered the following record on the S&P/ASX 200:
“June is the only calendar month where the ASX 200 has historically finished higher less than half the time.”
The gap between the price-return and total-return readings matters. Dividends soften the picture considerably, and investors measuring portfolio outcomes on a total-return basis see a less alarming record. On a price basis, however, the pattern is unambiguous.
What makes the statistic more notable is how little attention it receives. Seasonal commentary in Australian markets tends to cluster around May (“sell in May”) and September, leaving June’s weaker record underappreciated. Investors positioning for the month without awareness of this base rate are making decisions with incomplete context.
Seasonal caution in Australian equities has attracted renewed attention in 2026 given that the May to October six-month window averages only 0.37% against 5.78% for the November to April period, a disparity that frames the June entry point within a wider half-year pattern that typically favours defensive positioning.
The long-run average obscures what has actually happened in recent years. The table below shows every June return from 2015 to 2025, on both a price and total-return basis.
| Year | XJO (Price Return) | XNT (Total Return) |
|---|---|---|
| 2015 | -5.51% | -5.36% |
| 2016 | -2.70% | -2.52% |
| 2017 | -0.05% | +0.11% |
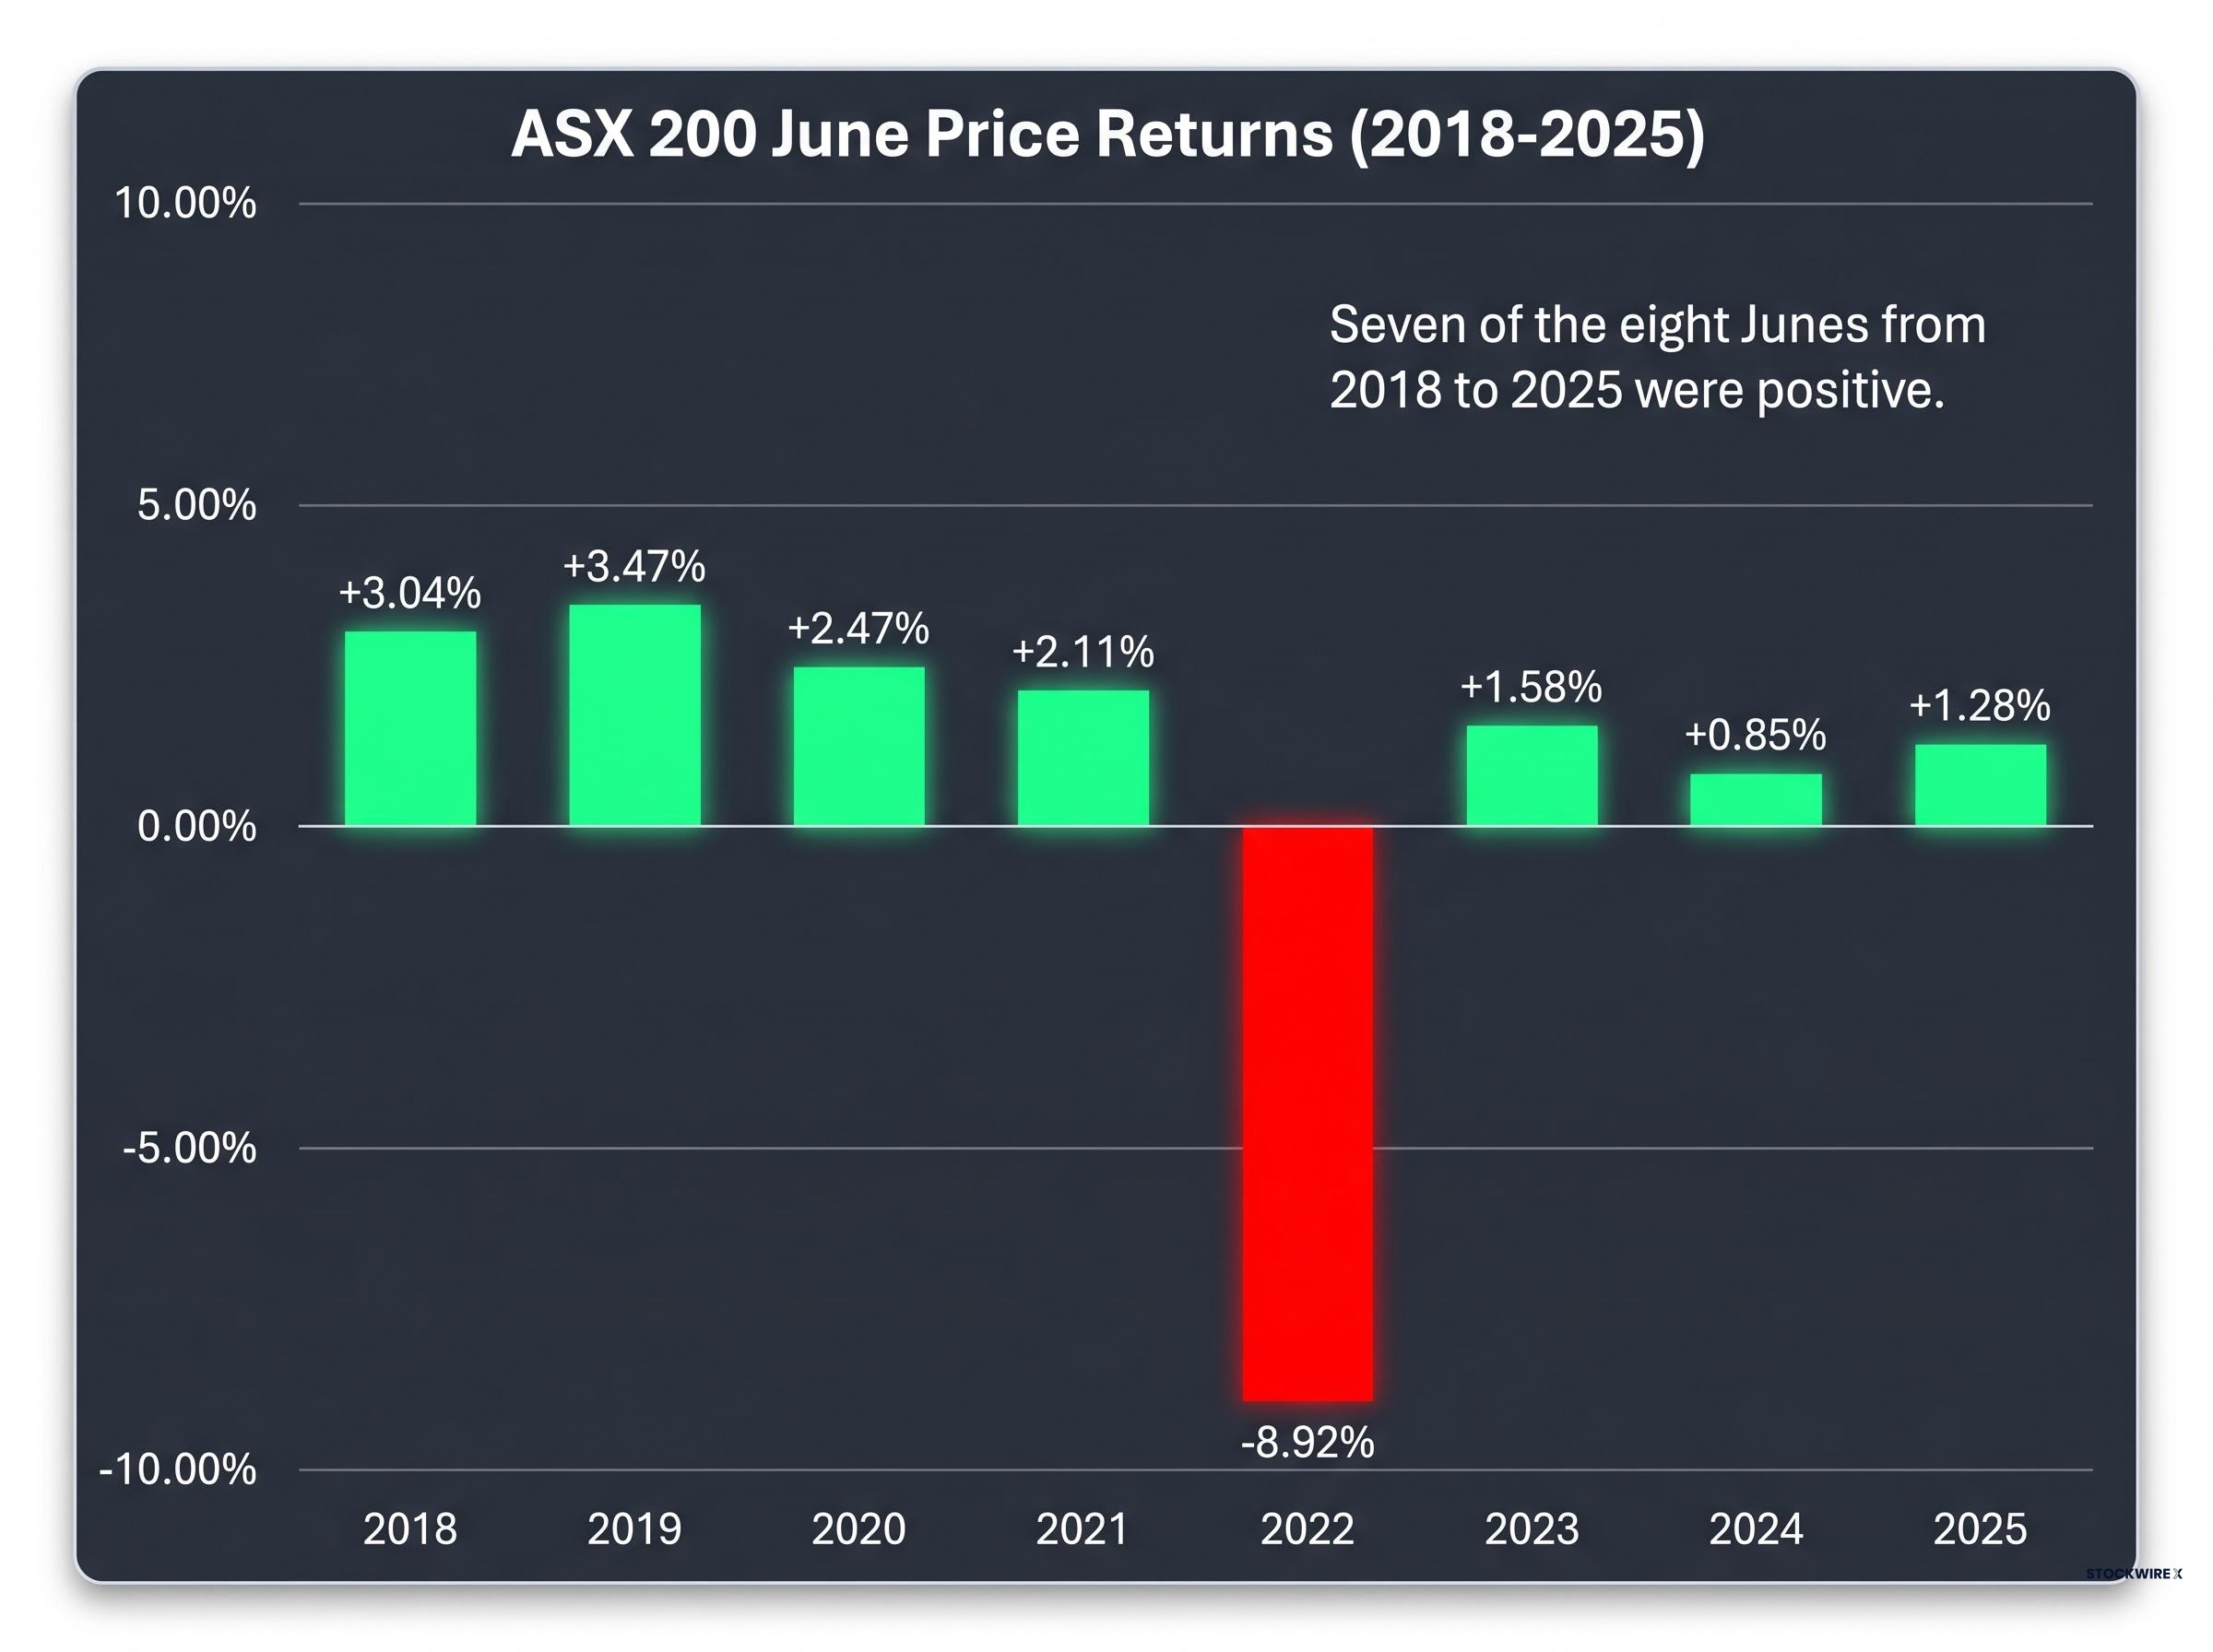
| 2018 | +3.04% | +3.20% |
| 2019 | +3.47% | +3.64% |
| 2020 | +2.47% | +2.57% |
| 2021 | +2.11% | +2.22% |
| 2022 | -8.92% | -8.81% |
| 2023 | +1.58% | +1.71% |
| 2024 | +0.85% | +0.97% |
| 2025 | +1.28% | +1.38% |
Seven of the eight Junes from 2018 to 2025 were positive. The sole exception, June 2022, was not a marginal miss; it was a -8.92% drawdown driven by aggressive global rate-hiking cycles and broad risk-off sentiment. That single month does significant work in keeping the long-run average anchored in negative territory.
Strip out 2022, and the recent June record has been materially better than the 45-year baseline. Whether an investor should weight the long-run pattern or the recent trend depends entirely on whether the conditions that produced the 2022 outlier are present today.
The historical weakness is not random. Four structural forces tied to Australia’s 30 June fiscal year-end create recurring selling pressure each June:
These mechanics are distinct to the Australian market. The 30 June fiscal year-end creates a local seasonal dynamic that does not apply to US or European equities on the same calendar.
Published calendar seasonality research in Australian equities identifies tax-loss selling and window dressing around the 30 June fiscal year-end as statistically significant contributors to the May-June anomaly, providing an academic foundation for the structural mechanics that underpin the index’s historical June weakness.
The mechanics have not disappeared. They exist every June. But their magnitude depends on whether the broader environment reinforces or overwhelms them.
The 2018-2021 window saw supportive or stable macro conditions: accommodative central bank policy, recovering global growth, and periods of strong commodity demand. In that environment, the structural selling pressure was insufficient to drive negative monthly outcomes. June 2022 was the inverse: a synchronised global tightening cycle amplified every end-of-financial-year headwind. The mechanics matter most when the macro environment runs in the same direction.
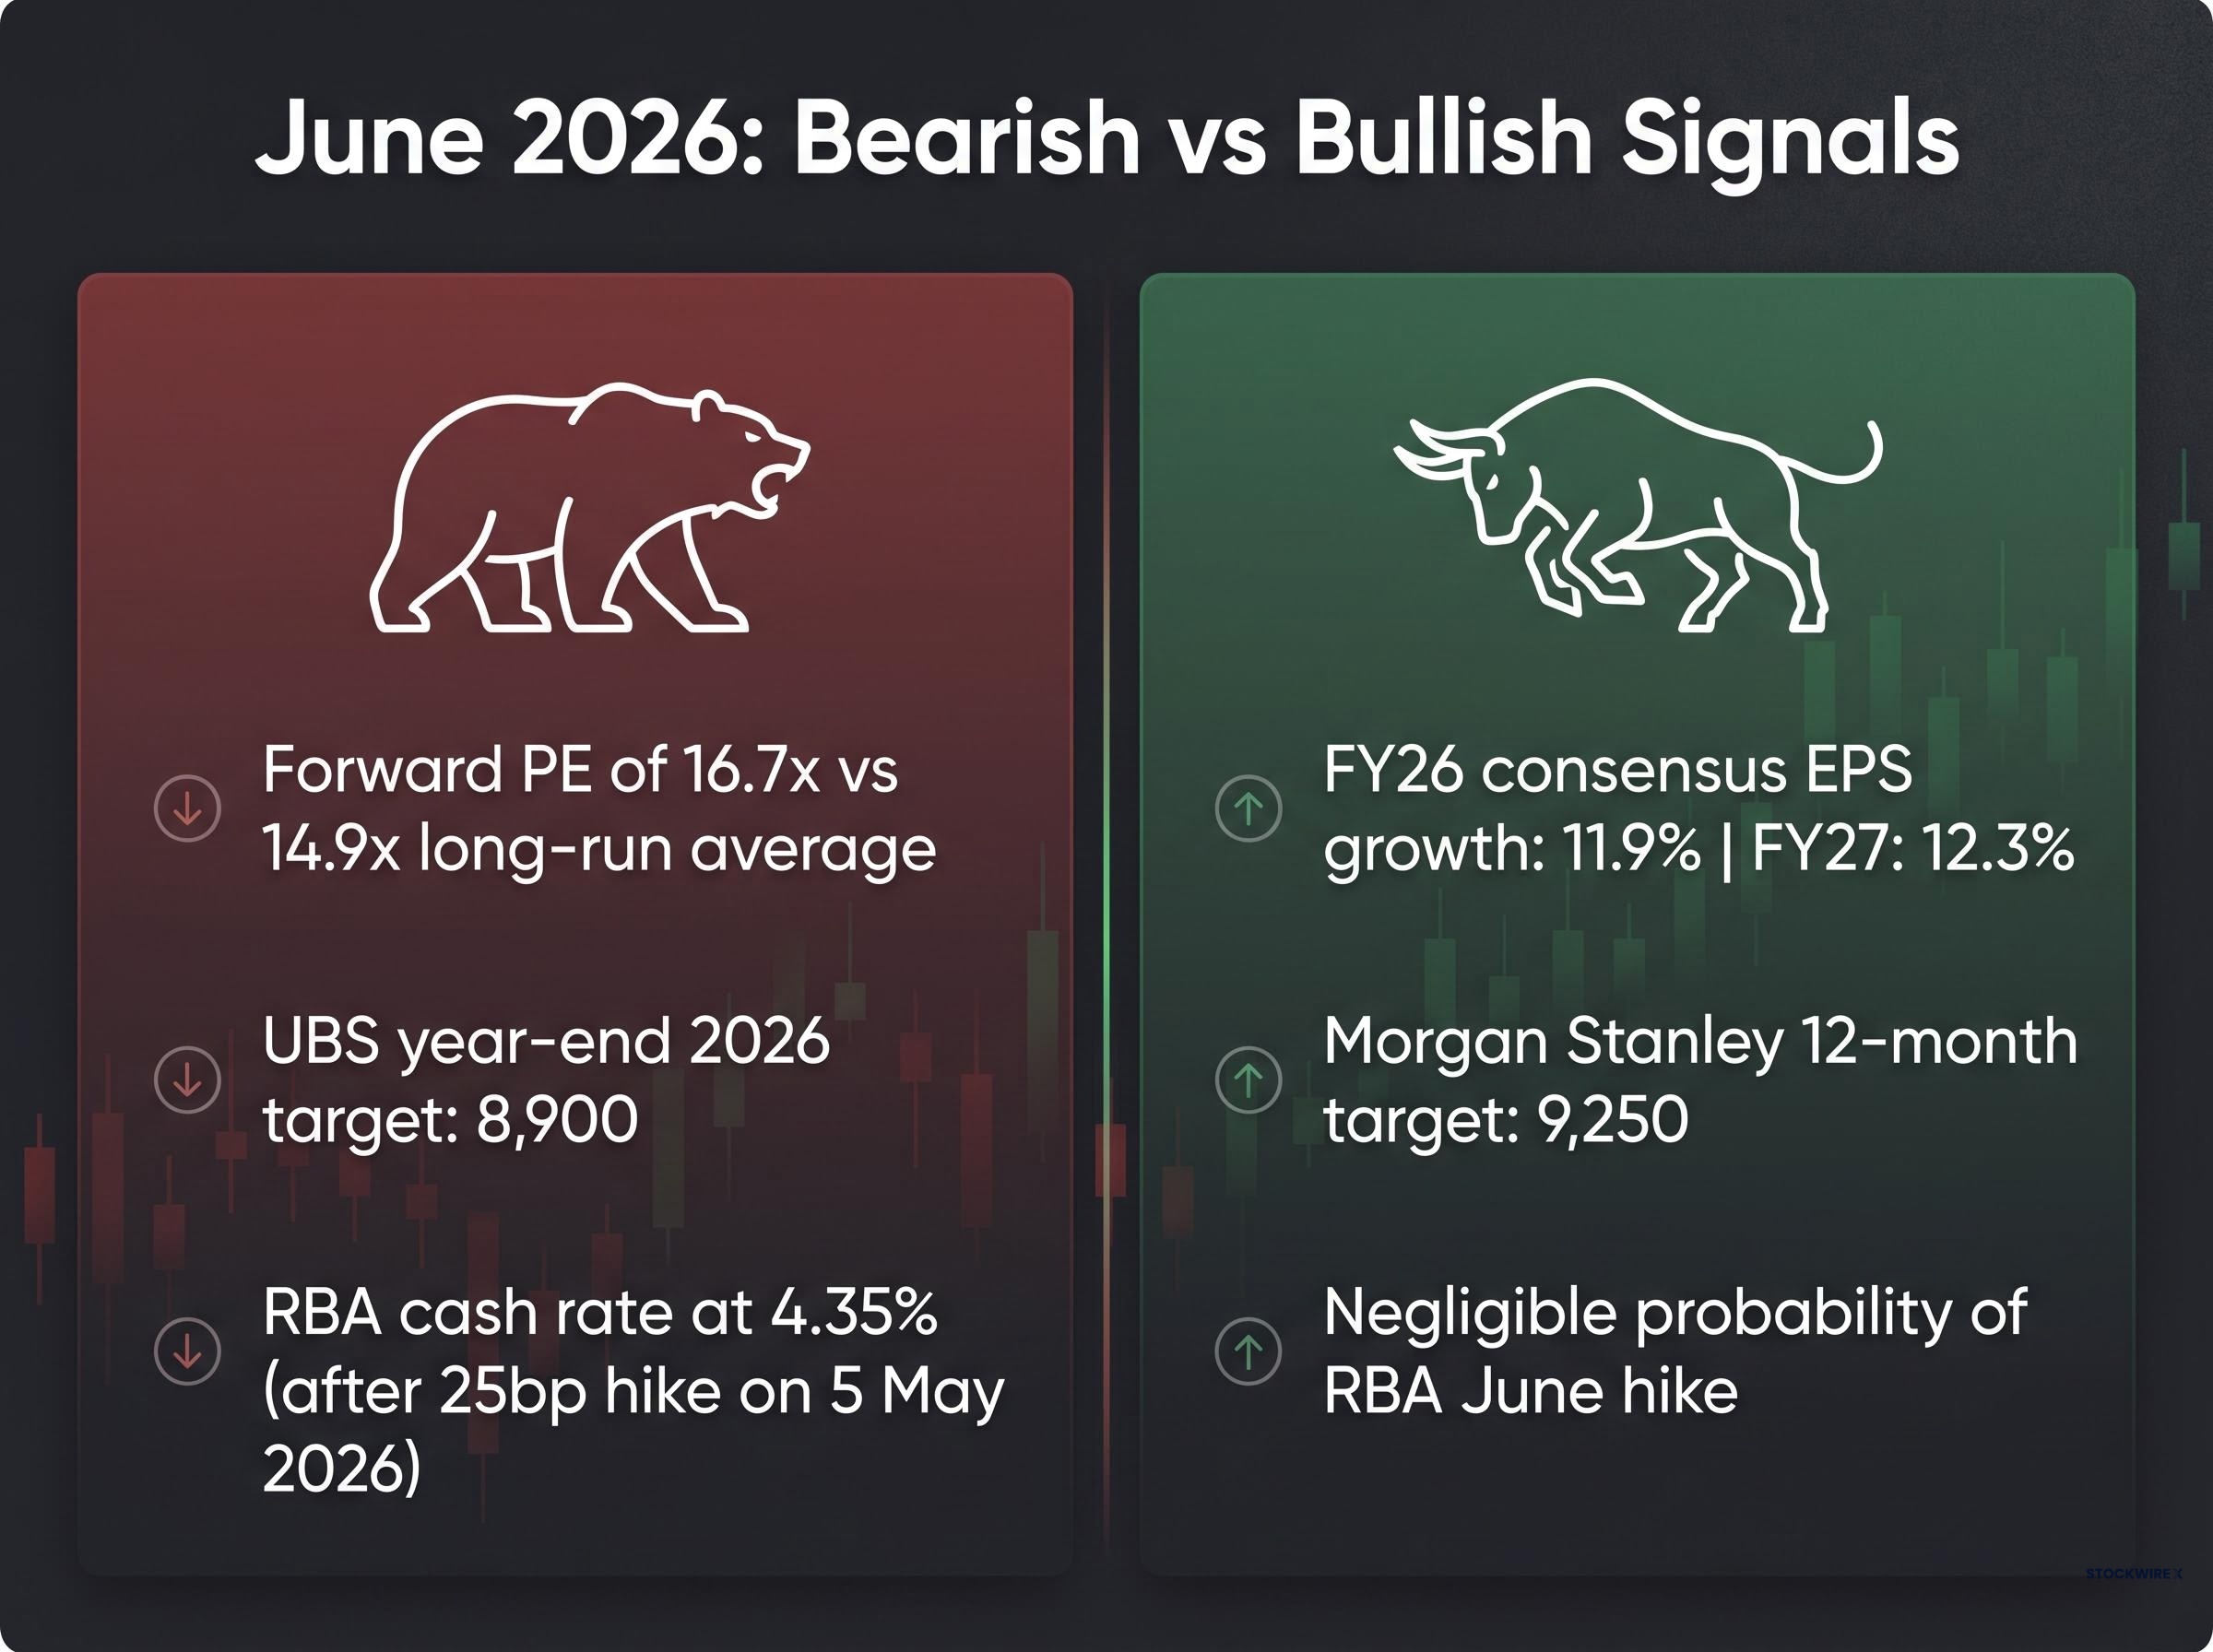
The tension heading into June 2026 is that the strongest bullish and bearish signals are arriving simultaneously.
| Factor | Bearish signal | Bullish signal |
|---|---|---|
| Valuation | Forward PE of ~16.7x versus 14.9x long-run average | Earnings growth may justify the premium |
| Earnings growth | Stretched multiples leave less margin for error | FY26 consensus EPS growth: 11.9%; FY27: 12.3% |
| Broker targets | UBS year-end 2026 target of 8,900 implies limited upside | Morgan Stanley 12-month target: 9,250 (~8% upside) |
| RBA trajectory | Cash rate at 4.35% after 25bp hike on 5 May 2026 | Market pricing shows negligible probability of a June hike |
Morgan Stanley has characterised the ASX 200 as “fully valued but supported by earnings growth.”
That framing captures the dilemma precisely. The index is not cheap; at 16.7x forward earnings, it sits well above the 14-year average of 14.9x. But the earnings trajectory underneath, 11.9% growth in FY26 and 12.3% in FY27, provides a rationale for paying the premium if forecasts hold.
The ASX 200 earnings delivery risk is unusually concentrated in this cycle, with approximately 10 percentage points of the FY26 EPS growth forecast attributable to resources alone, meaning a single commodity demand shock from China could unwind the earnings rationale that currently justifies the 16.7x forward multiple.
The single most significant intra-month catalyst is the RBA decision on 16 June 2026. The cash rate was raised 25 basis points to 4.35% on 5 May 2026, and market pricing as of late May showed negligible probability of a follow-up hike. A hawkish surprise would pressure rate-sensitive sectors; a hold with dovish guidance could provide a lift.
The RBA’s May 2026 cash rate decision confirmed a 25 basis point increase to 4.35 per cent, with the Monetary Policy Board citing persistent inflation concerns as the primary rationale, a stance that frames the 16 June meeting as a genuine inflection point rather than a formality.
Three variables will determine how the month resolves. Each one can be monitored in real time, giving investors a framework for updating their positioning as events unfold rather than relying on a single start-of-month call.
China’s confirmed trade commitments from the May 2026 Beijing summit are more limited than headline reporting suggested, with no formal tariff schedule or implementation timeline published and several of the most market-relevant claims remaining unverified by Beijing officials, which matters directly for investors using the summit as evidence that Chinese demand for Australian commodity exports is on a strengthening trajectory.
Materials and energy are expected to be the primary contributors to ASX 200 EPS growth across FY26 and FY27, according to consensus estimates. Given the sectors’ combined weight in the index, movements in iron ore, coal, LNG, and base metals prices transmit directly into index-level earnings revisions. If commodity prices hold or improve, the earnings growth that justifies the current valuation premium remains intact. If they deteriorate, the 16.7x forward PE becomes harder to sustain.
The conditions that produced the worst June on record are not present. There is no synchronised global rate-hiking cycle. The RBA has hiked, but market pricing suggests the tightening bias is contained rather than accelerating. Consensus EPS growth of nearly 12% for FY26 provides a fundamentally different earnings backdrop than the contracting expectations that defined mid-2022.
The recent trend of positive Junes, seven out of eight from 2018 to 2025, is more structurally informative than the 45-year average for investors assessing the current environment. The macro conditions that produced those gains are closer to today’s than the conditions that produced the pre-2018 weakness.
However, the ASX 200’s forward PE of 16.7x means the market is carrying above-average valuations into the month, and that limits the buffer if the RBA surprises, China data disappoints, or global sentiment shifts. The starting point of 8,731.70 on 29 May 2026 prices in a good deal of the earnings growth already.
ASX market breadth entering June 2026 reveals conditions that the headline index level obscures: as of late May, 84.5% of ASX 200 constituents were trading at least 10% below their 52-week highs, a dispersion pattern that makes the starting point of 8,731.70 a less complete picture of underlying market health than the number alone suggests.
Investors who understand both the seasonal pattern and the specific catalysts to watch, the 16 June RBA decision, China activity data, and commodity price direction, are better positioned than those relying on either the long-run average or the recent trend alone. Historical seasonality is context, not a trading signal. In 2026, the context says caution, not alarm.
This article is for informational purposes only and should not be considered financial advice. Investors should conduct their own research and consult with financial professionals before making investment decisions. Past performance does not guarantee future results. Financial projections are subject to market conditions and various risk factors.
Since 1980, June is the only calendar month where the ASX 200 has finished higher less than half the time, with an average price return of -0.40% and a positive outcome rate of just 43%.
Four structural forces tied to Australia's 30 June fiscal year-end drive recurring selling pressure: tax-loss selling, institutional portfolio rebalancing, ex-dividend date price declines, and fund managers reducing risk exposure before annual reports are finalised.
The ASX 200 is trading at approximately 16.7x on a 12-month forward price-to-earnings ratio as of late May 2026, which is well above the long-run average of 14.9x, with consensus EPS growth forecasts of 11.9% for FY26 and 12.3% for FY27.
The RBA interest rate decision on 16 June 2026 is the single most significant intra-month catalyst; following the 25 basis point hike to 4.35% in May, a hawkish surprise would pressure rate-sensitive sectors while a hold with dovish guidance could support equities.
Seven of the eight Junes from 2018 to 2025 delivered positive price returns, with the sole exception being June 2022 when the index fell 8.92% amid an aggressive global rate-hiking cycle, making the recent trend considerably more positive than the 45-year historical average.


