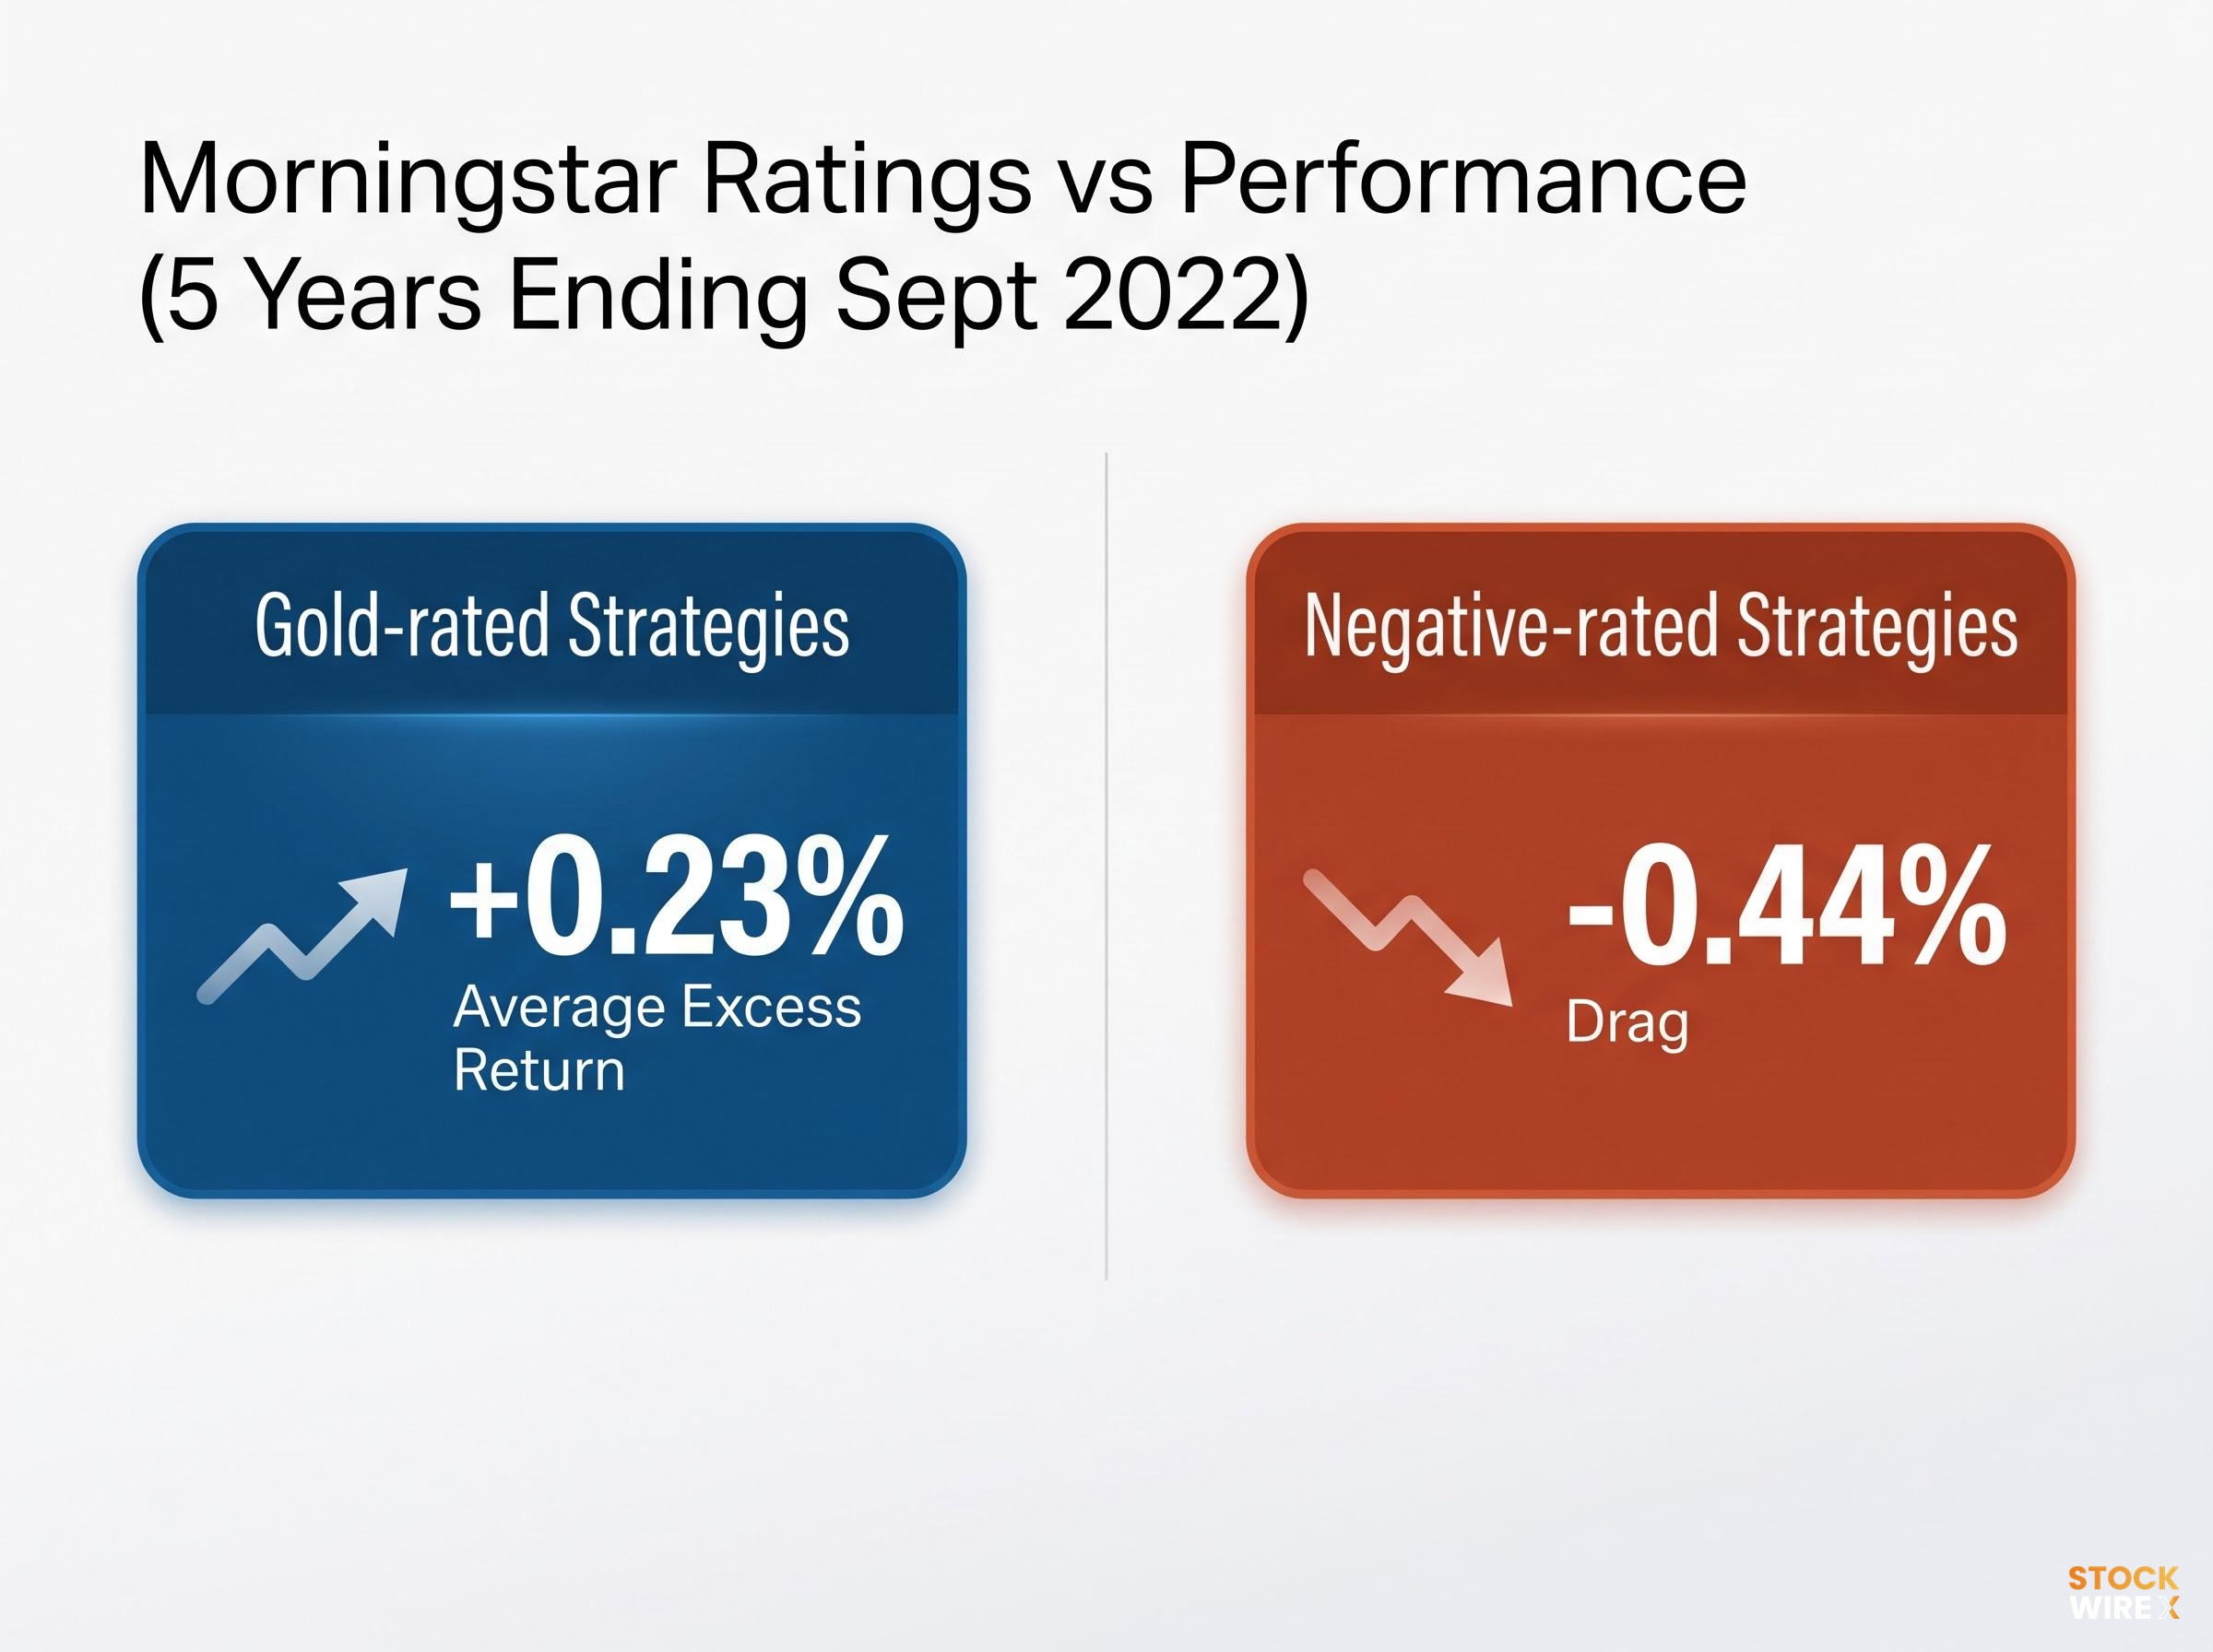
The global ETF and fund universe now spans thousands of products holding US$12.7 trillion in assets. Most individual investors have no structured way to distinguish between them beyond past returns, a metric that professional analysts treat as one of the least reliable evaluation criteria available. Morningstar’s forward-looking Medalist rating system, which assesses funds on people, process, and parent quality rather than historical performance, has demonstrably separated eventual winners from laggards over five-year horizons. Gold-rated strategies produced average excess returns of +0.23% while Negative-rated strategies dragged -0.44% behind their categories over the same period. The gap sounds modest, but compounding over a decade makes it significant, and the methodology behind those ratings is accessible to any investor willing to apply it. This guide translates the professional analyst framework into a practical screening workflow, starting with the three pillars analysts use to eliminate poor-quality products before they ever run a performance screen.
Why professional analysts ignore past performance as a starting point
Historical returns are a lagging signal. They reflect market conditions, factor rotations, and macro environments that may no longer exist. A fund that topped its category over the past five years may have done so through concentrated bets that happened to align with a single market regime; nothing about that result guarantees the manager can repeat it in a different one.
The majority of European active equity funds underperformed their benchmarks over both five- and ten-year horizons at year-end 2023, according to SPIVA data. The index return represents the average accessible outcome, making it the baseline any active fee must clear to justify its cost.
Morningstar has been evaluating active and passive investment strategies since 1986, building a methodology grounded in analyst assessment rather than return screening. The core principle is forward-looking: evaluate whether a fund’s investment strategy, team, and parent organisation are structured to deliver value over a full market cycle, rather than ranking products by what they returned last quarter. For individual investors, the more achievable goal is not predicting the next top performer but systematically eliminating identifiable underperformers. That is where a structured framework delivers its greatest value.
When big ASX news breaks, our subscribers know first
Examining a fund’s investment strategy and methodologies
Morningstar analysts take a style-neutral stance when evaluating process. No preference is given to value over growth, or credit-sensitive over high-quality fixed income. The question is whether the investment philosophy is coherent, repeatable, and capable of generating differentiated outcomes across a full market cycle. A fund that cannot articulate how its process creates value, or whose portfolio looks indistinguishable from its benchmark, fails at this stage regardless of its style label.
That second failure has a name. Closet indexing occurs when an active fund charges active management fees while constructing a portfolio that closely mirrors its benchmark index. The European Securities and Markets Authority (ESMA) listed closet indexing as an ongoing supervisory priority in its 2024 Work Programme, reflecting regulatory concern that investors in these products pay for active management and receive passive-like outcomes. A fund charging a 1% management fee must generate at least 1% of gross outperformance before any net benefit reaches investors. Closet indexing makes that hurdle nearly impossible to clear.
ESMA’s 2024 Annual Work Programme formally designated closet indexing as a continuing supervisory priority, reflecting the regulator’s assessment that investors in these strategies are systematically paying active management fees for outcomes that passive products deliver at a fraction of the cost.
The CFA Institute recommends a single practical filter for smart-beta and thematic strategies: “What is the economic rationale of this strategy?” If the answer relies on narrative momentum rather than a durable economic mechanism, the process is unlikely to persist through a full cycle.
For passive ETFs, process evaluation follows a different sequence. Tracking difference, which measures how far a fund’s actual returns deviate from its benchmark over time, is a cleaner measure of index replication quality than tracking error. The following steps provide a structured approach:
Total cost of ownership for an ETF extends beyond the headline management expense ratio to include tracking difference, bid-ask spreads, and brokerage commissions, each of which compounds silently over long holding periods in ways that the expense ratio figure alone will not reveal.
- Check tracking difference versus the benchmark over multiple periods; it should be small and persistent
- Assess bid-ask spreads and average daily volume as liquidity indicators
- Examine the index methodology (for passive) or the active process logic (for active ETFs)
- Apply the economic rationale question: does this strategy have a durable reason to exist beyond current market enthusiasm?
Assessing the investment team: key factors for trust and stability
The quality and stability of a fund’s investment team is one of the primary determinants of long-term outcomes. Professional analysts assess several specific dimensions when evaluating personnel, and any investor can apply the same lens using publicly available information.
The core screening checklist covers five areas:
- Manager tenure: How long has the lead portfolio manager been running this specific strategy?
- Team depth: Is the investment capability spread across a bench of experienced professionals, or concentrated in one or two individuals?
- Succession planning: Does the firm disclose a documented plan for leadership transition?
- Key-person concentration risk: Would the departure of a single individual effectively end the strategy’s intellectual basis?
- Co-investment: Do the managers invest their own capital in the strategy they oversee?
Morningstar’s 2024 guidance reiterated that these areas should be primary focus points for retail investors. Negatively rated strategies frequently exhibit elevated staff turnover relative to Gold-rated peers, a signal that instability at the team level feeds through to outcomes.
Red flags that signal team-level structural risk
Observable warning signs include high portfolio manager turnover, no disclosed succession planning, absence of co-investment, and a strategy that cannot be articulated without reference to a named individual. Two recent cases illustrate what these failures look like in practice.
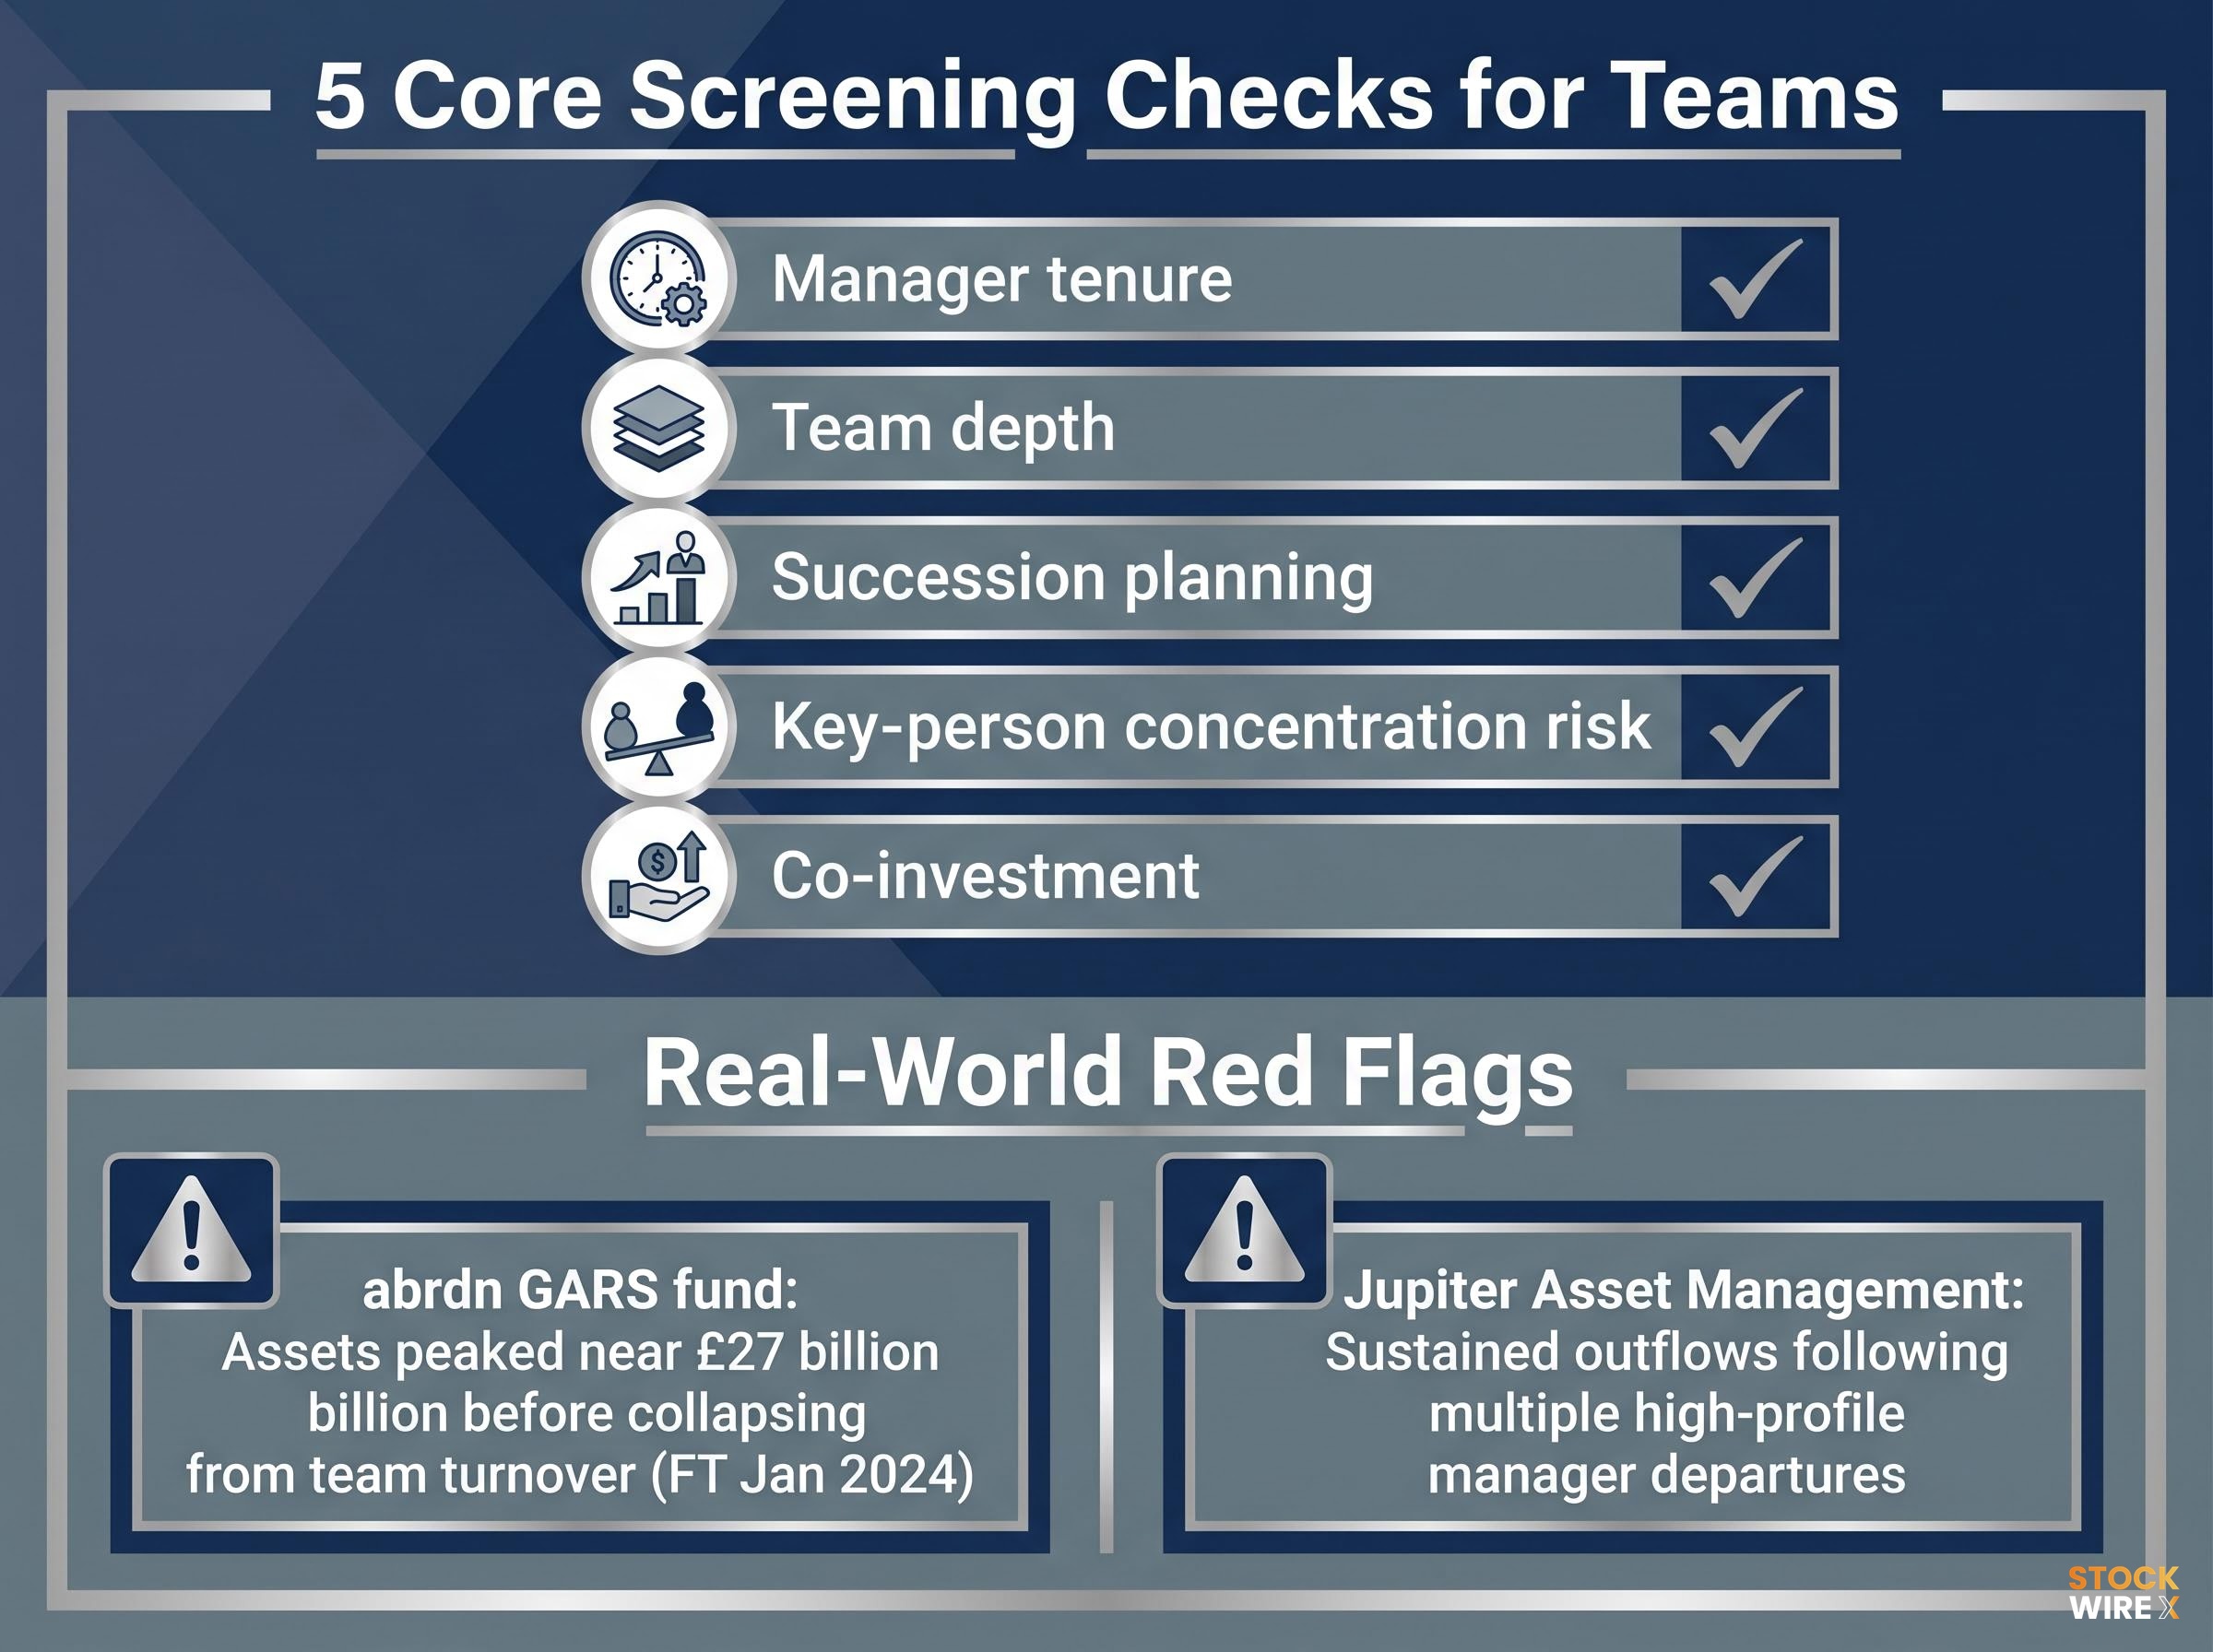
abrdn’s Global Absolute Return Strategies (GARS) fund saw assets peak near £27 billion before collapsing as team turnover dismantled the original investment architecture. Analysts and industry commentators cited the loss of original architects and inability to adapt the process as central reasons for the strategy’s decline, according to reporting by the Financial Times in January 2024.
Jupiter Asset Management suffered sustained outflows following the departure of multiple high-profile managers, illustrating concentration risk at the firm level. When intellectual capital is locked inside individuals rather than institutionalised in a stable, repeatable process, investors bear the full cost of any departure.
The parent firm: assessing culture and alignment with investor interests
A strong fund managed inside a commercially driven firm is a fragile investment. The parent organisation’s culture determines whether a product was built to serve investors or to gather assets, and that distinction eventually shows up in outcomes.
Investor-aligned firms operate within demonstrated areas of competence, align manager incentives with investor outcomes, maintain reasonable fee structures, and communicate transparently. Commercially oriented firms tend to launch trend-following products as asset-gathering tools, charge elevated fees, and structure incentive programmes that do not align manager and investor interests.
The following warning signs suggest a commercially driven parent:
- Thematic product launches timed to peak investor enthusiasm
- Elevated fees without peer justification
- Incentive structures misaligned from investor outcomes
- Product proliferation into novel niches at the height of market narratives
The evidence from 2023-2024 is instructive. The US saw a record wave of thematic ETF closures, particularly in niches such as metaverse, work-from-home, and single-theme technology strategies, as assets and trading volumes collapsed, according to the Financial Times in March 2024. Several single-stock leveraged and inverse ETFs launched in 2022-2023 experienced sharp asset declines and closures or reverse splits by 2024, as reported by the Wall Street Journal. European crypto exchange-traded products (ETPs) saw large outflows and closures after 2022-2023 losses, demonstrating pro-cyclical, commercially driven product timing, according to Reuters.
| Dimension | Investor-aligned firm | Commercially oriented firm |
|---|---|---|
| Capacity management | Closes or limits fund size to protect existing investors | Pursues asset growth regardless of capacity constraints |
| Fee structure | Competitive fees justified by process and outcomes | Elevated fees without clear performance justification |
| Incentive alignment | Manager compensation tied to long-term investor outcomes | Compensation tied to asset gathering and short-term flows |
| Product discipline | Launches within demonstrated competence areas | Launches trend-following products at peak enthusiasm |
| Communication transparency | Candid reporting on risks, underperformance, and limitations | Marketing-led communication that emphasises upside narratives |
Reviewing product disclosure statements and annual reports, rather than relying on marketing materials, provides a more reliable window into a firm’s true alignment with investor interests.
Fees as the most reliable performance predictor
The logic is mechanical before it is empirical. A fund charging 1% in annual fees must generate at least 1% in gross outperformance before investors receive any net benefit. That fee compounds every year regardless of market conditions, and the manager must clear it every year before the investor’s capital begins to grow at market rates. Over a decade, the cumulative drag is substantial.
The empirical data reinforces the arithmetic. ICI data for 2023 provides a clear set of benchmarks for calibrating whether any fund’s fee is reasonable relative to its category:
| Category | Asset-weighted average expense ratio (2023) |
|---|---|
| All long-term US funds and ETFs | 0.37% |
| US equity mutual funds | 0.42% |
| US index equity mutual funds | 0.05% |
| US equity ETFs | 0.16% |
Fee compression is a structural trend, not a temporary adjustment. Providers have cut fees, and investors have migrated to cheaper products in parallel.
Investors saved an estimated US$20 billion in fund fees in 2023 versus 2022, according to Morningstar’s Global Fund Fee Study, as capital shifted toward lower-cost products and providers reduced charges.
SPIVA year-end 2023 data confirmed that the majority of European active equity funds underperformed their benchmarks over five- and ten-year horizons, reinforcing that most active fee premiums are not recovered through performance. Morningstar’s own research showed Gold-rated funds achieved +0.23% average excess return versus -0.44% for Negative-rated funds over the five years ending September 2022. The pattern is consistent: higher fees make outperformance harder, and the compounding effect of that drag grows larger with every year an investor holds the position. Every basis point saved flows directly to the investor as return rather than management company revenue.
The fee compounding gap between cheapest and most expensive fund quintiles is more extreme than most investors expect: Morningstar Australia data shows multisector growth funds in the cheapest quintile achieved an 87% success rate versus just 14% for the most expensive quintile, a spread that translates into a roughly $62,000 wealth difference on a $100,000 portfolio over 20 years at 7% gross returns.
Putting it together: a practical pre-investment screening workflow
The professional analyst framework is not a black box. It is a structured sequence of questions that any investor can follow using freely available data. Applied consistently, it eliminates the majority of identifiable poor-quality products from consideration before any return analysis is needed.
The following sequential workflow integrates the three pillars with fee analysis into a repeatable process:
- Define the investment objective and relevant benchmark. What role does this fund play in the portfolio, and what index represents the baseline outcome?
- Screen on fees relative to category peers. Reject funds with expense ratios materially above the category median without explicit justification
- Evaluate process coherence and portfolio construction. Apply the economic rationale question. Check for closet indexing in active funds or tracking difference in passive ETFs
- Assess team quality. Apply the People Pillar checklist: tenure, depth, succession planning, key-person risk, co-investment
- Evaluate the parent firm’s culture and incentive alignment. Review product disclosure statements and annual reports rather than marketing materials
- Cross-reference with Morningstar Medalist Ratings where available. Gold and Silver ratings carry the highest probability of outperforming category peers net of fees; Neutral and Negative carry the lowest
Free tools map directly to each stage. Morningstar Investor and ETF.com provide fee, rating, and portfolio screening. Fund prospectuses and annual reports supply the process and parent assessment data. Attending annual general meetings and fund manager presentations offers a direct method for verifying team quality and process integrity beyond written disclosures.
Screening passive ETFs
For index-tracking products, the specific questions narrow to five filters: tracking difference versus benchmark (small and persistent over time), expense ratio versus category minimum, bid-ask spreads and average daily volume as liquidity measures, fund size and liquidity depth, and index methodology coherence. CFA Institute guidance from 2024 identified bid-ask spreads and average daily volumes as ETF-specific liquidity filters that most investors skip, yet they directly affect the true cost of ownership.
Screening active funds
Active fund evaluation layers the full three-pillar framework onto the fee screen. The People Pillar checklist covers tenure, depth, co-investment, and succession. The Process Pillar assesses active share, coherence, and economic rationale. The Parent Pillar evaluates fee versus category median, incentive alignment, and product discipline. Where available, Morningstar Medalist Ratings provide an aggregated signal across all three pillars. Vanguard’s 2024 guidance recommended screening on the lowest expense ratio quartile within a category, combined with diversification and index methodology quality, as the core selection framework for passive allocations.
Morningstar’s Medalist Rating methodology underwent a significant structural change in April 2026, with a formal Price Score now weighted at 40% for passive funds and 30% for active funds, making fee competitiveness an explicit, scored component of every Gold, Silver, and Bronze designation rather than an implicit consideration embedded in the broader analysis.
A better scorecard is a permanent competitive advantage for individual investors
The goal of fund evaluation is not to predict the next best-performing fund. It is to systematically exclude identifiable underperformers, a more achievable and more reliable outcome for individual investors than chasing returns. The three pillars, people, process, and parent, work as an integrated framework rather than a checklist of independent items. Morningstar’s evidence shows that strength across all three, combined with competitive fees, is what separates Gold-rated from Negative-rated strategies over meaningful time horizons.
The same analytical discipline applies beyond fund selection: Howard Marks argues that price paid relative to intrinsic value is the single most consequential variable in investing, a principle that explains why investors in the Nifty Fifty lost approximately 90% of portfolio value between 1968 and 1973 despite holding world-class companies, and why elevated valuations in any era warrant the same scepticism applied to a fund charging fees it cannot justify.
The environment is increasingly supportive of investors who apply quality screens. Fee compression continues to reduce the cost baseline, and regulatory pressure on value-for-money disclosure is building across jurisdictions. The FCA’s Consumer Duty framework in the United Kingdom, ESMA’s fee justification requirements across Europe, and ASIC’s updated disclosure standards in Australia all push the industry toward greater transparency. Investors who build the habit of screening on quality rather than chasing past returns position themselves to benefit from these structural shifts year after year.
This article is for informational purposes only and should not be considered financial advice. Investors should conduct their own research and consult with financial professionals before making investment decisions. Past performance does not guarantee future results.