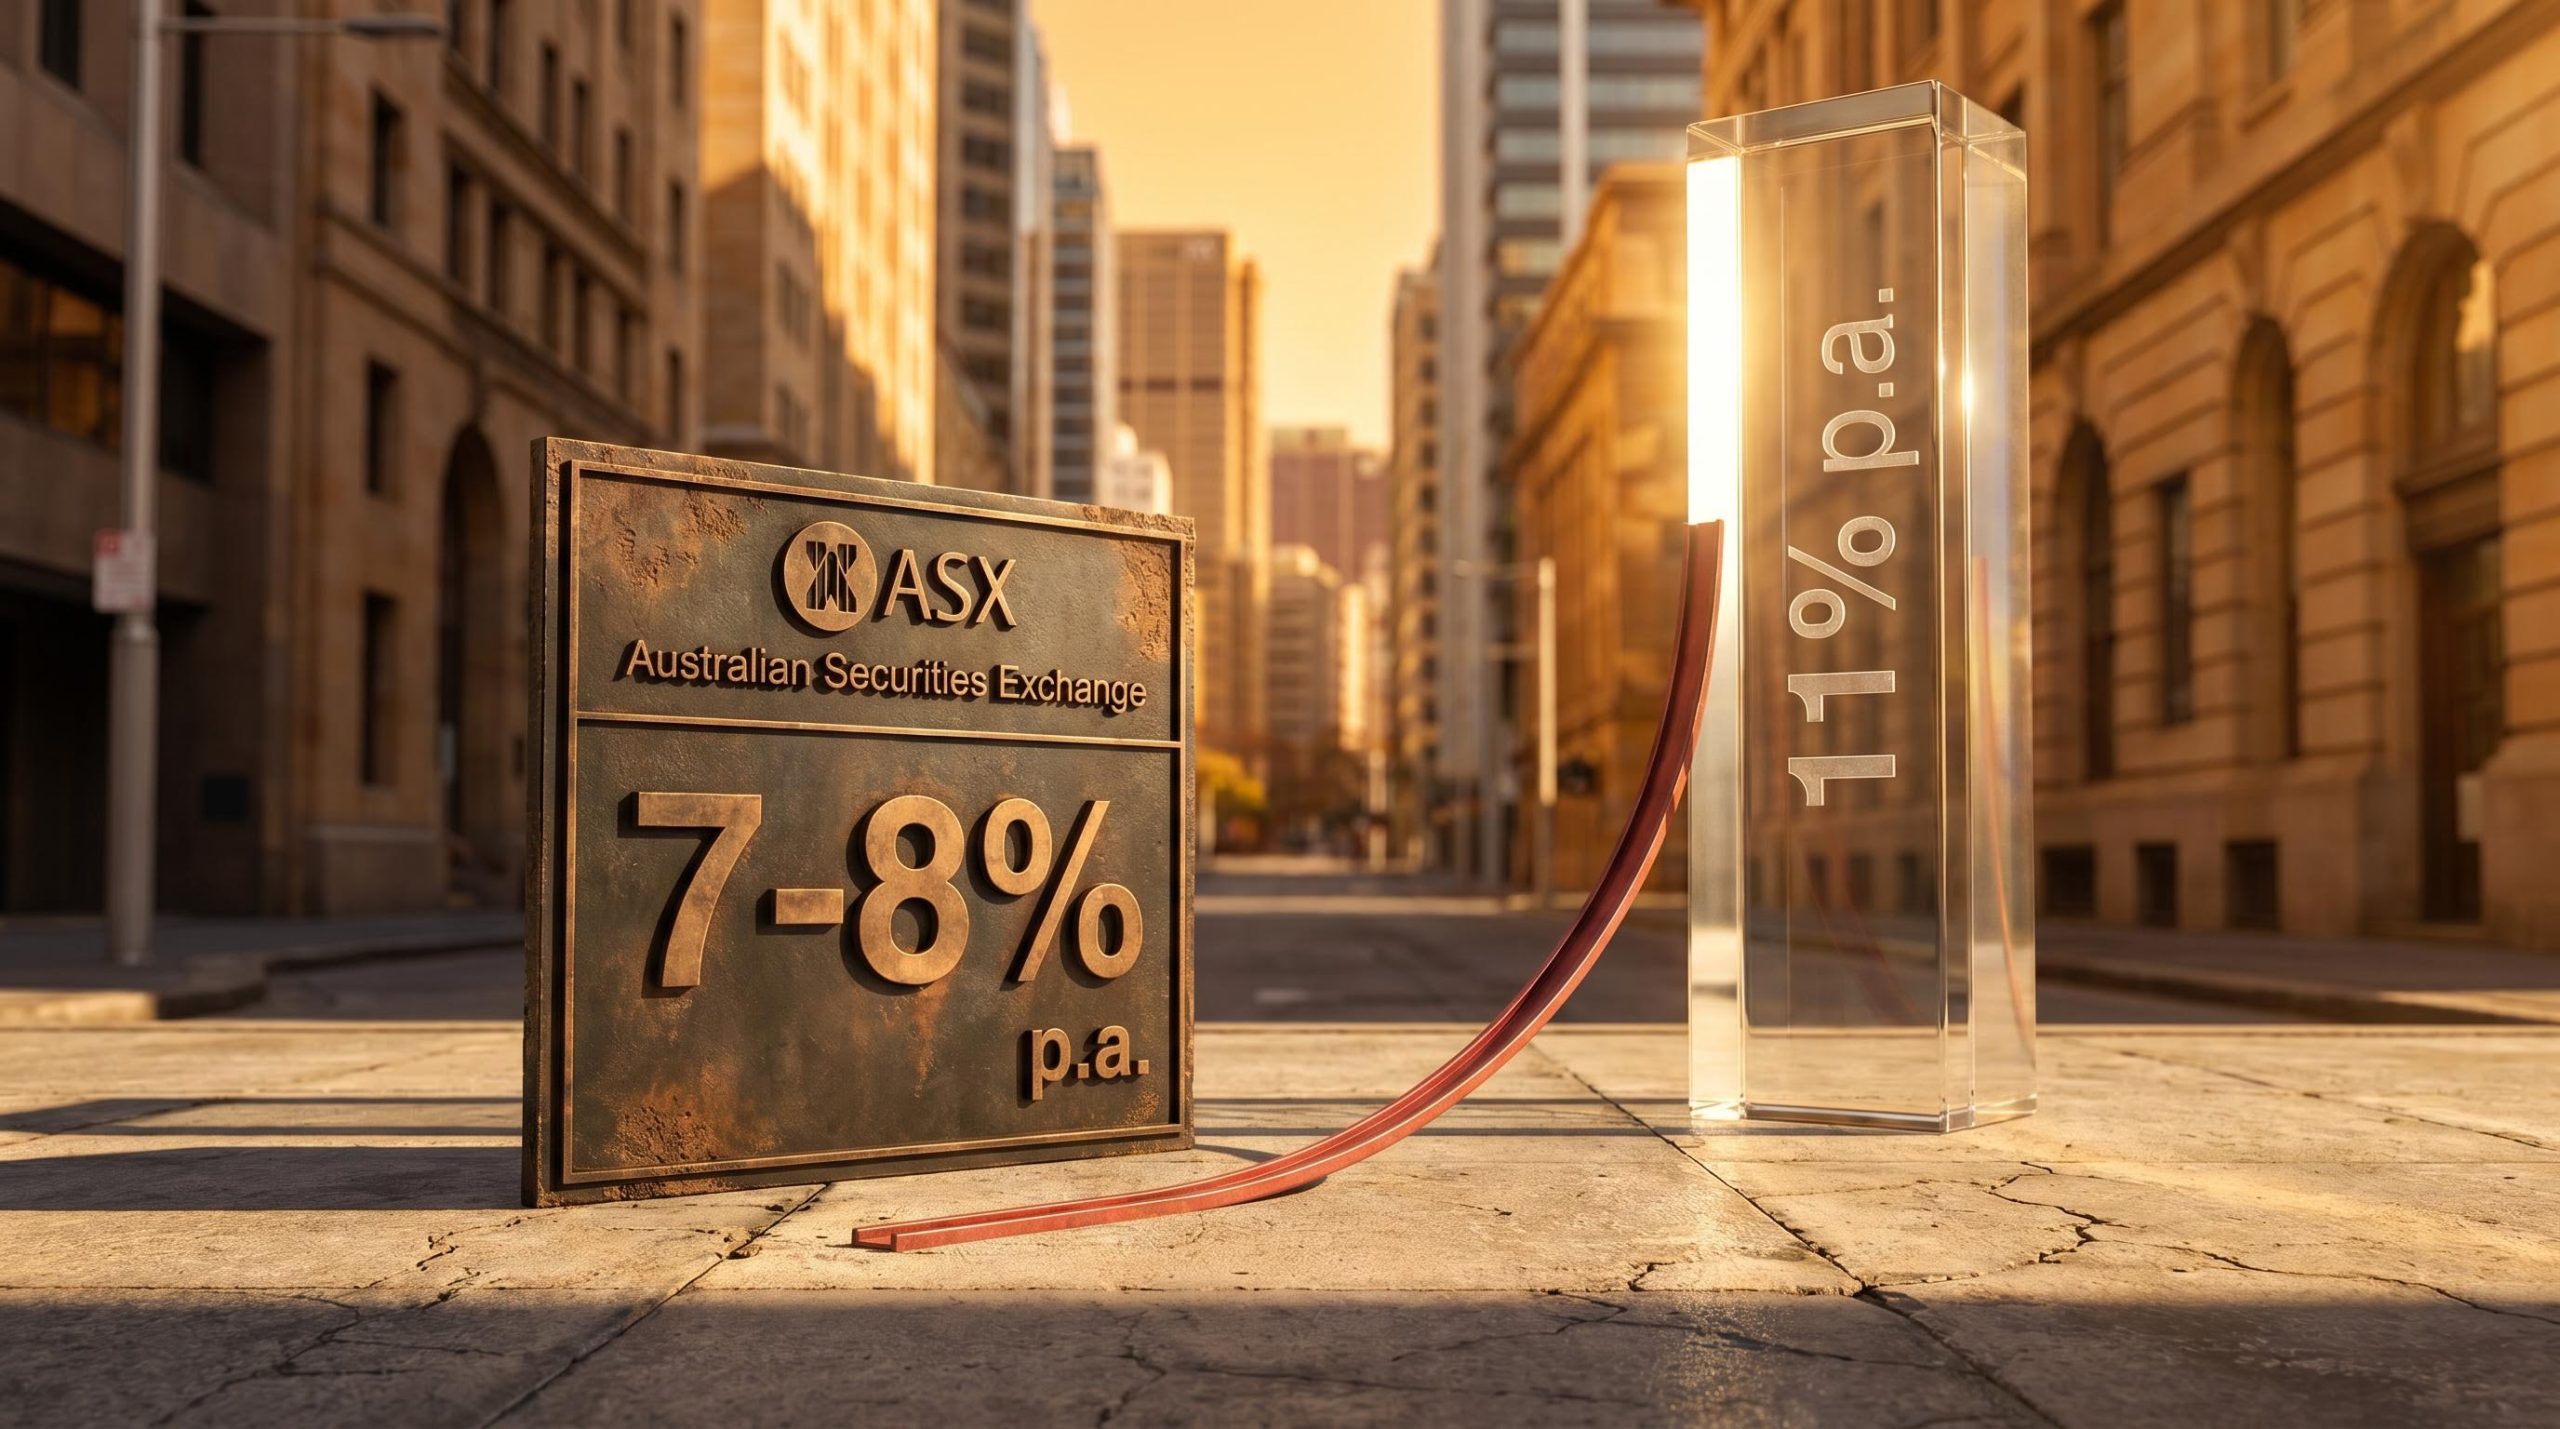
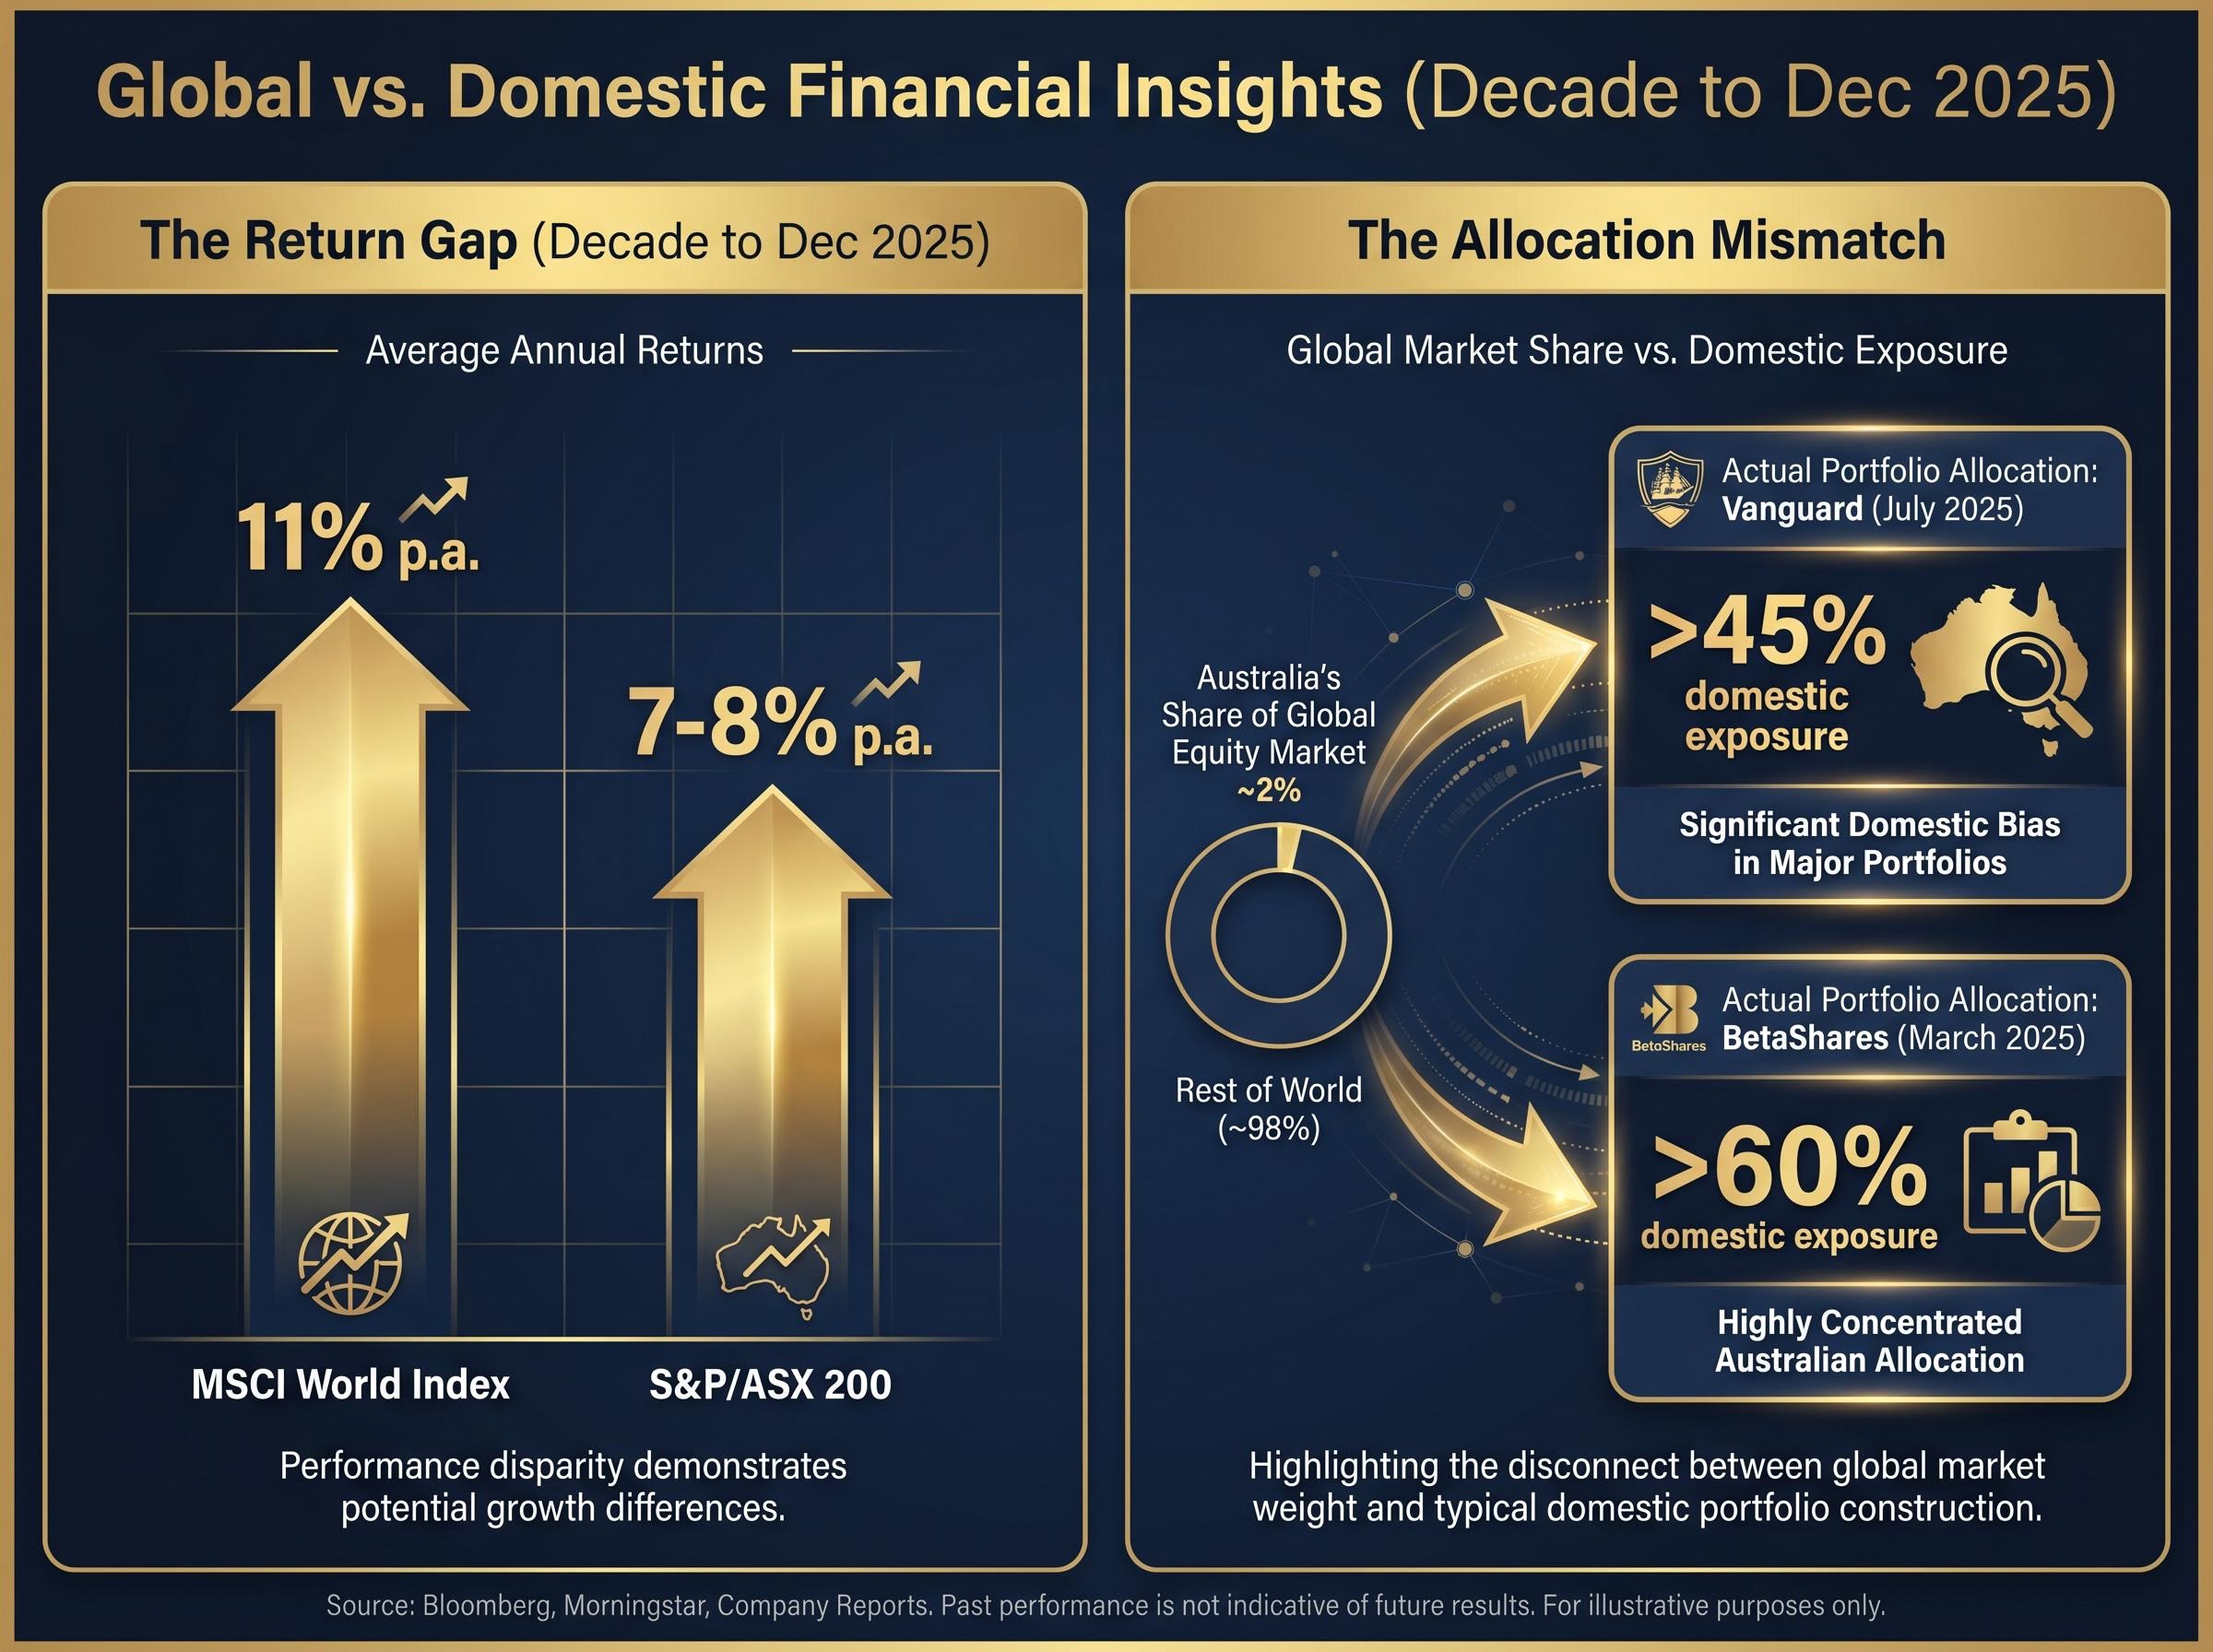
Over the decade to December 2025, the MSCI World Index returned approximately 11% per annum in Australian dollar terms. The S&P/ASX 200 delivered roughly 7-8%. That gap of 3-4 percentage points annually is not a run of bad luck. It is the arithmetic consequence of structural choices baked into the index itself, compounding quietly against Australian investors year after year.
The scale of the mismatch becomes sharper in portfolio context. Australian retail investors and self-managed superannuation funds (SMSFs) hold more than 45% of their equity exposure in domestic shares, according to Vanguard’s July 2025 report, despite Australia representing roughly 2% of the global equity market. This concentration is the allocation backdrop against which the structural arguments below land. What follows is the case for why that underperformance is unlikely to reverse, built across five layers: index composition, corporate profitability, the iron ore demand ceiling, domestic stagflation dynamics, and what a better-calibrated portfolio might look like.
An index built for the last cycle, not the next one
The ASX 200’s structural problem is not a matter of timing. It is a matter of composition.
Banks and resource companies dominate the index, and both sectors carry inherent earnings limitations. The major banks sell largely undifferentiated financial products in a mature, heavily regulated market. The miners are price-takers on global commodity markets, their earnings hostage to cycles they cannot control. Neither sector possesses the pricing power or scalable margin structure that has driven returns in global indices over the past decade.
The contrast with the S&P 500 is instructive:
- ASX 200 top-weighted sectors: financials (banks), materials (iron ore, gold), real estate
- S&P 500 top-weighted sectors: technology (software, semiconductors, cloud platforms), health care (pharmaceuticals, medical devices), consumer platforms (e-commerce, digital advertising)
The absence of dominant technology or high-margin consumer platforms on the ASX is not an oversight. It reflects the composition of the Australian economy. But for investors whose equity exposure is concentrated in that composition, the cost is measured in foregone compounding.
Perpetual Investments’ “Market Outlook 2026” observed that Australian investors are “under-exposed to the structural growth sectors dominating global indices,” including US technology, health care, and consumer brands.
The question is not when the ASX will catch up. It is whether there is a structural reason to expect it will.
When big ASX news breaks, our subscribers know first
The profitability gap that compounds quietly against Australian investors
Start at the market level. MSCI Australia, which closely tracks the ASX 200, was delivering return on equity (ROE, a measure of how much profit a company generates for each dollar of shareholder equity) of approximately 11-12% as of early 2025, per Morgan Stanley’s Global Equity Strategy team. The S&P 500 aggregate ROE sat in the 18-21% range across 2024-2025 estimates, per Goldman Sachs.
Morgan Stanley, via the Australian Financial Review in March 2025, highlighted this structural profitability gap as a defining characteristic of the Australian equity market relative to global peers.
That is a 6-10 percentage point gap at the market level. Drill into the ASX’s largest sector, and the picture does not improve.
| Entity | ROE / ROCE (FY24) | Benchmark note |
|---|---|---|
| MSCI Australia (market average) | ~11-12% ROE | vs S&P 500 ~18-21% ROE |
| CBA | 13.6% ROE | Highest among major banks |
| NAB | 11.9% ROE | Below pre-GFC peaks above 20% |
| Westpac | 11.4% ROE | Below pre-GFC peaks above 20% |
| ANZ | 10.6% ROE | Lowest among major banks |
| BHP | 24% ROCE | Capital-intensive; not like-for-like with US tech ROE |
| Rio Tinto | 20% ROCE | Iron ore dominant earnings contributor |
| Fortescue | 28% ROCE | Iron ore business; highest ROCE among peers |
The iron ore miners generate higher returns on capital employed (ROCE), but this advantage is sector-specific, asset-intensive, and dependent on a commodity cycle with a visible demand ceiling. UBS has observed that even major bank ROE remains well below pre-GFC peaks above 20%.
Even the ASX’s best-returning sectors cannot close the distance with US equity profitability norms. Compounded over a decade, that gap translates directly into the performance divergence Australian investors have already experienced.
Index-level return skew on the ASX is more extreme than the sector weights alone suggest: only 36% of the 210 largest listed companies beat the ASX 300 over 15 years, and the median individual stock returned 6.73% annually against the index’s 8.62%, meaning stock-pickers concentrating in domestic names face compounding headwinds that passive index exposure partially avoids.
Why iron ore’s best years are structurally behind it
The headline numbers still look solid. China imported 1.182 billion tonnes of iron ore in 2024, up 6.1% from 2023, according to General Administration of Customs of China (GACC) data. But the sequential trend tells a different story. Q1 2025 imports came in at 329 million tonnes, roughly flat year-on-year per Bloomberg and Mysteel data. April 2025 volumes of 101.8 million tonnes were down from 102.7 million tonnes in the same month a year earlier.
That flatlining is consistent with what Wood Mackenzie described in the Financial Times in March 2025: seaborne iron ore imports into China had “likely peaked,” with demand expected to “plateau and then gradually decline” over the next decade.
Three structural mechanisms are driving this shift:
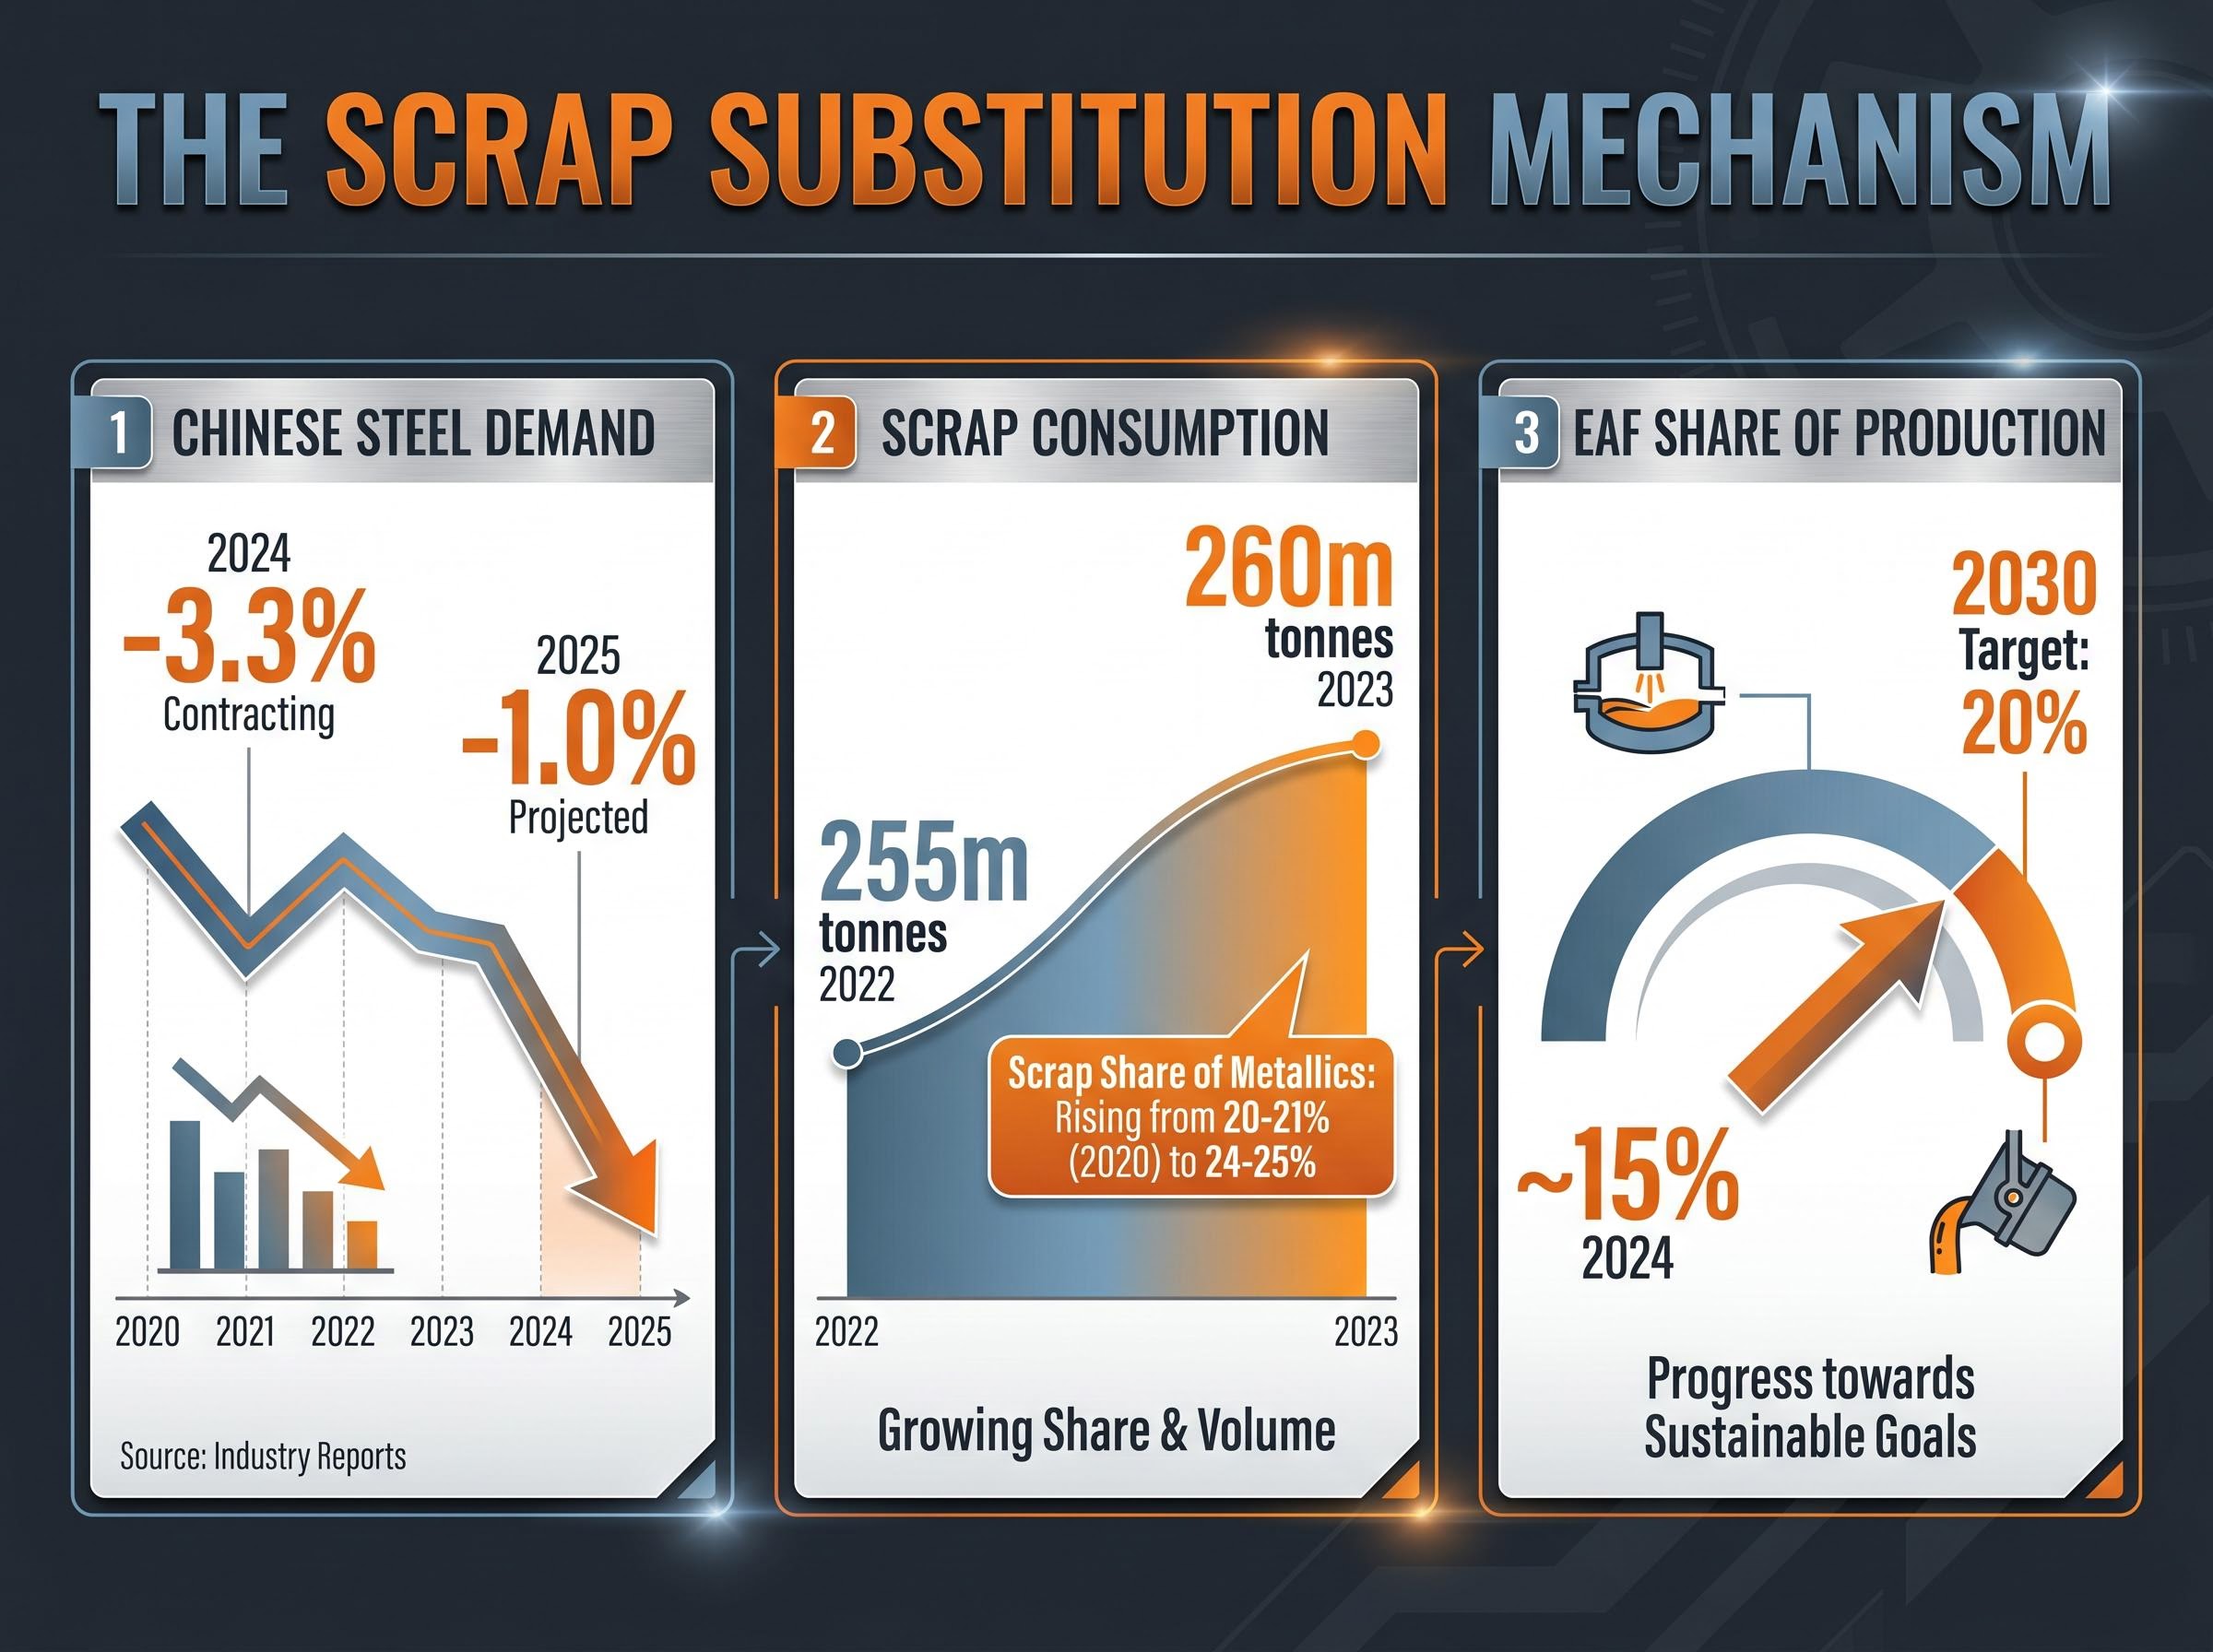
- Property sector maturation is reducing construction steel demand. The World Steel Association projected Chinese steel demand to contract 1.0% in 2025, following a 3.3% decline in 2024.
- Rising scrap availability and electric arc furnace (EAF) capacity are substituting iron ore as a steelmaking input.
- Decarbonisation policy is accelerating the shift away from blast furnace production, which is iron-ore-intensive.
The scrap substitution mechanism
Electric arc furnaces use recycled scrap steel rather than iron ore as their primary input. Every percentage point of steel production that shifts from blast furnaces to EAFs directly dilutes iron ore demand per unit of steel output.
China’s EAF share reached approximately 15% of steel production in 2024, according to Citi Research, with policy targets pointing toward 20% by 2030. Scrap consumption rose to approximately 260 million tonnes in 2023, up from 255 million tonnes in 2022, per the World Steel Association’s Steel Statistical Yearbook 2024. Scrap’s share of total metallics in Chinese crude steel production climbed to roughly 24-25%, from around 20-21% in 2020.
China’s own steel stock, embedded in buildings and infrastructure constructed during decades of rapid growth, is maturing. This increases domestic scrap availability independently of policy decisions.
For Australian investors, the implications run deeper than commodity prices. Iron ore is the single largest driver of mining sector corporate tax, government royalty revenues, and the profitability of BHP, Rio Tinto, and Fortescue. A structural demand ceiling for iron ore is a structural constraint on a substantial share of the entire ASX.
What stagflation looks like when households carry the debt
Growth and inflation are moving in the wrong directions simultaneously. Real GDP rose just 0.2% in the December quarter of 2025 (seasonally adjusted), with annual growth of 1.5%, well below trend, according to ABS National Accounts data published 5 March 2026. The RBA cash rate target sits at 4.35%, and inflation remains above the 2-3% target band, with ABS data for the year to March 2026 showing ongoing price pressure.
Per capita output contraction of roughly 0.7% across 2025 sits beneath headline GDP growth that population expansion flatters, and corporate insolvencies reaching approximately 12,000 for the year, the highest level since the 1990-91 recession, point to stress in the real economy that aggregate figures do not capture.
That combination creates a policy paradox. The Reserve Bank of Australia cannot cut rates aggressively without risking inflation re-acceleration, and cannot raise them further without triggering household balance sheet stress.
The RBA monetary policy decision announced in May 2026 reflects precisely this bind, with the Board raising the cash rate to 4.35% while acknowledging that inflation picked up materially in the second half of 2025 and that upside risks from the Middle East conflict and capacity pressures remain live.
The RBA’s Statement on Monetary Policy (November 2025) explicitly noted that in an upside-risk scenario, inflation could “remain around 4% or higher” if supply shocks or stronger wages growth re-emerged.
What makes Australia’s position uniquely constrained is where the debt sits. In the US, fiscal debt risk is concentrated at the government level. In Australia, the exposure sits primarily with households. Every basis point of rate adjustment transmits directly into mortgage repayments, discretionary spending, and consumer confidence in a way that amplifies the economic damage relative to comparable economies.
Multiple forecasters have flagged this risk explicitly:
- HSBC chief economist Paul Bloxham warned in April 2025 that inflation could “drift back above 4%” if productivity failed to improve
- AMP chief economist Shane Oliver noted in February 2026 that “the risk of inflation re-accelerating back towards 4% cannot be ruled out”
- The IMF’s 2025 Article IV consultation flagged upside inflation risks from energy and supply shocks
The three-way policy bind compounds the index-level problem:
- Growth is too weak to tolerate further rate increases
- Inflation is too persistent to justify rate cuts
- Household debt amplifies the transmission of any rate change in either direction
Stagflationary conditions compress equity valuations from both sides: weak growth constrains earnings while elevated rates increase discount rates, reducing the present value of future cash flows. For a market as domestically exposed as the ASX, this is not a passing headwind.
Critical minerals: a genuine opportunity with a long runway
Australia does hold a structural asset that no amount of bearish analysis can dismiss. The country accounts for approximately 51% of global mined lithium supply, according to Benchmark Mineral Intelligence data reported by Bloomberg in January 2026. The resource endowment in rare earths, cobalt, nickel, and manganese is similarly strong.
Government financing has followed. Total federal support for critical minerals projects has reached A$6.0 billion, per an Australian Government media release in October 2025, deployed through multiple mechanisms:
- The Critical Minerals Facility via Export Finance Australia
- Northern Australia Infrastructure Facility commitments, including up to A$840 million in combined loans and guarantees
- The broader Critical Minerals Strategy 2023-2030 framework
Benchmark Mineral Intelligence highlighted planned investment of more than A$20 billion in lithium, nickel, and battery materials projects through 2030. The Grattan Institute’s October 2025 report noted more than A$30 billion of critical minerals and battery materials projects proposed or committed, while warning about execution and policy risks.
India and Indonesia as the next demand anchor
The demand linkages most credible for Australian critical minerals lie outside China. An Australia-India joint statement in September 2025 announced a framework for enhanced critical minerals collaboration, including Australian supply of lithium and cobalt to India’s emerging battery and electric vehicle sector. India, rather than China, is increasingly viewed by analysts at Macquarie and UBS as the key incremental growth market for Australian critical minerals.
Indonesia has committed battery and EV supply chain investment exceeding US$30 billion by 2024, according to Reuters, creating complementary demand for Australian raw material inputs including manganese, graphite, and processed nickel.
The opportunity is real. The caveat is equally real: critical minerals remain early-stage relative to iron ore’s current contribution to Australian corporate earnings and government revenues. The timeline for index-level impact is measured in years to decades, not the current investment cycle. For investors, the critical minerals thesis is a long-dated option, not an imminent rerating catalyst for the ASX 200.
The portfolio implication Australian investors keep avoiding
The structural case now reads as a single argument from four directions. The ASX 200 lacks structural growth sectors. Its largest companies generate ROE 6-10 percentage points below their US counterparts. Iron ore, the earnings engine for its biggest miners, faces a demand ceiling. And the domestic macro environment is stagflationary in a way that compresses valuations from both sides.
Against that backdrop, consider the allocation data. The median SMSF holds more than 45% of total equity exposure in domestic shares, per Vanguard’s July 2025 report. BetaShares noted in March 2025 that many Australian portfolios hold more than 60% of equity exposure domestically. Morningstar Australia observed in May 2025 that Australian investors exhibit one of the highest home-equity biases globally, persisting despite prolonged underperformance.
International ETF inflows into Australian markets reached $6.9 billion in Q1 2026 alone, the quarter in which international funds overtook domestic ETFs as the most purchased category on record, suggesting the structural reallocation argument this article outlines is already translating into measurable capital flows rather than remaining a theoretical exercise.
Magellan Financial Group, in a December 2025 investor letter, argued that over 15 years, global equities had “substantially outperformed” the ASX, and that home bias leaves portfolios “needlessly concentrated in cyclical sectors and a single economy.”
The four structural headwinds working against ASX-heavy portfolios are now well documented:
- Index composition without structural growth sectors
- ROE gap relative to US equities
- Iron ore demand ceiling
- Stagflationary macro constraint
The compounding cost of holding 45% or more of equity exposure in a market generating 7-8% per annum when the global alternative delivered 11% is not a rounding error over a retirement horizon. Reducing home-country bias is not a speculative bet on global outperformance. It is a structural correction to a portfolio already concentrating risk without being compensated for it.
Structural problems rarely announce their turning point in advance
The underperformance of Australian equities relative to global peers reflects structural conditions in the index, not cyclical noise. Index composition, the profitability gap, iron ore’s demand ceiling, and stagflationary macro dynamics are not improving on a three-to-five-year horizon. None of these conditions have a visible catalyst for reversal.
Australian equities retain a legitimate role within a diversified portfolio, particularly for income-focused investors who benefit from the franking credit system. But that is a reason to be precise about allocation, not a reason to default to home-country bias at two or three times the global benchmark weight.
The structural case argues not for wholesale exit from Australian equities, but for a deliberate, evidence-based review of how much home-country exposure is genuinely justified given the risk-return arithmetic. Investors holding concentrated ASX positions may benefit from reviewing their SMSF or retail portfolio allocation against the global benchmark weight and seeking specific advice tailored to their own circumstances.
For investors ready to act on a deliberate reduction in home-country bias, our full explainer on the international equity rotation covers the valuation gap between US and non-US markets, the regional blocs posting the strongest year-to-date returns, and the specific macro catalysts that analysts at Yardeni Research and Goldman Sachs identify as sustaining the shift beyond a short-term mean reversion.
This article is for informational purposes only and should not be considered financial advice. Investors should conduct their own research and consult with financial professionals before making investment decisions. Past performance does not guarantee future results.