
A company that has paid dividends every year since 1893 sounds like the definition of safe. But is it genuinely safe, or simply old? The distinction matters more than most investors realise, and it runs through every decision about blue chip stocks, from what the term actually means to how much of a portfolio these companies should occupy.
“Blue chip” is one of the most searched phrases in personal finance, yet it is used loosely across fund names, brokerage marketing, and financial media in ways that obscure both its meaning and its limits. The label suggests quality, but quality alone does not answer the question every investor eventually asks: is this right for me?
By the end of this article, readers will know how to identify a genuine blue chip stock using publicly available tools, understand the real risk profile behind the reputation, and have a practical framework for deciding whether blue chip exposure belongs in their own portfolio.
Where the term “blue chip” comes from and what it actually means
The phrase traces to poker. At the card table, blue chips carry the highest denomination, and in the early twentieth century, financial journalists borrowed the metaphor to describe the largest, most financially durable companies trading on U.S. exchanges. The name stuck because the analogy was precise: blue chip companies, like blue poker chips, represent the highest tier.
What that tier describes, however, is a quality profile rather than a legally defined category. No regulatory body maintains an official blue chip registry. Instead, the label captures a set of observable characteristics that market participants broadly agree on.
- Market capitalisation of at least $10 billion, a widely accepted starting benchmark
- Sector leadership within a major industry
- Earnings consistency across multiple economic cycles
- Broad institutional and public recognition
- Dividend history, common but not strictly required
The SEC describes the Dow Jones Industrial Average (DJIA) as an index of 30 “blue chip” U.S. industrial stocks.
To put scale in perspective, Microsoft, a top holding in the T. Rowe Price Blue Chip Growth Fund, carries a market capitalisation of approximately $3.09 trillion. That figure illustrates how far above the $10 billion floor the most prominent blue chip companies sit.
Dividend payments are frequent among these companies, but they are not a qualifying requirement. Some of the largest blue chip growth names reinvest earnings rather than distributing them. Treating dividends as a strict criterion is one of the most common reader misconceptions, and one the rest of this article will address directly.
When big ASX news breaks, our subscribers know first
How to identify a blue chip stock: indices, market cap, and the names you already know
Definitions are useful. Identification tools are better. The most reliable practical method for confirming blue chip status is cross-referencing two things: index membership and market capitalisation.
Index membership does the heavy lifting. The major indices apply their own financial screens, effectively pre-qualifying constituents by size, liquidity, and earnings quality. The table below compares the four most relevant benchmarks.
The S&P Dow Jones Indices DJIA methodology specifies that component selection is based on reputation, sustained growth, investor interest, and sector representation, criteria that align closely with the broader characteristics investors use to identify blue chip candidates beyond any single financial metric.
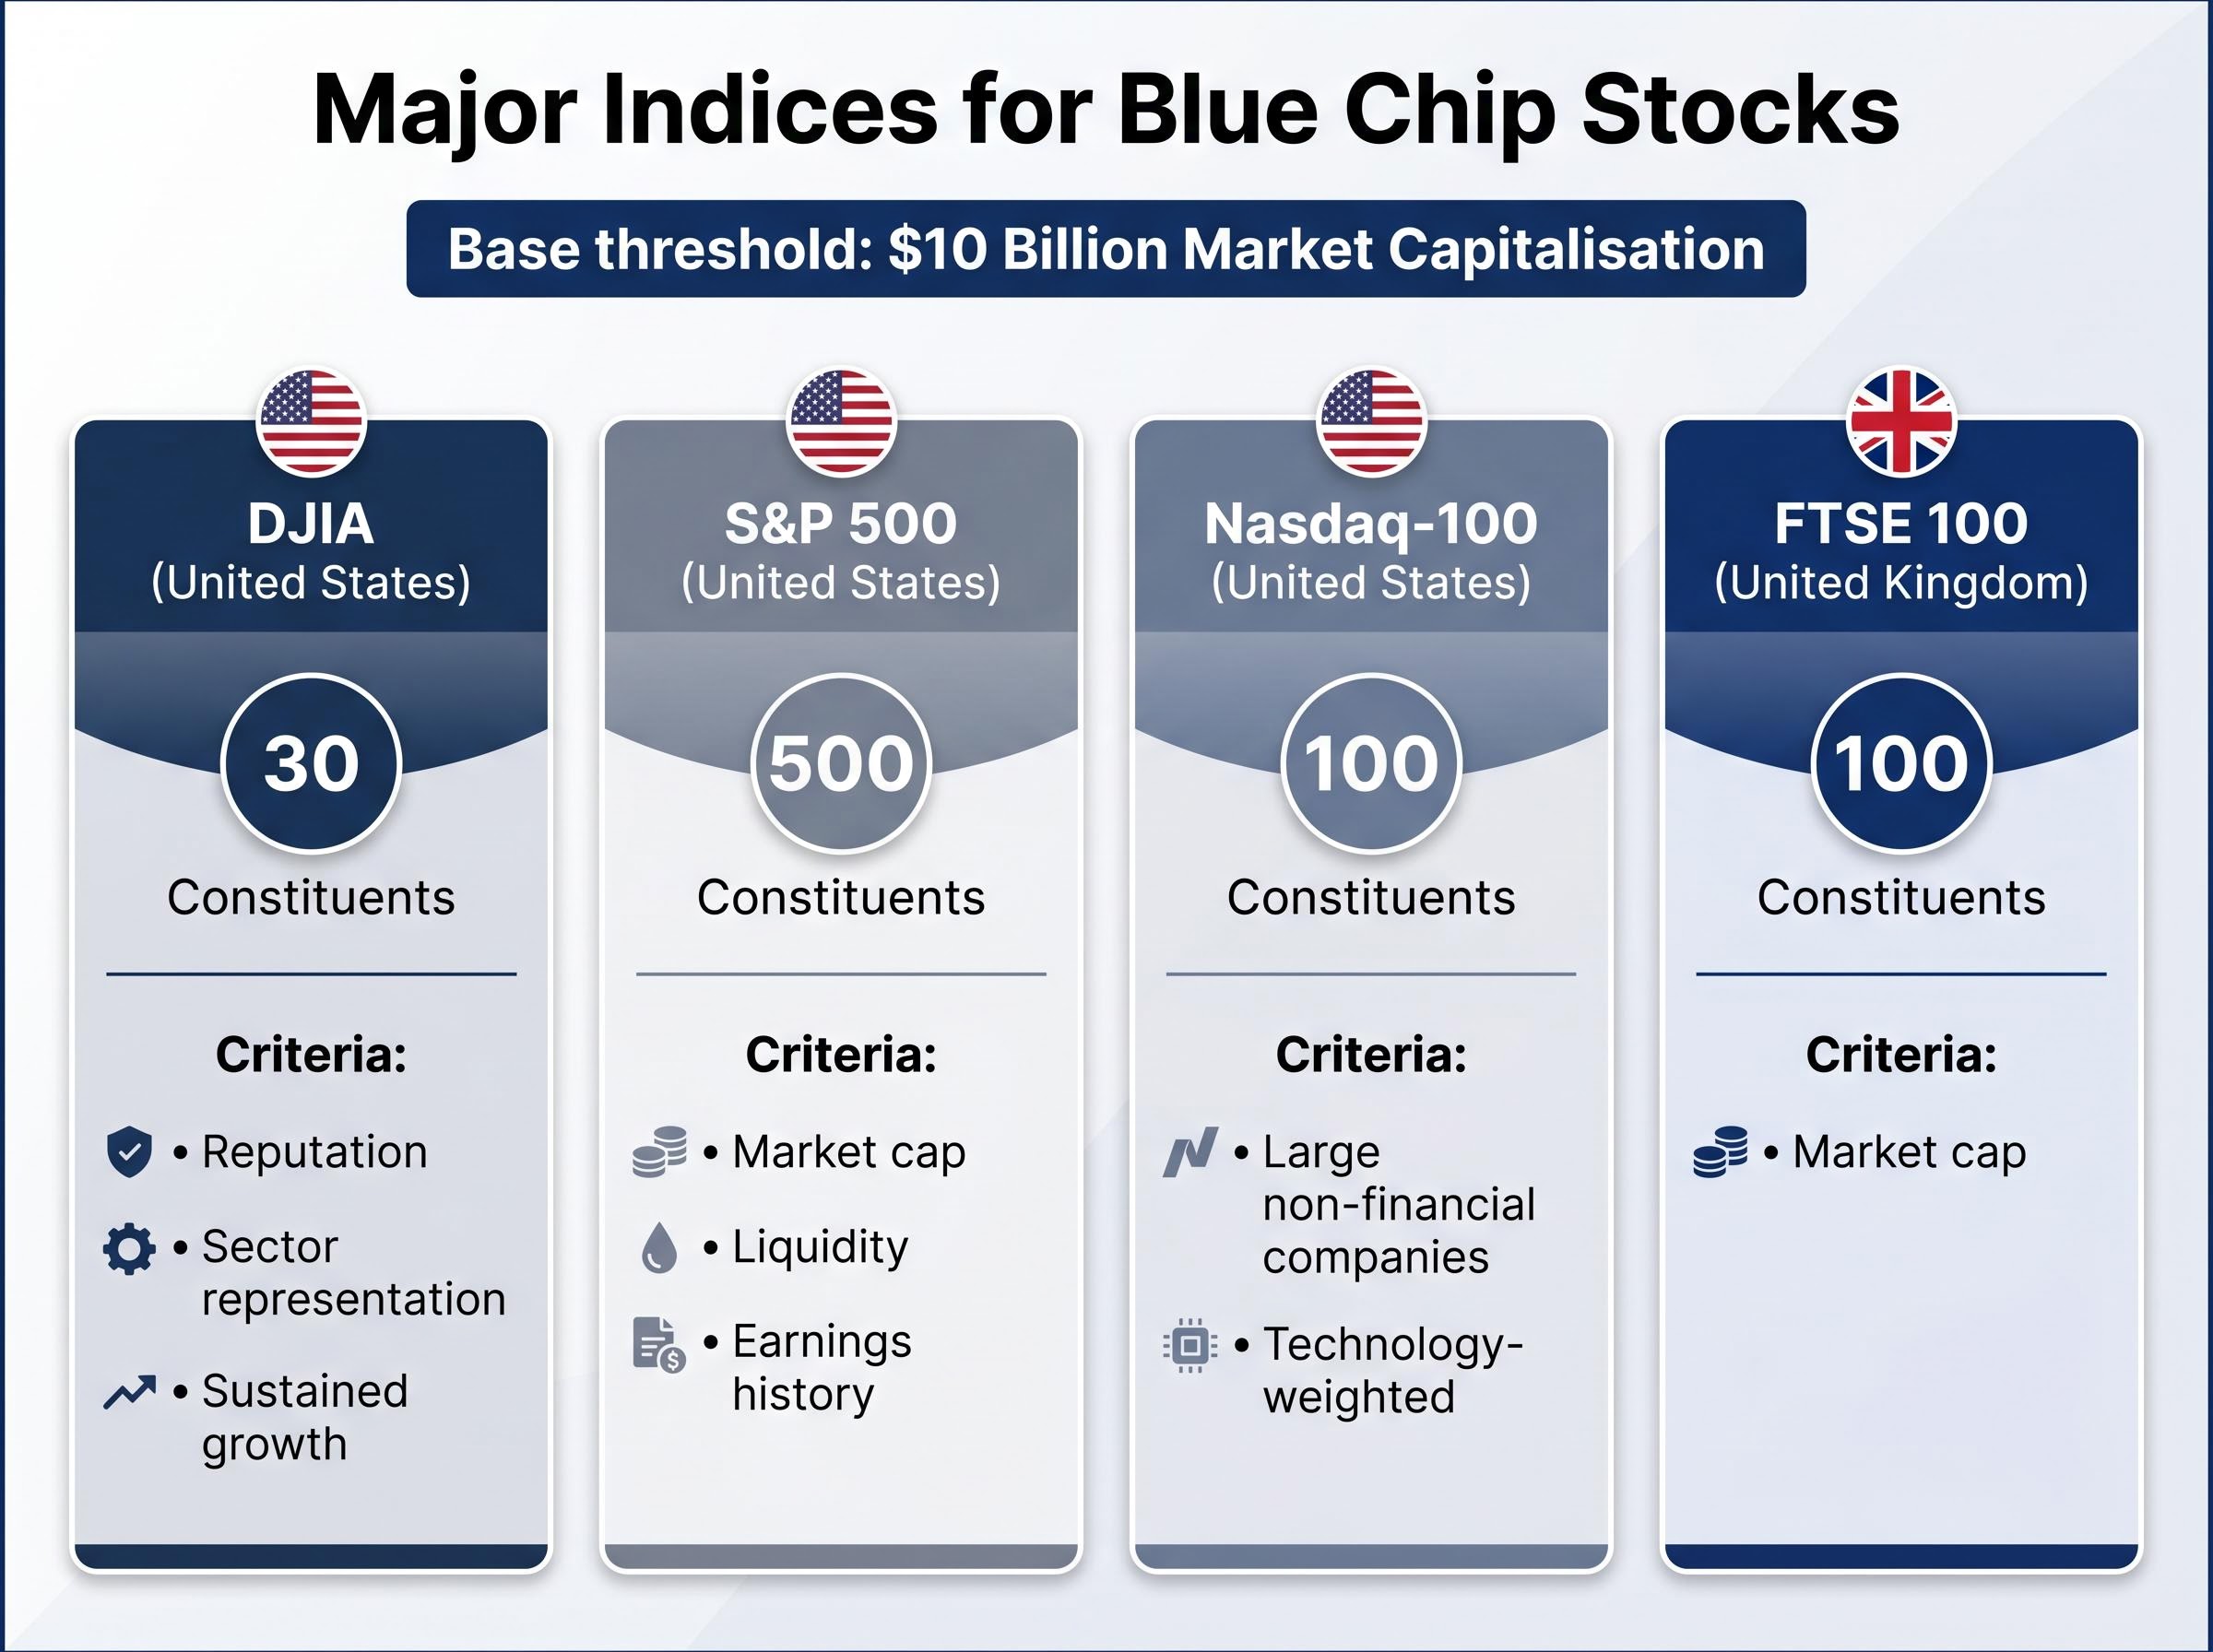
| Index | Constituents | Country | Primary selection criterion |
|---|---|---|---|
| DJIA | 30 | United States | Reputation, sector representation, sustained growth |
| S&P 500 | 500 | United States | Market cap, liquidity, earnings history |
| Nasdaq-100 | 100 | United States | Large non-financial companies, technology-weighted |
| FTSE 100 | 100 | United Kingdom | Market cap (largest listed on the London Stock Exchange) |
The S&P/TSX 60 in Canada serves a similar function for Canadian equities. The concept is not confined to U.S. borders.
A practical two-step screen works for most investors: check whether the company belongs to a major index, then confirm its market capitalisation exceeds the $10 billion threshold. Companies that clear both filters are, for most purposes, blue chip.
Names that consistently appear in these discussions include:
- IBM
- Coca-Cola
- Microsoft
- American Express
- McDonald’s
- JPMorgan Chase
- Walmart
- Boeing
These are illustrative, not exhaustive. The informal “Nifty Fifty” list, popular in the 1960s and 1970s, once served a similar identification function, though not every company on that list retained its blue chip standing across subsequent decades.
The honest risk profile: why blue chip does not mean bulletproof
The word “chip” carries an implicit promise of value. The historical record complicates that promise considerably.
Market and economic risk
Blue chip stocks are fully exposed to broad market downturns and macroeconomic contractions. Their reputation for stability reflects long-run track records, not immunity to drawdowns. During recessions, these companies lose market value alongside the broader index, and the size of the loss can be significant.
Blue chip status describes past financial resilience, not future protection. A long earnings history does not insulate a company from structural change, sector disruption, or systemic crisis.
Company-specific risk
The 2008 global recession delivered two failures that reshaped how investors think about blue chip safety. Lehman Brothers, a firm with over 150 years of operating history, collapsed under concentrated exposure to mortgage-backed securities and excessive leverage. General Motors, once the world’s largest automaker, filed for bankruptcy as legacy cost structures collided with a collapse in cyclical demand.
Both companies would have passed any reasonable blue chip screen in 2006. Neither survived 2008 intact.
The specific risks that apply even to blue chip portfolios include concentration in a small number of large-cap names, vulnerability to sector-specific disruption, and the danger of mistaking dividend history for forward earnings certainty. A portfolio of ten familiar names feels diversified. In practice, if those ten names share sector exposure or macroeconomic sensitivity, the diversification is thinner than it appears.
What blue chip dividends actually deliver and what they do not
Coca-Cola has maintained an uninterrupted dividend payment record spanning more than 120 years, beginning in 1893, according to Dividend.com.
That record is genuinely remarkable. Few institutions of any kind, let alone publicly traded companies, have sustained an unbroken commitment to shareholders across two world wars, a Great Depression, and multiple financial crises.
For income-oriented investors, blue chip dividends offer a predictable cash flow stream that compounds meaningfully over long holding periods, particularly within tax-advantaged retirement accounts. Reinvested dividends contribute to total return in a way that is easy to underestimate over 20- or 30-year time horizons.
The analytical question, however, is whether a long dividend history predicts future income. It does not, at least not with certainty. Dividend payments are board decisions made quarterly, and they depend on current earnings, cash flow, and capital allocation priorities. A company can maintain dividends for a century and cut them in a single quarter if conditions warrant.
When evaluating whether a blue chip company’s dividend is likely to persist, three factors deserve scrutiny:
- Payout ratio: the percentage of earnings distributed as dividends. A ratio consistently above 80-90% may indicate limited room for reinvestment or cushion against earnings declines.
- Earnings consistency: whether the company has maintained stable or growing earnings across multiple economic cycles, not just during expansionary periods.
- Debt service capacity: the company’s ability to service its debt obligations and still fund dividend payments without straining its balance sheet.
A high dividend yield, in isolation, can be misleading. When a company’s share price falls sharply, the yield rises mechanically even though the company’s financial health may be deteriorating. Yield is an output, not a signal of strength.
The dividend mechanics that confuse most investors start with the ex-dividend date: when a company pays out, its share price falls by approximately the same amount, meaning the payment represents a redistribution of existing value rather than the creation of new wealth, a distinction that matters considerably when evaluating whether a high yield reflects income generosity or a declining share price.
How to size your blue chip allocation and what to pair it with
Blue chip equities are strong foundational holdings. They are not, on their own, a complete portfolio strategy.
Allocation by life stage and risk tolerance
The appropriate weighting depends on three variables: age, income needs, and tolerance for short-term volatility. Younger investors with decades before retirement can typically sustain higher equity concentration and may benefit from the growth potential of blue chip holdings within a broader equity allocation. Investors approaching or in retirement may find that shifting weight toward bonds and cash instruments reduces the impact of market drawdowns on income they need in the near term.
Asset classes that complement blue chip equity exposure in a diversified portfolio include:
Portfolio resilience now requires more than a fixed equity and bond split, because the negative correlation between stocks and bonds that made the traditional allocation reliable broke down during inflation shocks in 2022 and 2025, meaning the diversification benefit that blue chip investors have historically counted on from fixed income may be weaker in the current regime than historical models suggest.
- Bonds (government and investment-grade corporate)
- Cash and cash equivalents (money market funds, short-term treasuries)
- Mid-cap equities (companies with market capitalisations between approximately $2 billion and $10 billion)
- Small-cap equities (companies below approximately $2 billion in market capitalisation)
The small-cap quality factor complicates the case for passive small-cap exposure as a blue chip complement: U.S. small-cap indexes carried a quality score of -0.64 as of December 2025, reflecting a structural tilt toward unprofitable companies that private capital has left behind after removing the highest-quality small firms through buyouts and delayed IPOs.
No single allocation percentage is universally correct. The right figure depends on individual circumstances, and financial guidance from sources including the SEC and Investor.gov consistently emphasises that diversification across asset types reduces portfolio risk more effectively than concentration in any single equity category.
Investor.gov diversification guidance from the SEC establishes that spreading holdings across asset types reduces overall portfolio risk more reliably than concentrating in any single equity category, including large-cap stocks with strong track records.
Direct stock purchase versus ETF exposure
Two primary access routes exist for blue chip investing, and they serve different investor profiles.
| Dimension | Direct stock purchase | ETF / index fund |
|---|---|---|
| Diversification | Limited to individual names selected | Broad; tracks dozens or hundreds of constituents |
| Cost | Per-trade commission (varies by broker) | Low annual expense ratio (often below 0.10%) |
| Flexibility | Full control over entry, exit, and position sizing | Trades as a single security; less granular control |
| Minimum investment | Price of one share (or fractional share where available) | Price of one ETF unit (often lower than individual blue chip shares) |
According to guidance from Investor.gov, the SEC, NerdWallet, and Morningstar, index funds and ETFs represent low-cost methods for most investors to gain broad blue chip exposure without concentrating in a handful of individual names. The DJIA (30 stocks) and the S&P 500 (500 companies) are both accessible through index-tracking ETFs, with the S&P 500 providing meaningfully broader diversification across the large-cap universe.
What strong companies look like from the outside: the case for financial literacy over brand recognition
Recognising a company’s logo at the supermarket is not the same as understanding its financial position. Brand familiarity is a useful starting point for identifying blue chip candidates, but it is not itself a qualifying criterion. The underlying financial metrics, market capitalisation, earnings stability, and index membership, must confirm what the brand suggests.
A practical verification process for confirming blue chip credentials using publicly available tools involves five steps:
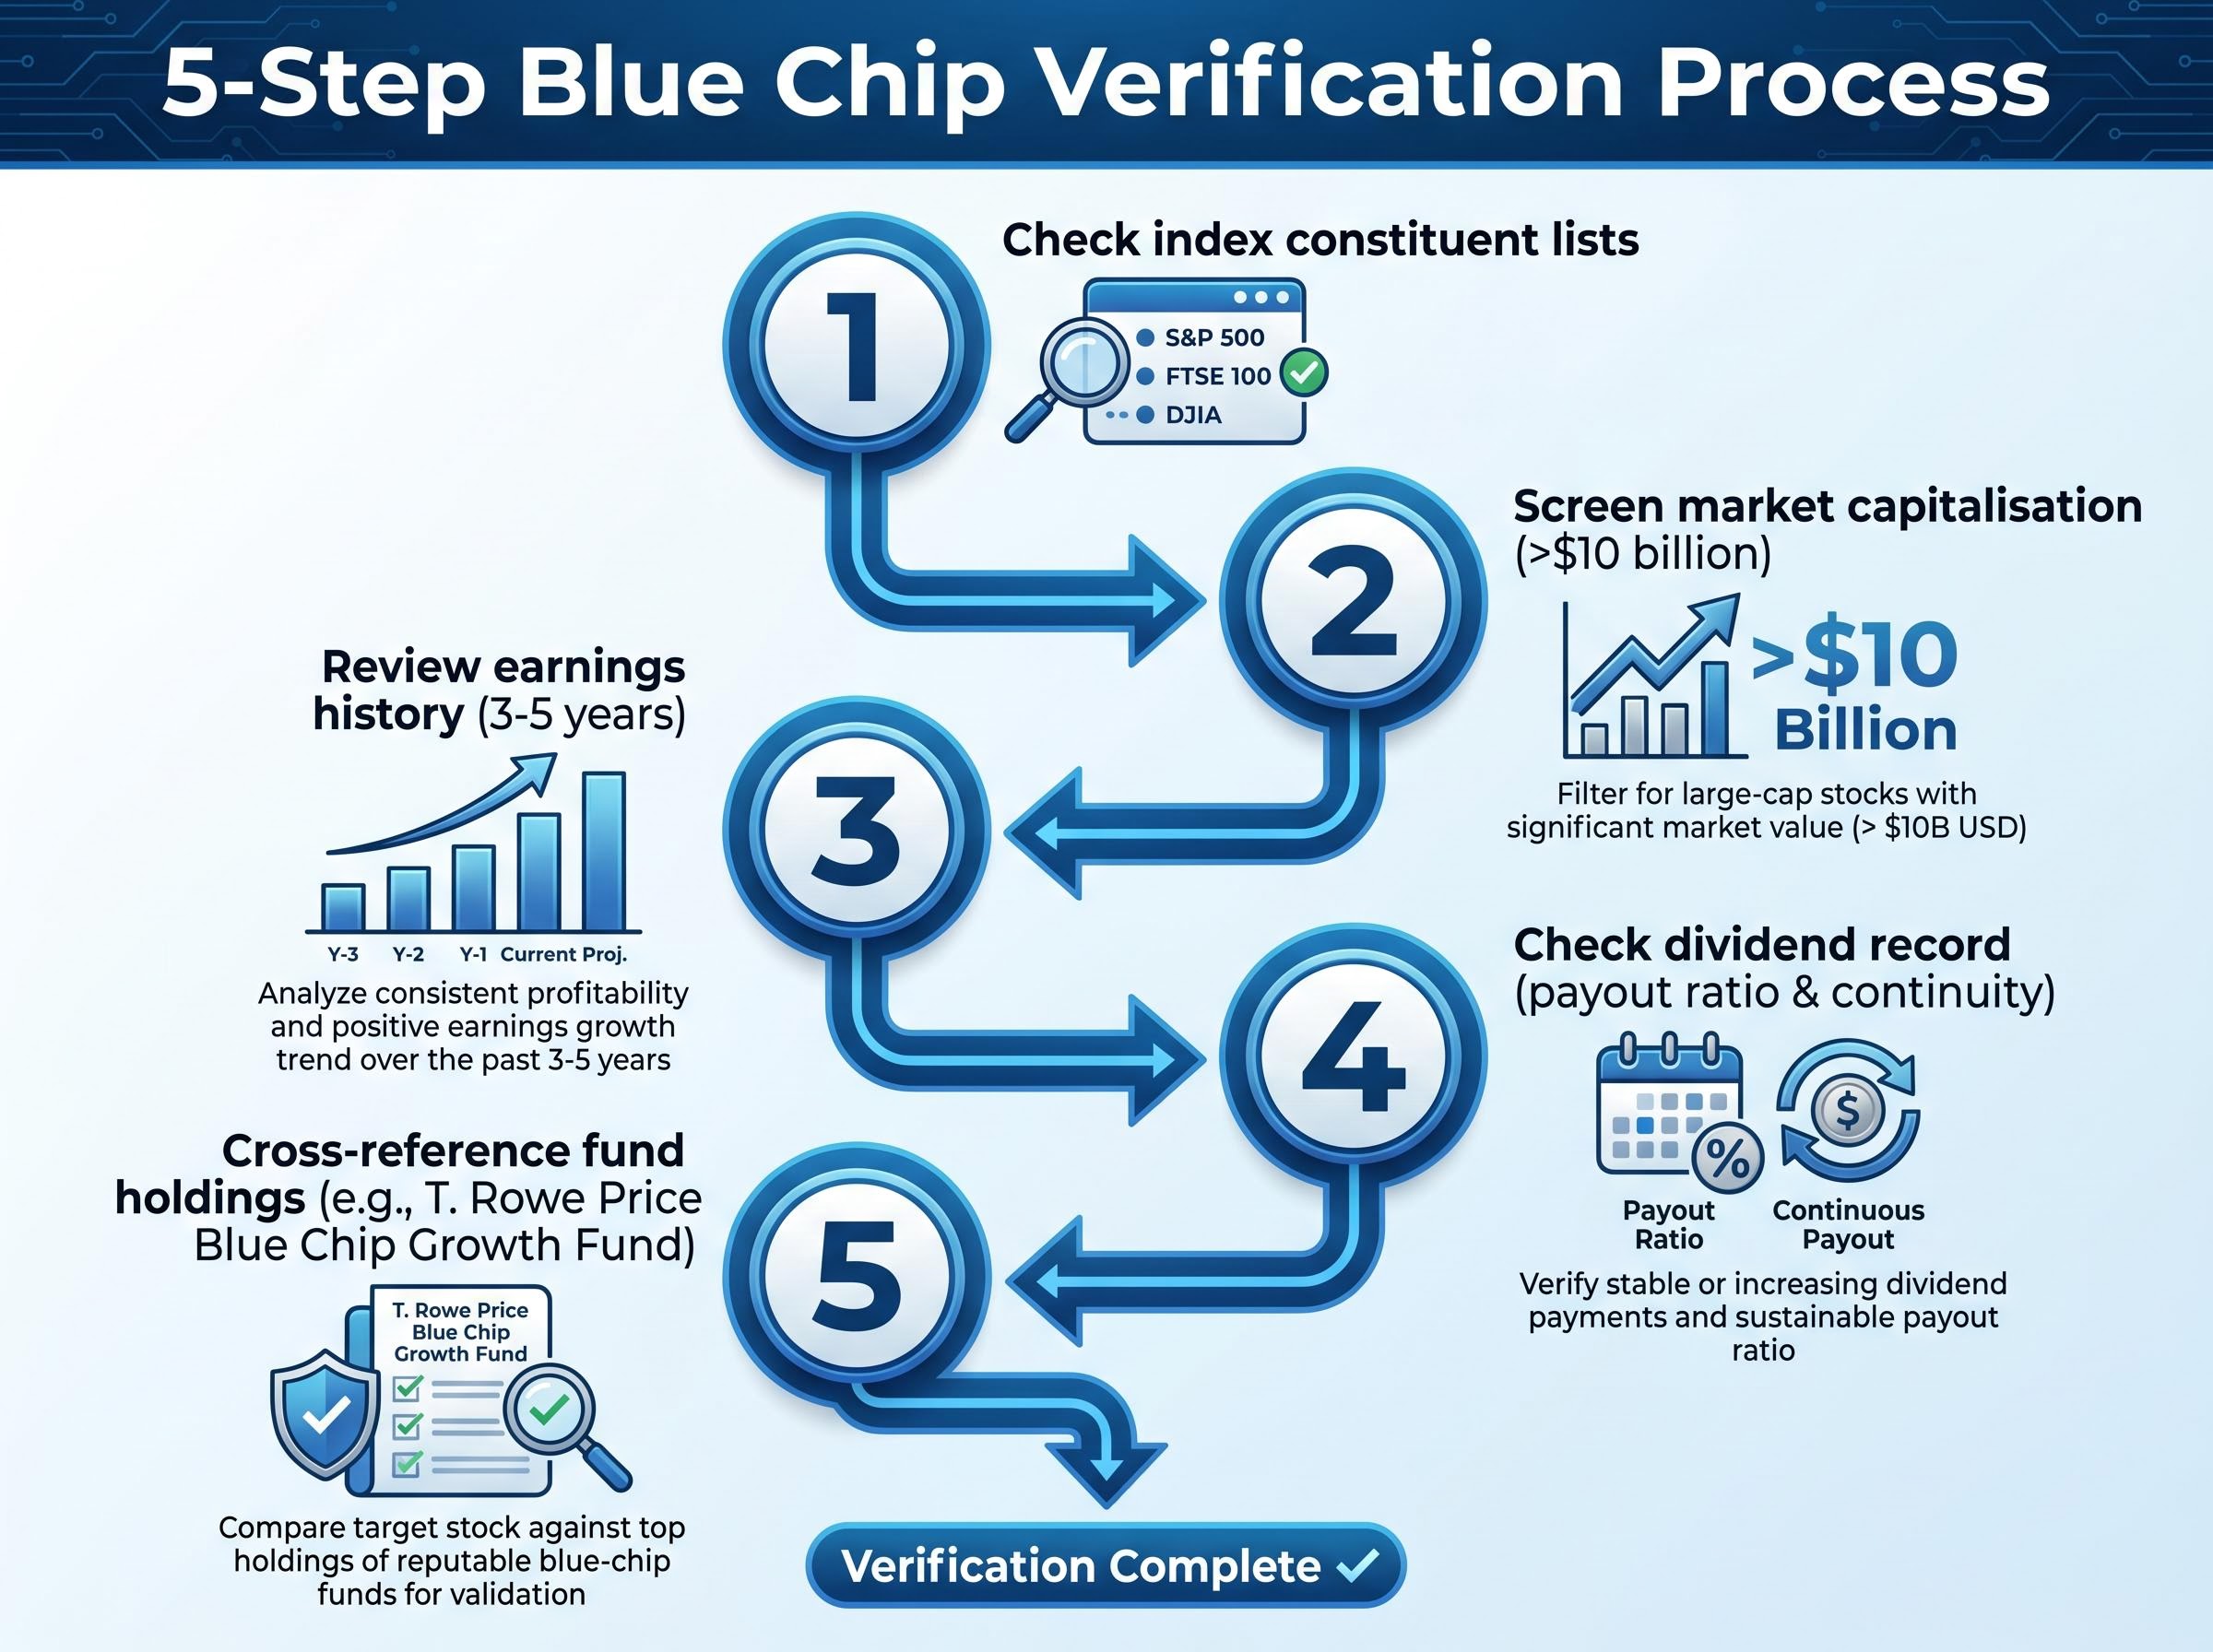
- Check index constituent lists on the SEC’s market-indices page or the index provider’s website to confirm the company belongs to a major benchmark.
- Screen market capitalisation through any financial data platform to verify the company exceeds the $10 billion threshold.
- Review earnings history across at least three to five years of reported results, looking for consistency rather than a single strong quarter.
- Check the dividend record if income is a priority, examining payout ratio and payment continuity.
- Cross-reference fund holdings by reviewing disclosures from blue chip-focused funds (the T. Rowe Price Blue Chip Growth Fund is one example) to see which names institutional managers treat as qualifying.
Blue chip status is a snapshot of current financial standing, not a permanent designation.
The Nifty Fifty list from the 1960s and 1970s illustrates this clearly. That cohort of companies was considered the definitive blue chip collection of its era. Several of those names no longer exist as independent entities, and others fell well below blue chip standing in subsequent decades. Ongoing monitoring matters as much as initial selection, because companies can exit indices, cut dividends, or face structural decline that the brand alone will not signal.
This article is for informational purposes only and should not be considered financial advice. Investors should conduct their own research and consult with financial professionals before making investment decisions.
Blue chip stocks are a foundation, not a finish line
The tension at the heart of blue chip investing is real: these companies offer genuine financial quality and track records measured in decades, but the term implies a degree of safety that the historical record does not fully support.
The practical takeaways are straightforward. Use index membership and market capitalisation as identification tools rather than relying on brand recognition. Evaluate dividends analytically, examining payout ratios and earnings consistency, rather than treating a long payment history as a guarantee. Complement blue chip holdings with bonds, cash, and smaller-capitalisation equities to manage concentration risk. Where individual stock selection feels impractical, ETFs offer broad blue chip exposure at low cost.
Blue chip stocks belong in most long-term portfolios. They do not, however, replace the need for diversification, ongoing research, or a clear understanding of individual risk tolerance. The investors who benefit most from these companies are the ones who treat them as a foundation for a broader strategy, not a substitute for one.
Readers wanting to ground these decisions in investing basics — covering risk profiles, fee structures, and account types — will find a structured starting point in our full explainer on the foundational choices that shape long-run returns before individual stock or fund selection enters the picture.