
The most financially successful investors in history built their fortunes by doing what crowds refuse to do: buying stocks that others have dismissed as boring, broken, or simply unfashionable. Warren Buffett and Howard Marks did not accumulate their track records by chasing momentum. They accumulated them by paying less than what a business was worth, then waiting.
Yet value investing as a strategy has faced genuine pressure. Growth stocks outpaced value by roughly 10 percentage points or more across major global indices in multiple recent periods through early 2025, and the debate over whether value investing still works is live among serious investors. The tension is real, not rhetorical.
This guide provides the complete framework. Readers will leave knowing exactly what value investing is (and is not), how to screen for value candidates using specific metrics with rule-of-thumb thresholds, where the strategy has documented weaknesses, and whether a passive value fund might serve them better than individual stock selection.
What value investing actually means (and what it does not)
The most common misconception is that value investing simply means buying cheap stocks. It does not. A stock trading at $2 is not inherently a value investment. A stock trading at $200 might be.
Value investing is the discipline of buying assets at a meaningful discount to their intrinsic worth, which is an estimate of what the business is genuinely worth based on its earnings power, assets, and future cash flows. The strategy traces its intellectual lineage to Benjamin Graham’s margin of safety concept: buy with enough of a gap between price and value that even if the estimate is somewhat wrong, the downside is limited.
Warren Buffett, speaking at the Berkshire Hathaway annual meeting on 4 May 2024, put it directly: “Growth is always a part of value.” The key, Buffett stated, is paying “less than what the business is worth,” even in a tech-dominated market.
That framing collapses the popular “value versus growth” binary. A fast-growing company purchased below its intrinsic value is a value investment. A slow-growing company purchased above its intrinsic value is not.
This distinction matters because it makes value investing inherently analytical and judgment-dependent. Estimating what a business is genuinely worth requires examining cash flows, competitive position, management quality, and industry dynamics. It is not a mechanical screen. The metrics that follow are tools for that analysis, not substitutes for it.
Intrinsic value estimation sits at the heart of value investing, and the dividend discount model, first formalised by John Burr Williams in 1938, remains one of the clearest illustrations of the underlying principle: a business is worth the present value of the cash it will generate for its owners over time.
When big ASX news breaks, our subscribers know first
The metric toolkit: how to screen for underpriced stocks
No single ratio tells an investor whether a stock is underpriced. Each metric below functions as a distinct lens, and each has blind spots. Used together as a checklist, they narrow the field of candidates worth deeper research.
Price-to-earnings (P/E) ratio measures how much investors pay per dollar of annual earnings. Many practitioners consider P/E ratios below 15, or at a 20-30% discount to the broad market average, as broadly indicative of value. The S&P 500’s historical average sits in the mid-teens; value-tilted investors often target companies at a P/E in the low teens or single digits relative to peers.
The limitations of the P/E ratio become most acute when earnings are temporarily distorted by one-off items, accounting choices, or cyclical troughs, precisely the conditions where a superficially cheap screen can mislead an investor into a position that looks like value but is not.
Price-to-book (P/B) ratio compares a company’s market price to the stated value of its assets minus liabilities. A P/B below 1.5 is often considered indicative of value; below 1.0 is sometimes labelled “deep value.” However, P/B is significantly less informative for intangible-heavy companies (software, brands, research-intensive firms) because accounting rules expense most intangible investment, depressing book value and distorting the ratio.
Debt-to-equity (D/E) ratio gauges how much a company relies on borrowed money relative to shareholder equity. A D/E below 1.0 signals moderate leverage; below 0.5 is considered conservative within many value screens for non-financial companies. Sectors where leverage is structurally higher, such as utilities and telecoms, require adjusted expectations.
Free cash flow (FCF) yield measures the cash a business generates after capital expenditures as a percentage of its market value. According to J.P. Morgan Asset Management, FCF yield above 5% is often used as a screen for cash-generative value candidates; above 8% is sometimes cited as a deep-value threshold.
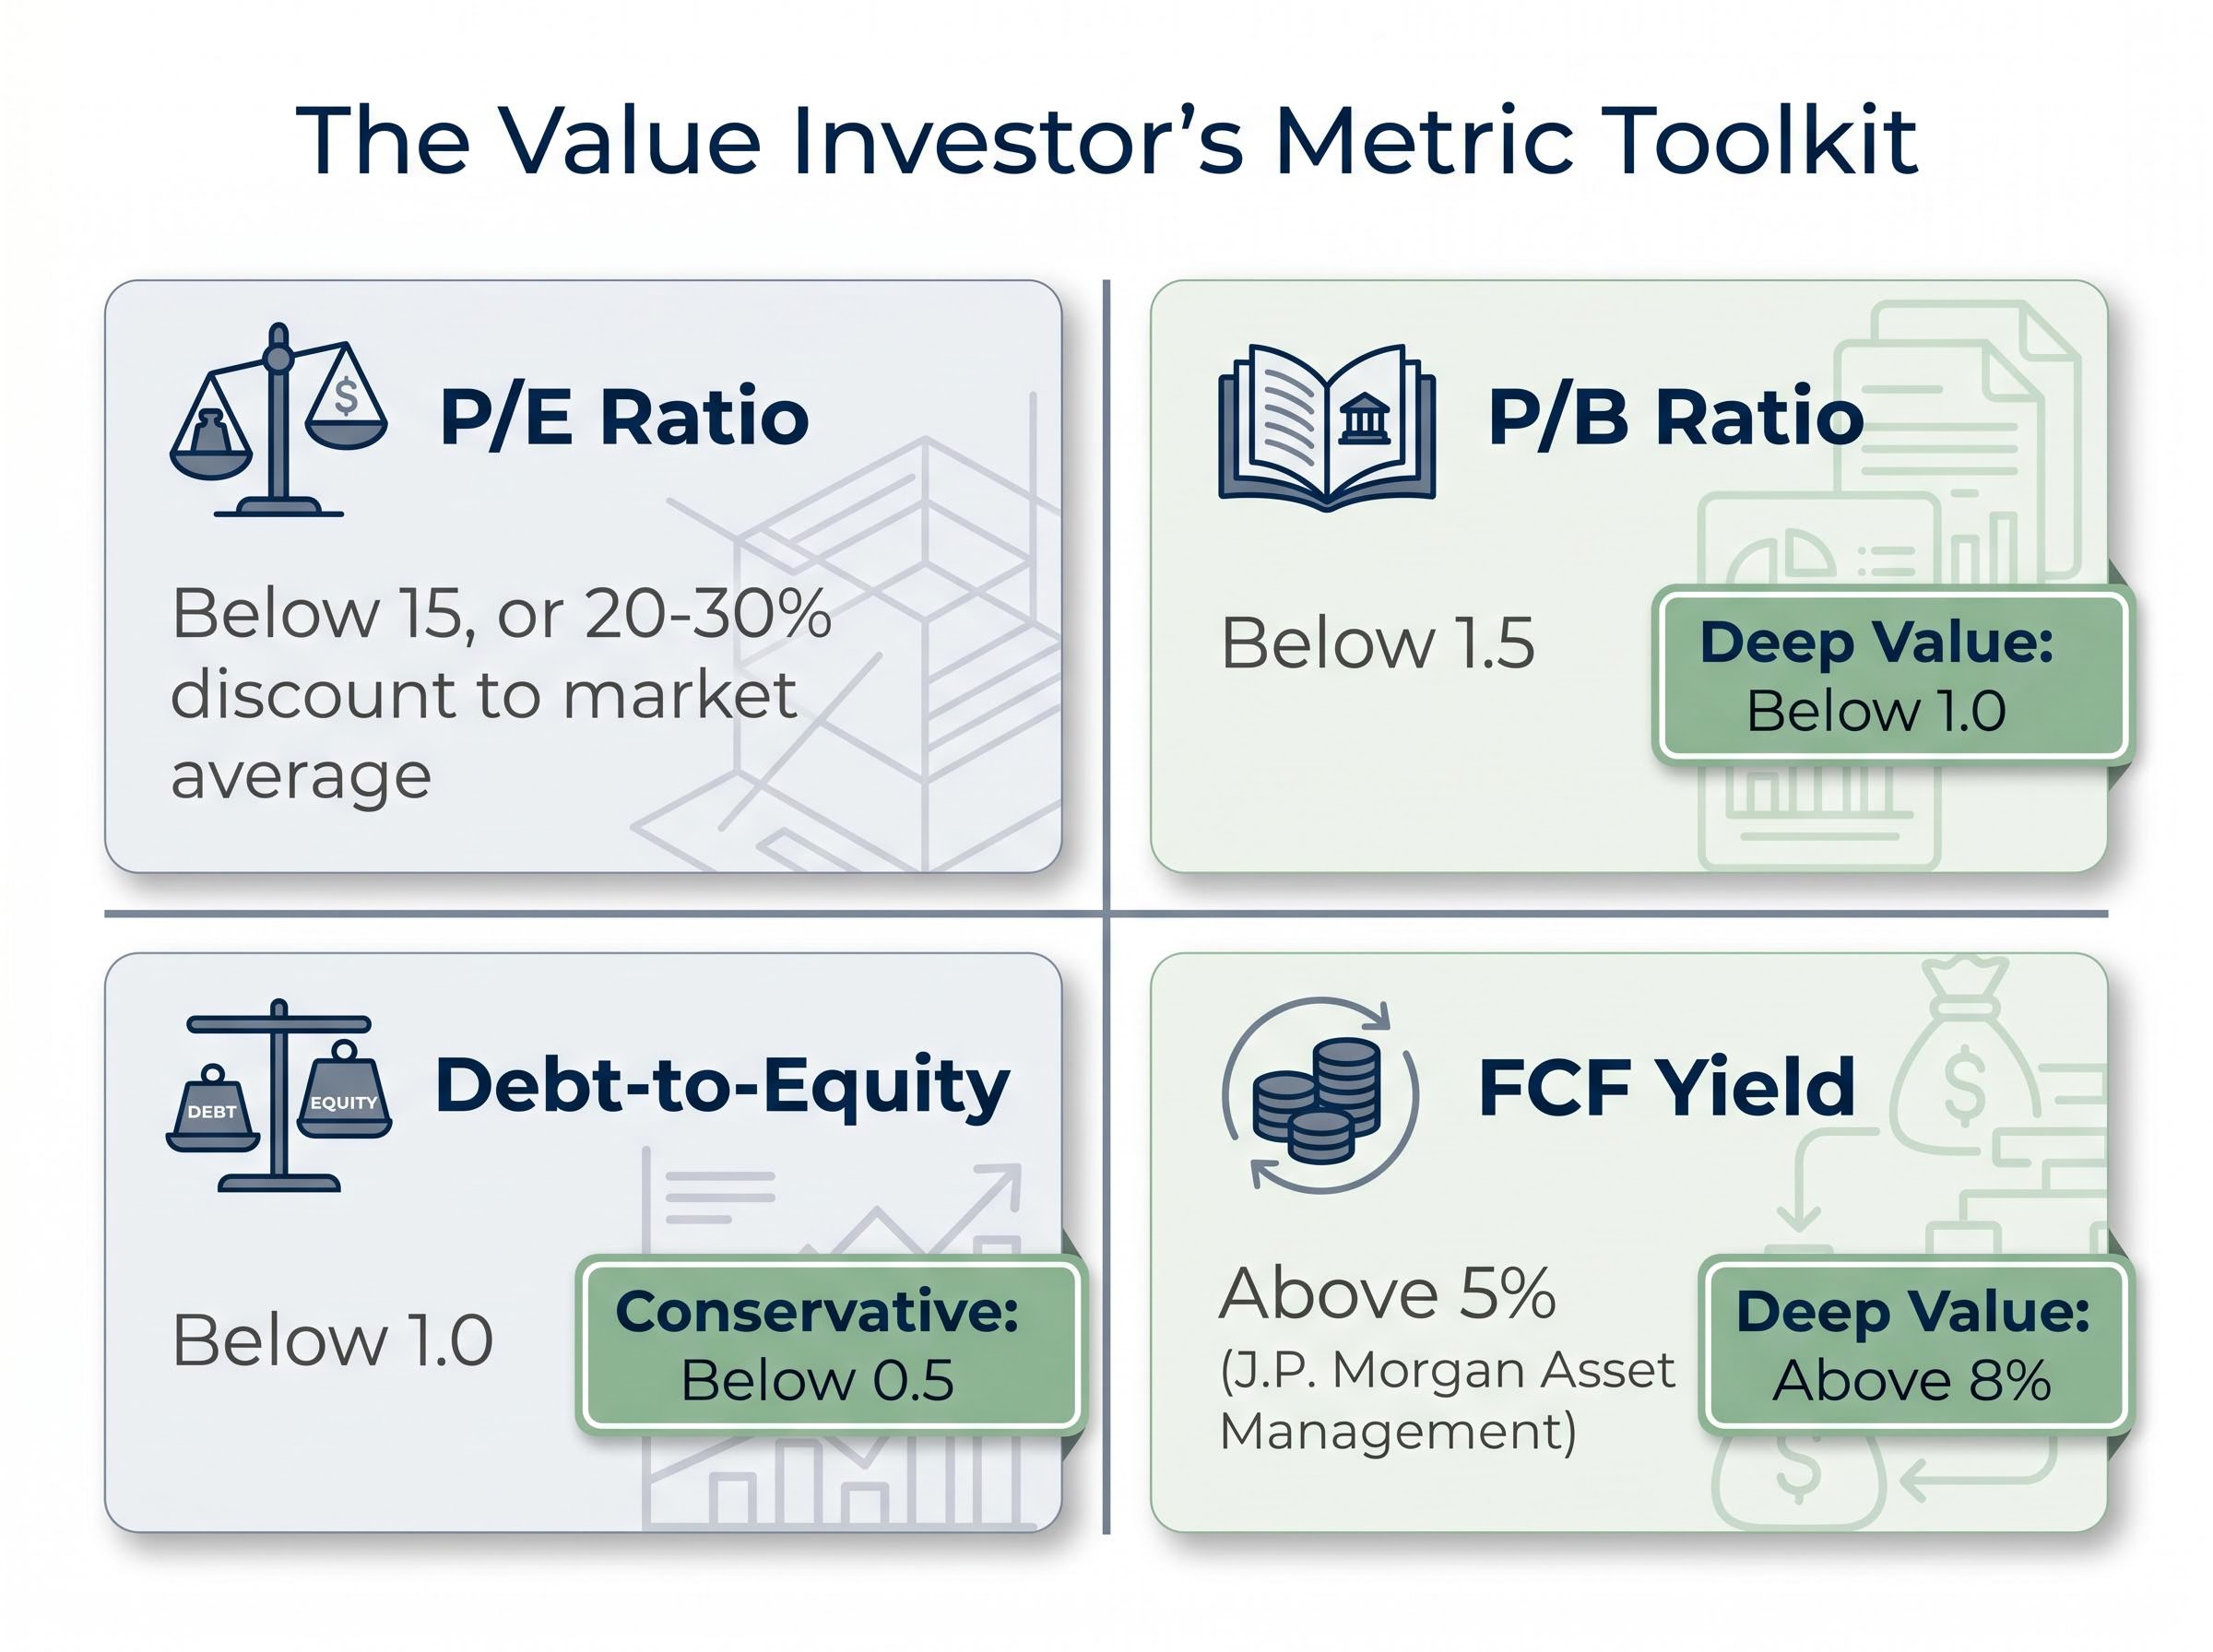
A FCF yield above 5% serves as a baseline screen for identifying cash-generative businesses that may be underpriced relative to the cash they produce.
| Metric | What It Measures | Typical Value Threshold | Key Caveat |
|---|---|---|---|
| P/E Ratio | Price per dollar of earnings | Below 15, or 20-30% below market average | Can be misleading if earnings are temporarily depressed or inflated |
| P/B Ratio | Price relative to book value of assets | Below 1.5 (deep value: below 1.0) | Unreliable for intangible-heavy sectors (tech, pharma, brands) |
| Debt-to-Equity | Leverage relative to shareholder equity | Below 1.0 (conservative: below 0.5) | Structural leverage varies by sector; financials and utilities carry more |
| FCF Yield | Free cash flow as a percentage of market value | Above 5% (deep value: above 8%) | Capital-intensive businesses may show low FCF despite strong earnings |
Using multiple metrics as a checklist, not a verdict
A low P/E paired with high debt and thin free cash flow may signal a struggling company, not a bargain. Aswath Damodaran, NYU professor and valuation expert, has argued that purely mechanical screens “miss many modern value opportunities,” particularly in tech and intangible-heavy firms. He advocates focusing on intrinsic value via discounted cash flow analysis rather than relying on narrow accounting ratios alone.
The practical rule: cross-check at least two or three metrics before treating any stock as a candidate worth deeper qualitative research. The table above is a starting filter, not an endpoint.
How growth and value investing differ in practice
The two approaches diverge at a fundamental level. Value investors pay for current earnings and assets, accepting slower growth in exchange for a margin of safety on price. Growth investors pay for expected future earnings expansion, accepting higher current valuations in exchange for a longer runway of compounding.
Recent performance data makes the cost of that divergence visible:
- The MSCI World Growth Index outperformed the MSCI World Value Index by approximately 9 percentage points in the 12 months to 31 January 2025, driven largely by US mega-cap technology stocks (Financial Times, 14 February 2025).
- For the year to 30 September 2024, MSCI World Growth returned approximately 23% versus approximately 12% for MSCI World Value, a gap of roughly 11 percentage points (MSCI factor performance update, 6 October 2024).
- Over the five years to 29 February 2024, global growth stocks outpaced value by more than 40 percentage points cumulatively, even after value’s brief 2022 resurgence (Robeco, 7 March 2024).
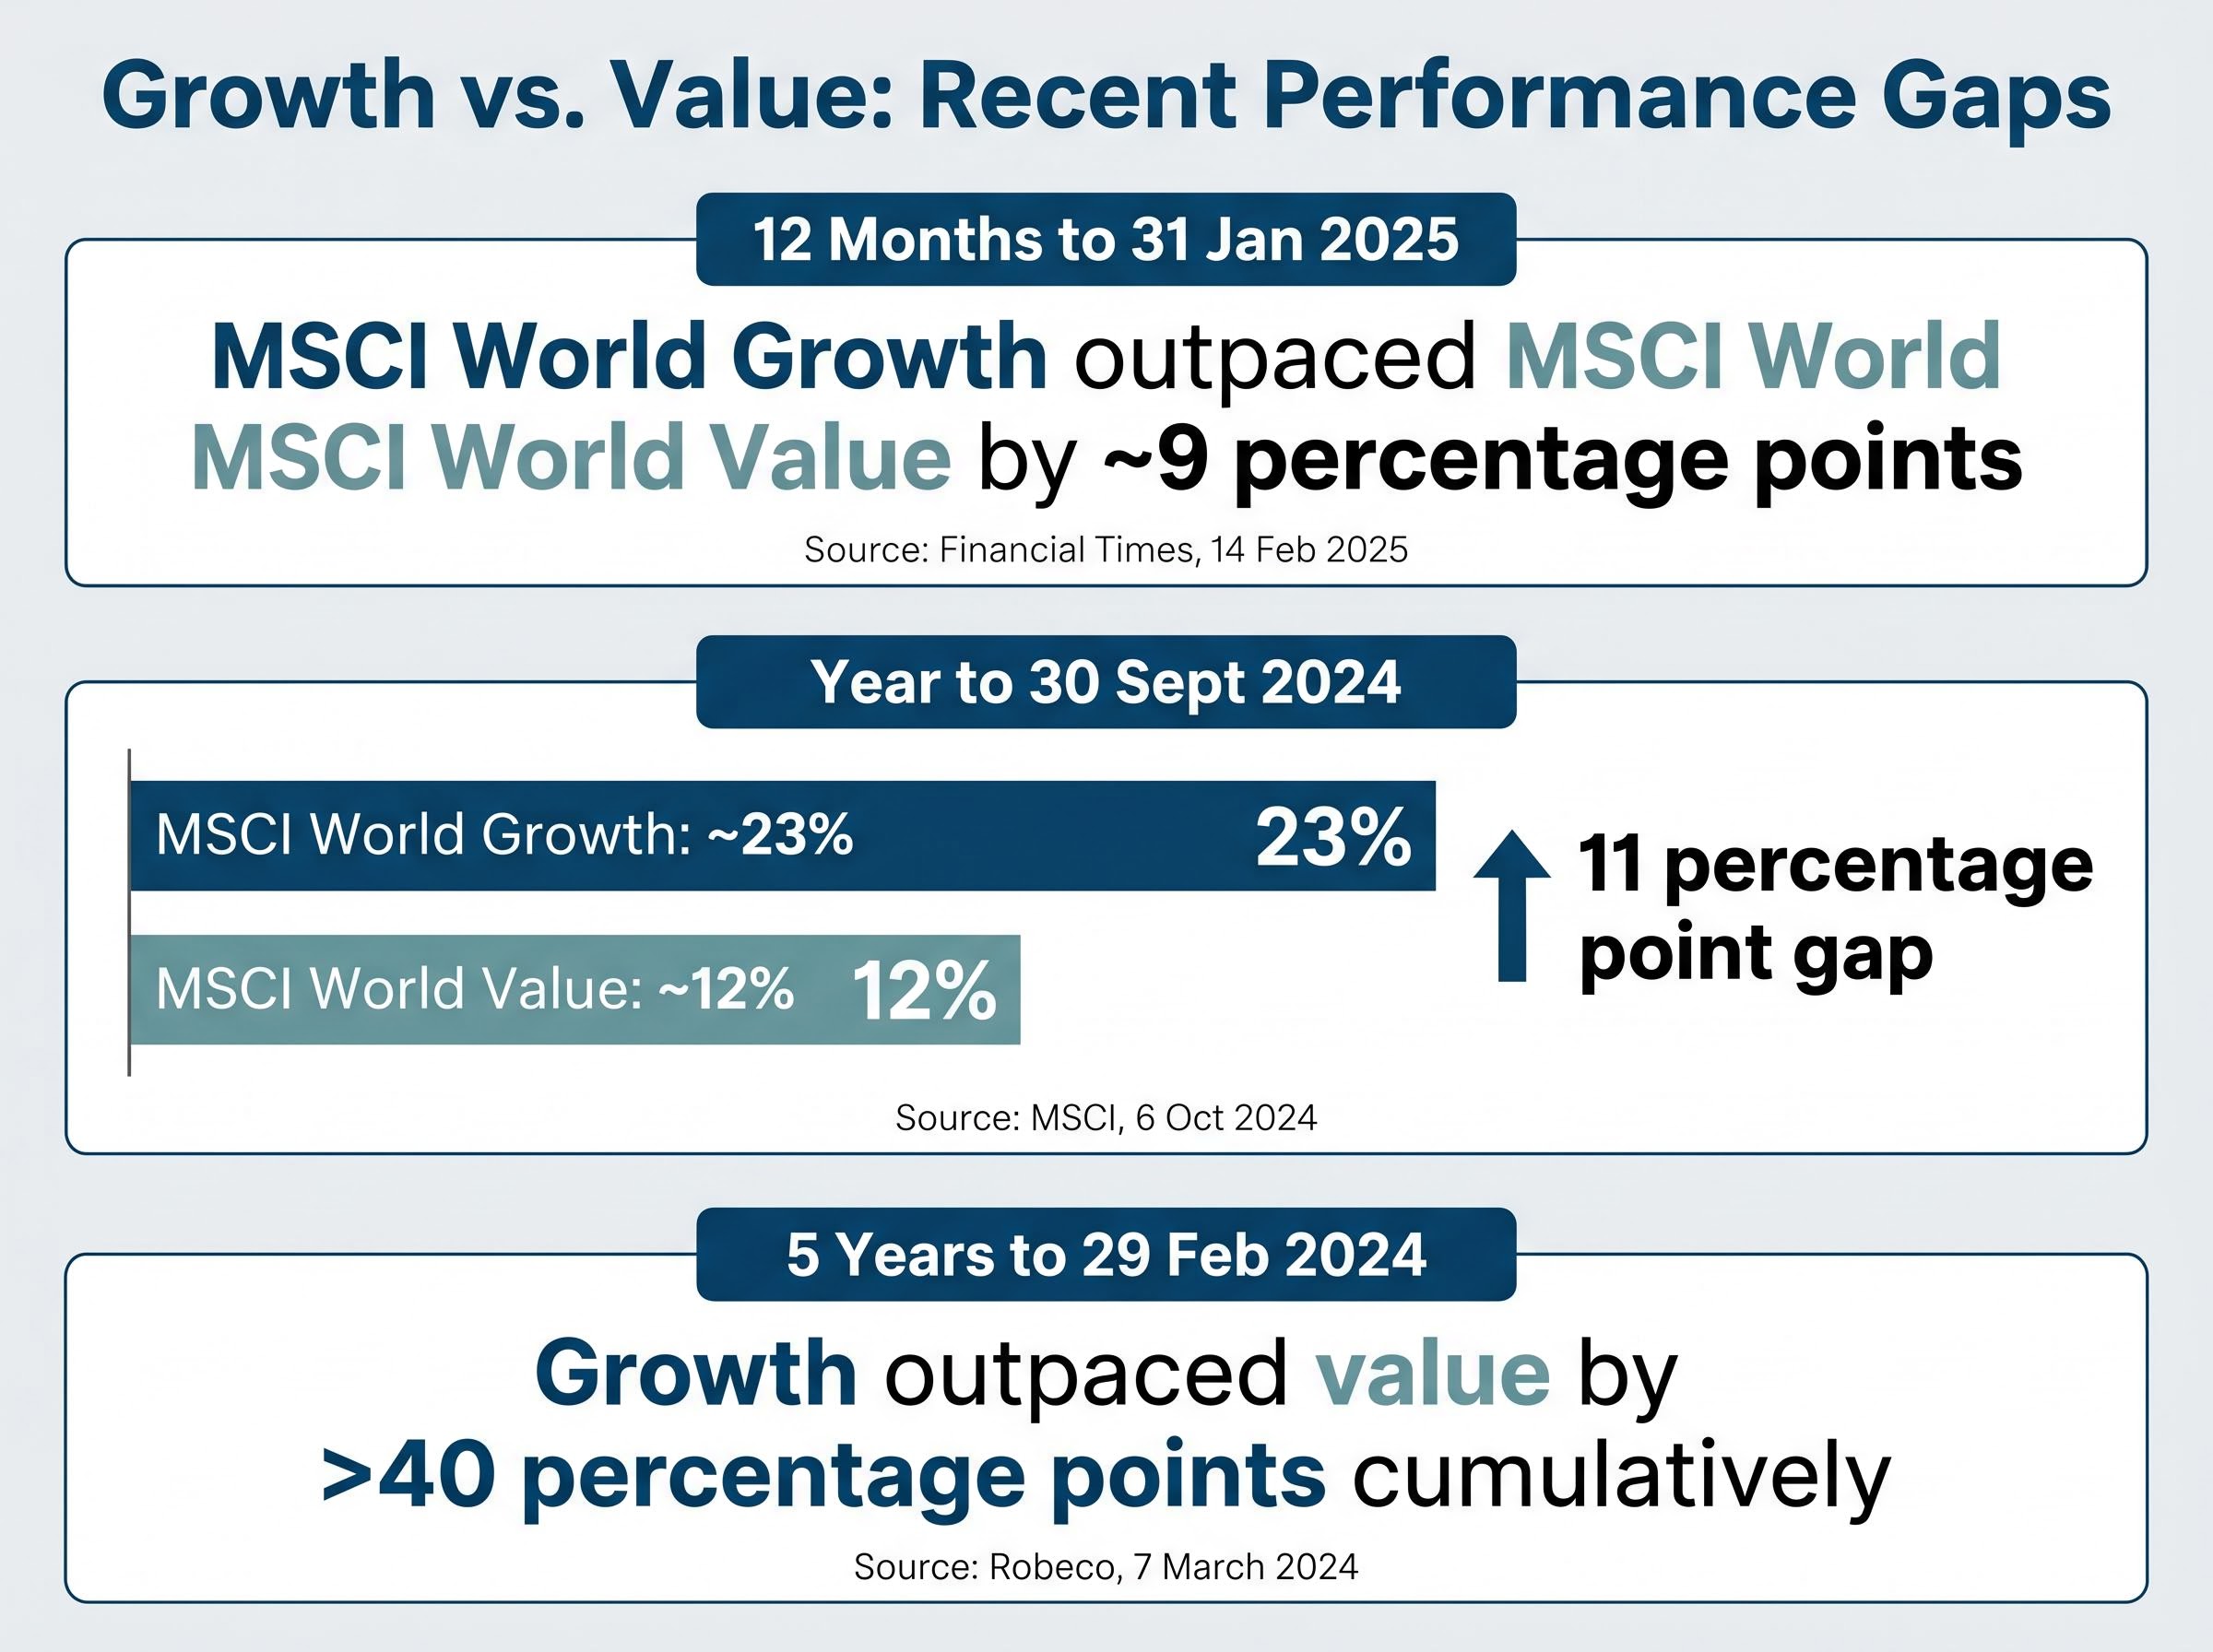
Those numbers are not a permanent verdict. They reflect a specific period shaped by near-zero interest rates, massive fiscal stimulus, and the dominance of a handful of US technology giants.
Growth stock valuations shifted meaningfully in early 2026, with Morningstar data showing a 21% discount to fair value across the category as of late March, a level that has historically occurred less than 5% of the time since 2011 and that adds a further layer of complexity to the value-versus-growth comparison.
Howard Marks, in his 18 November 2024 memo “Sea Change: Two Years Later,” argued that the shift to a higher-rate, more inflation-prone world “may favour classic value investing again,” because capital is no longer “free” and investors are more discriminating toward profitless growth stories.
Cliff Asness of AQR Capital Management made a complementary point in March 2025: valuation spreads between cheap and expensive stocks remain “wider than average” globally, supporting a forward-looking case for value. The gap between current performance and future potential is precisely what makes the choice between value and growth a question of time horizon and conviction rather than a simple ranking.
The real risks of value investing: traps, dry spells, and definition drift
Understanding how value strategies fail in practice is as important as understanding how they succeed. The risks are specific and plausible, not abstract.
- Value traps. Companies that look cheap on metrics but are cheap because their underlying businesses are structurally declining. Traditional retail, legacy media, and old-line energy names frequently appear in value screens. Relying on simple ratios without assessing business quality and industry disruption is, as the Financial Times noted in July 2024, “a systematic failure mode, not an occasional outlier.”
- Prolonged underperformance. Value has underperformed growth for much of the period since 2007. Robeco described the 2010s as a “lost decade” for many value strategies. Investors who commit to value must accept the possibility of multi-year stretches where their portfolios trail the broader market, and where friends holding growth funds appear to be making the smarter choice.
- Intangible-metric mismatch. Price-to-book and other balance-sheet measures can significantly misclassify asset-light technology and service companies, according to CFA Institute research from September 2024. In economies increasingly dominated by software, brands, and research spending, book value alone is a poor proxy for business worth.
- Crowding and factor commoditisation. Because value factors are now widely implemented via ETFs and smart-beta products, there is a risk of overcrowding in certain cheap segments, potentially dampening future excess returns relative to what historical academic studies recorded (J.P. Morgan Asset Management, June 2024).
- Sector concentration. Many value index funds carry heavy weights in financials, energy, and traditional industrials, creating cyclical and commodity price sensitivity that may not suit every investor’s risk profile (Morningstar, October 2024).
- Definition drift. Different index providers define “value” using varying combinations of P/E, P/B, dividend yield, and cash-flow metrics, meaning two ETFs both labelled “value” may hold substantially different portfolios.
Avoiding value traps requires classifying sector declines before applying any valuation multiple, because a low P/E in a structurally disrupted industry reflects permanently impaired earnings rather than a temporary pricing inefficiency, and the two situations demand entirely different responses.
EBI Capital’s analysis of the value premium, drawing on Fama and French’s foundational research, documents that the value factor’s monthly returns carry significant volatility, which helps explain why long holding periods are a structural requirement of the strategy rather than simply a matter of investor preference.
When “value” does not mean what you think it means
The label “value fund” or “value ETF” is not standardised. A CFA Institute commentary from January 2025 highlighted that the lack of a universal definition creates real confusion for investors comparing products or benchmarking performance. Two funds both marketed as “value” may disagree on whether a given stock qualifies.
The practical implication: examine the actual holdings and index methodology of any value-labelled product rather than assuming equivalence based on the label alone.
Value-focused index funds: the lower-effort path
The previous section described how individual stock-picking exposes value investors to traps, sector concentration, and metric mismatch. Passive value index funds and ETFs do not eliminate these risks entirely, but they address several of them structurally: they diversify across dozens or hundreds of holdings, rebalance systematically, and remove the need for ongoing individual company analysis.
For investors seeking a value tilt without stock-level research, several well-known, low-cost options span US large-cap and global developed markets.
| Fund Name / Ticker | Market Focus | Expense Ratio / OCF | Index Tracked |
|---|---|---|---|
| Vanguard Value ETF (VTV) | US Large-Cap Value | 0.03% | CRSP US Large Cap Value Index |
| iShares Russell 1000 Value ETF (IWD) | US Large/Mid-Cap Value | 0.19% | Russell 1000 Value Index |
| SPDR Portfolio S&P 500 Value ETF (SPYV) | US Large-Cap Value | 0.04% | S&P 500 Value Index |
| iShares MSCI World Value Factor UCITS ETF | Global Developed Markets | 0.30% | MSCI World Enhanced Value Index |
| Vanguard FTSE All-World High Dividend Yield UCITS ETF | Global (Dividend/Value Tilt) | 0.29% | FTSE All-World High Dividend Yield Index |
Note: all expense ratios are subject to change. Investors should verify current figures directly with fund providers before making decisions.
The US-listed options (VTV, IWD, SPYV) carry expense ratios at or below 0.19%, with VTV at just 0.03%. For non-US investors, UCITS-structured products provide access to global or dividend-tilted value strategies at costs below 0.30%.
Before selecting a value fund, consider three questions:
- What index does it track, and how does that index define “value”?
- What is the sector concentration, and does it align with the risk profile of the broader portfolio?
- What is the fund’s geographic scope, and does that complement existing holdings?
Is value investing right for you? A framework for deciding
Understanding the strategy is distinct from knowing whether it fits a specific investor’s situation. Three dimensions shape that assessment:
- Time horizon. Value strategies can require multi-year patience before the discount between price and intrinsic value narrows. Robeco’s description of the 2010s as a “lost decade” for value is not historical trivia; it is the realistic downside scenario. Investors with shorter time horizons, particularly those who need portfolio liquidity within three to five years, may find value tilts frustrating in growth-dominated environments.
- Temperament. Holding a value portfolio through a period where growth-oriented peers report dramatically higher returns requires genuine conviction, not just intellectual agreement. The AQR research published in March 2025 noted the “career risk” that even professional fund managers face during prolonged value dry spells. Retail investors face the equivalent psychological pressure.
- Time commitment. Active stock selection using the metric toolkit above requires ongoing analysis, monitoring earnings reports, reassessing intrinsic value estimates, and watching for deterioration in business quality. Passive value funds reduce that commitment substantially while still delivering the factor tilt.
Howard Marks stressed in his November 2024 memo that price discipline matters regardless of style: even high-quality businesses can be poor investments at excessive valuations. The principle applies in both directions.
For investors who understand the risks, possess a long horizon, and can access low-cost vehicles, a value tilt represents a coherent, evidence-supported component of a diversified portfolio. AQR’s finding that valuation spreads remain “wider than average” globally offers a specific, data-grounded reason for long-horizon investors to consider the approach.
Value investing in 2025: a strategy that still demands patience and precision
Value investing is a disciplined, evidence-supported strategy, but it is not a shortcut. The premium, where it exists, is compensation for the patience and analytical rigour it requires.
The honest tension remains. Growth has outperformed value across most recent measured periods. Yet valuation spreads remain wide, the interest rate environment has shifted, and serious investors, Buffett, Marks, and Asness among them, continue to make the case for price discipline.
For those ready to explore further, starting with a passive value fund while building familiarity with the screening metrics is a reasonable, low-risk entry point. For investors committed to individual stock selection, the metric toolkit provides a screening starting point; qualitative judgment about business quality, competitive position, and management integrity does the rest.
Value investing rewards those who understand what they are buying and why, and who are willing to wait for the market to agree.
This article is for informational purposes only and should not be considered financial advice. Investors should conduct their own research and consult with financial professionals before making investment decisions. Past performance does not guarantee future results. Financial projections are subject to market conditions and various risk factors.