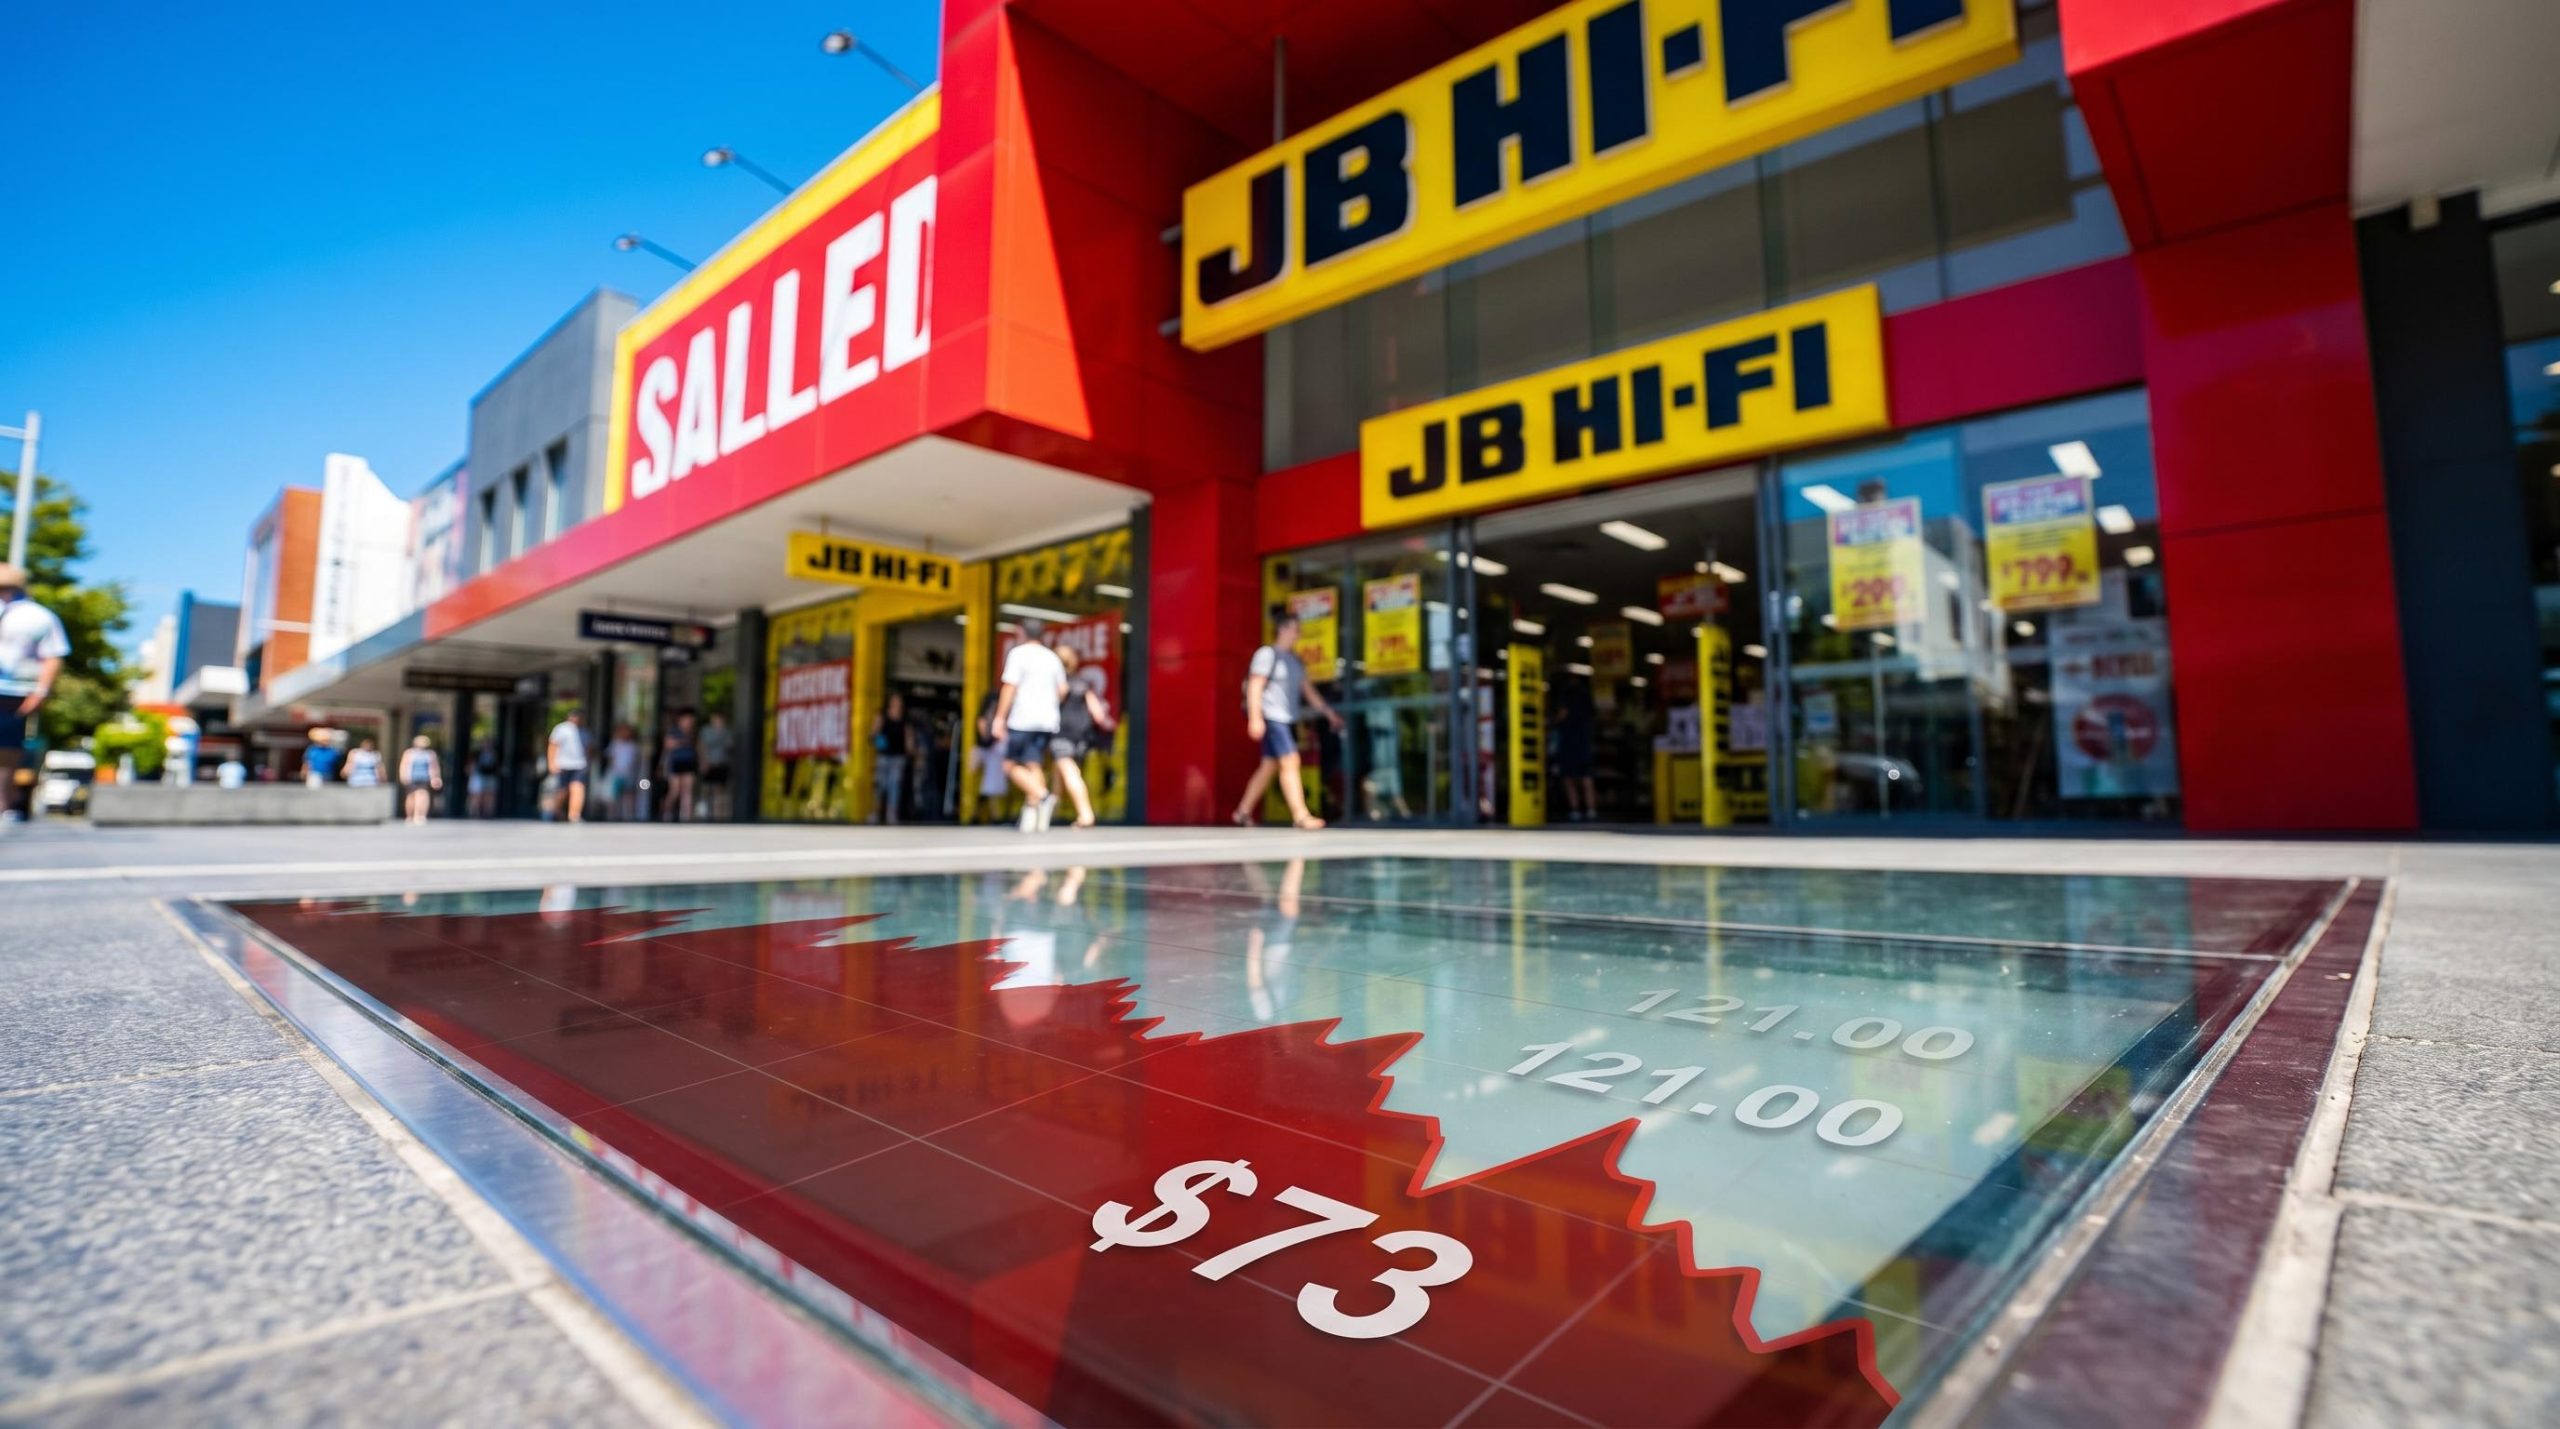
JB Hi-Fi delivered 10% sales growth to $10.55 billion in FY25, yet the JB Hi-Fi share price has fallen more than 30% over the past 12 months, trading roughly 40% below its 52-week high of $121.00. That disconnect between operational performance and market pricing makes the stock one of the more interesting analytical puzzles on the ASX right now.
The broader context sharpens the question. Australian consumer discretionary stocks have de-rated through 2025 and into 2026, caught between persistent cost-of-living pressures, elevated interest rates, and weakening household confidence. JB Hi-Fi has fallen further than most of its peers.
What follows is a clear assessment of whether this sell-off reflects genuine business deterioration or a macro-driven overreaction. The analysis uses the company’s financials, divisional structure, capital efficiency, and current valuation signals to weigh both sides of the argument and identify the forward indicators that will determine which reading proves correct.
What the share price collapse actually looks like in numbers
Before interpretation, the raw data.
JB Hi-Fi shares have declined 23.6% from the start of 2025 through late May 2026, with the stock trading in the range of $73.09-$73.66. The total decline over the past 12 months exceeds 30%, and the current price sits approximately 40% below the 52-week high.
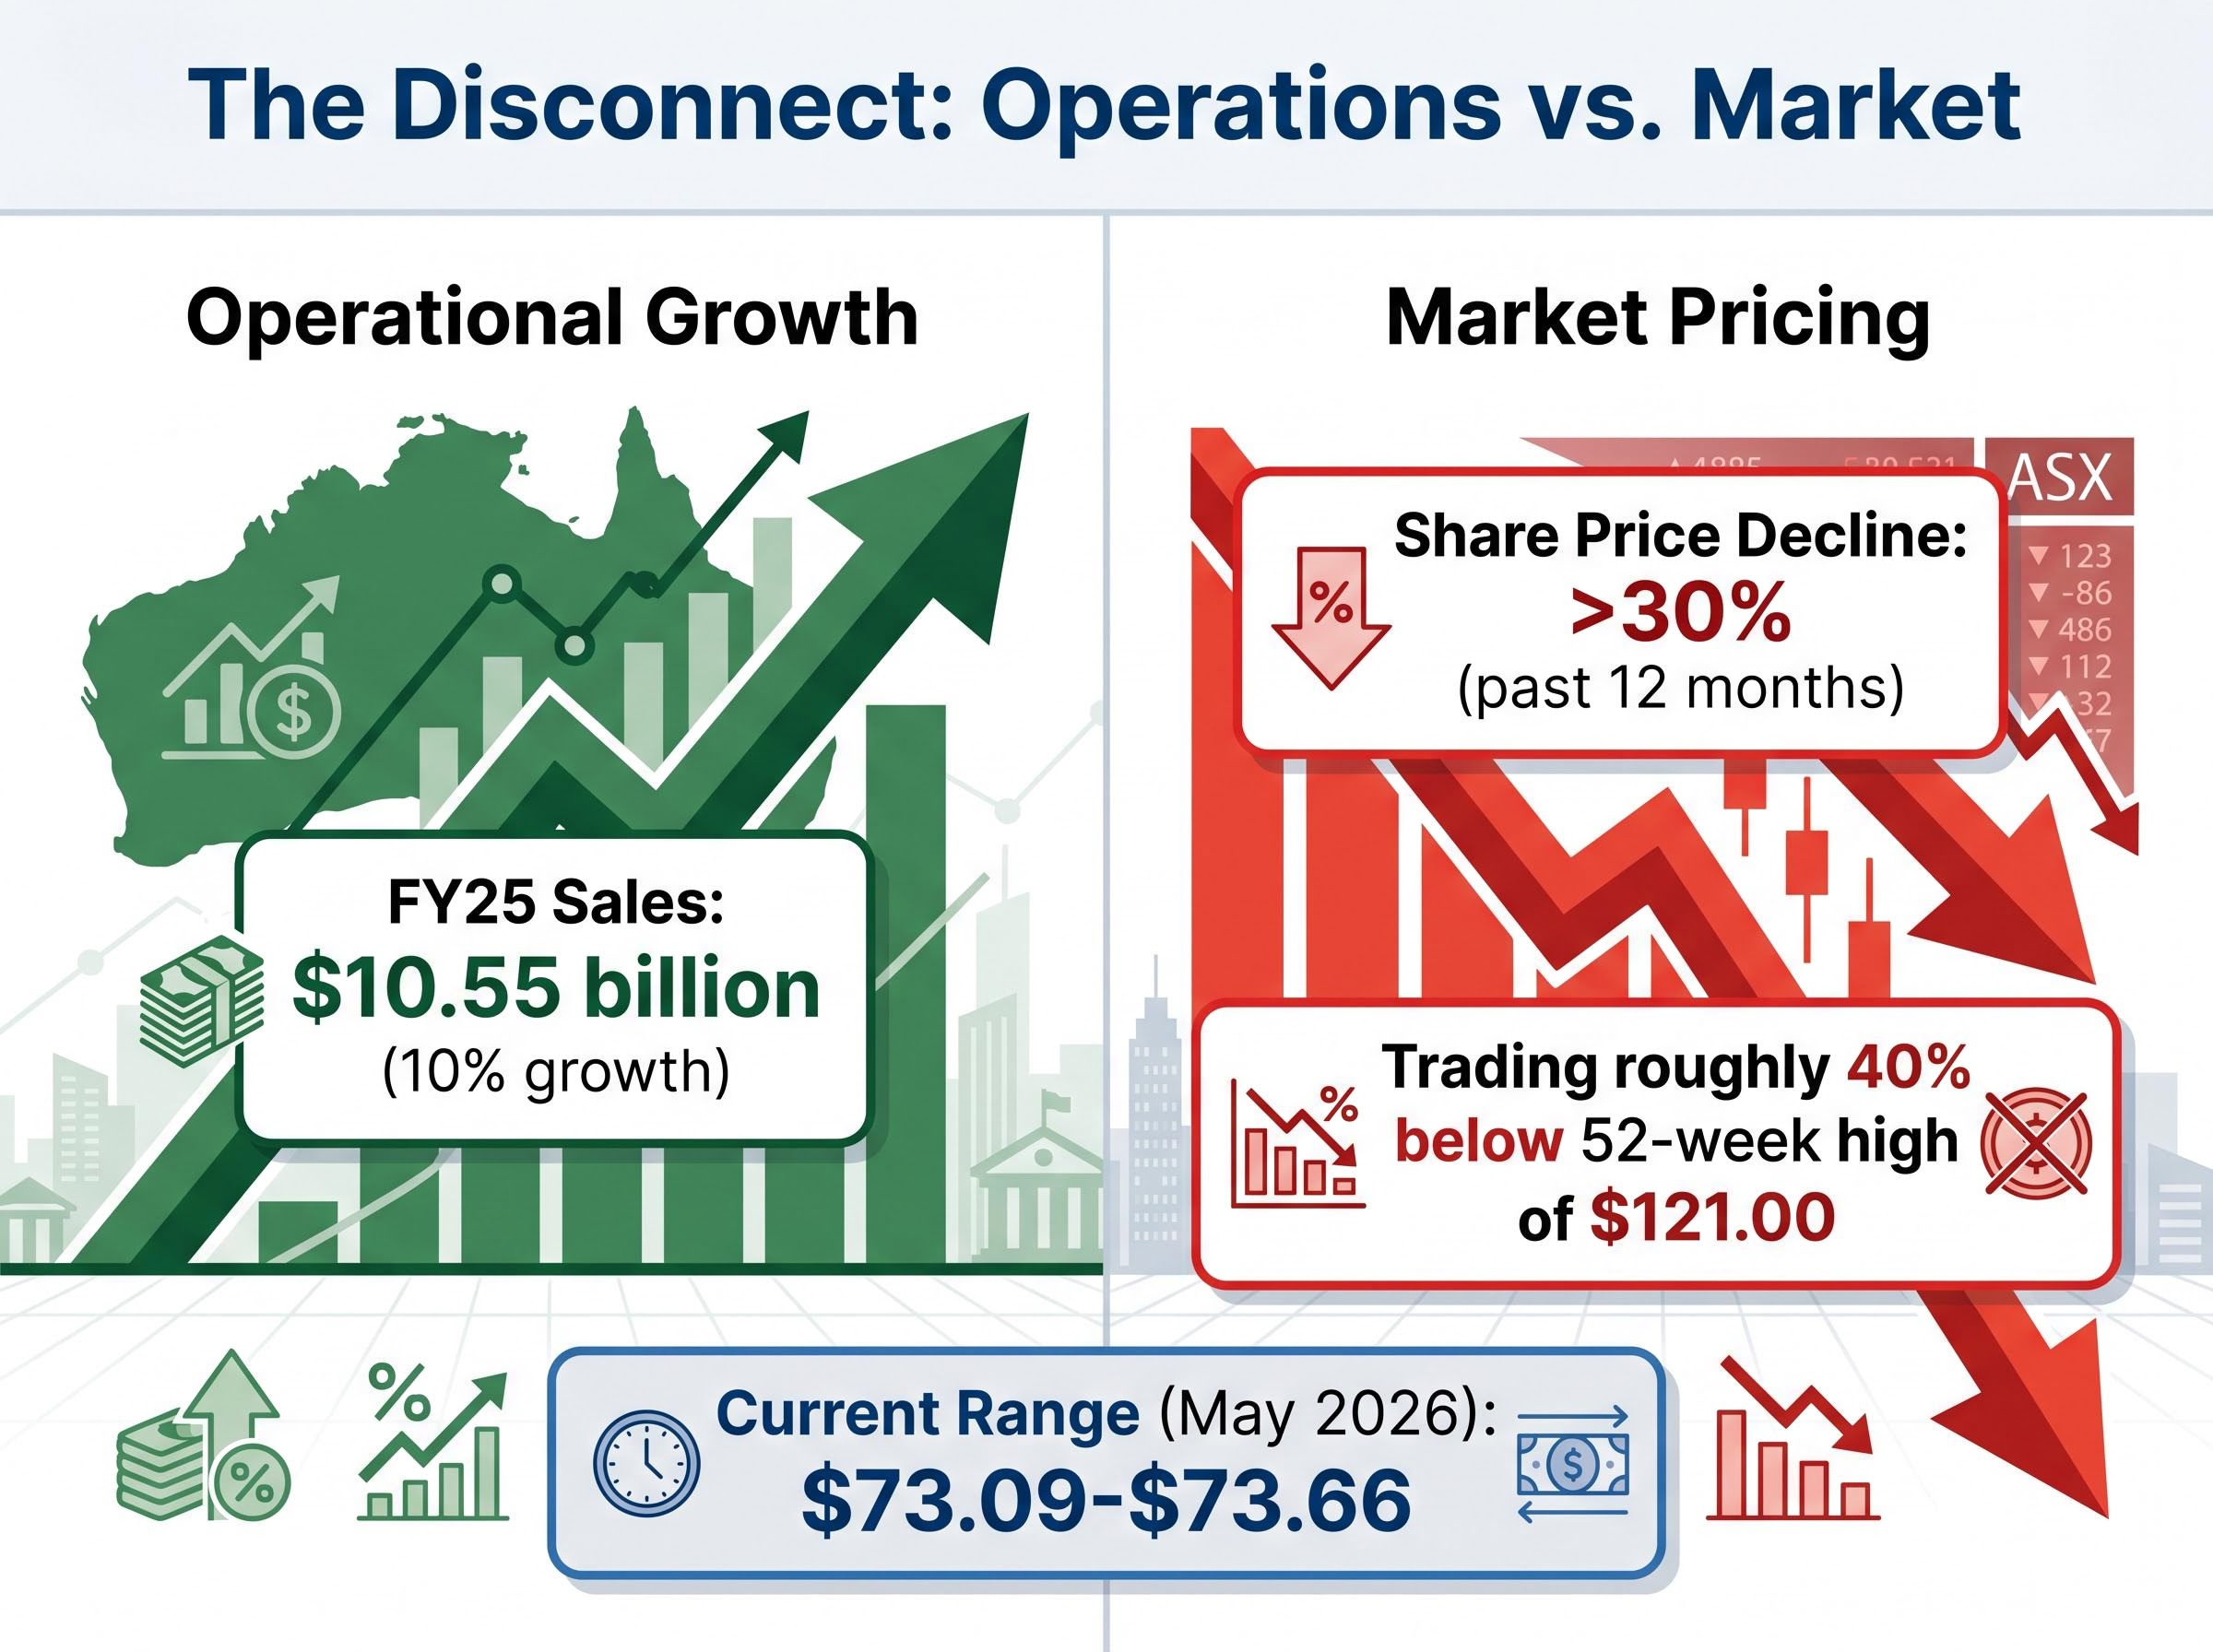
The stock is trading roughly 40% below its 52-week high of $121.00, a level reached less than a year ago.
Key price statistics:
- Current trading range: $73.09-$73.66 (late May 2026)
- 52-week high: $121.00
- 52-week low: $68.91
- Market capitalisation: approximately $7.9-$8.0 billion
- Year-to-date decline from start of 2025: 23.6%
- Total 12-month decline to late May 2026: more than 30%
The proximity to the 52-week low of $68.91 is worth noting. The stock is closer to its multi-year floor than to any recent peak. A May 2026 trading update triggered a sharp market reaction, underscoring ongoing investor sensitivity to any signal about sales momentum. Understanding where the stock sits relative to its trading range and recent catalysts is the necessary starting point for determining whether this decline is structural or cyclical.
When big ASX news breaks, our subscribers know first
How JB Hi-Fi actually makes its money across three divisions
JB Hi-Fi operates through three divisions, each serving a distinct product category and customer base. Founded in 1974, the company built its original business in consumer electronics before expanding into home appliances through the 2016 acquisition of The Good Guys.
| Division | Core Product Focus | Geographic Market | Key Competitive Role |
|---|---|---|---|
| JB Hi-Fi Australia | Consumer electronics, gaming, audio, computing | Australia | Price leader in electronics retail |
| JB Hi-Fi New Zealand | Consumer electronics, computing | New Zealand | Regional expansion of the core model |
| The Good Guys | Home appliances, whitegoods, cooking | Australia | Appliance-focused complement to the JB Hi-Fi brand |
The competitive model across all three divisions is built on price leadership. Frequent, visible discounting shapes customer perception and drives foot traffic, but it also produces structurally thin margins. That pricing strategy is the company’s primary weapon against Amazon Australia’s online platform and Harvey Norman’s promotional store network.
During HY25, the company acquired a 75% stake in e&s Trading Co., a move that signals a continued strategy to deepen its appliance retail footprint. Combined group sales reached $10.55 billion in FY25. The business model reveals both where growth is coming from and where structural vulnerabilities sit, context that matters when interpreting the financial signals that follow.
Reading the financials: why strong sales and shrinking profits can coexist
The apparent contradiction sits at the centre of the JB Hi-Fi investment debate. Revenue has grown while profit has contracted, and both statements are true simultaneously.
The trajectory from 2021 to FY24 tells the story in sequence:
- 2021 marked the profit peak, with net profit after tax (NPAT) reaching $506 million, boosted by pandemic-era demand for electronics and home appliances.
- Revenue averaged 2.5% annual growth through this period, reaching $9,592 million in FY24, as the top line continued expanding even as extraordinary demand normalised.
- NPAT contracted to $439 million by FY24, a decline of more than 13% from the 2021 peak, as cost pressures, promotional activity, and fixed-cost structures compressed margins despite rising sales.
FY25 then delivered a partial recovery. Total group sales reached $10.55 billion, up 10.0%, while NPAT came in at $462.4 million, up 5.4% on an underlying basis. A final dividend of $1.05 was declared.
Total group sales of $10.55 billion in FY25, up 10.0%, sit in direct tension with a share price that has fallen more than 30% over the same period.
The half-year result (HY25, six months to December 2024) reinforced the positive operational trajectory: sales of $5.67 billion (up 9.8%), EBIT of $419.9 million (up 8.6%), NPAT of $285.4 million (up 8.0%), and an interim dividend of 170.0 cents.
In a low-margin retail model, this pattern is not unusual. Revenue can grow through volume increases and store expansion while net profit compresses because incremental sales come at thinner margins, promotional spending increases to maintain market share, and fixed costs absorb a larger share of earnings during softer demand periods. The interplay between these metrics, rather than either figure in isolation, is what reveals the business’s actual trajectory.
What return on equity reveals about a business that appears to be struggling
Return on equity (ROE) offers a different lens on the same business. Where the revenue and profit figures describe the income statement, ROE captures how efficiently the company converts its shareholders’ capital into earnings. For JB Hi-Fi, that figure is 29.5%.
ROE in plain terms: what it is and why it matters for retail investors
ROE is calculated by dividing net profit by shareholders’ equity, expressed as a percentage. A company with $100 million in equity that earns $29.5 million in profit has a 29.5% ROE.
For retailers, this metric is particularly informative. Retail businesses typically operate on thin margins, meaning the profit earned on each dollar of sales is small. What distinguishes efficient retailers is not wide margins but high asset turnover: the ability to cycle inventory quickly and generate large sales volumes relative to the equity invested. ROE captures that efficiency in a single figure.
JBH’s 29.5% ROE in context
A 29.5% ROE is materially above average for Australian discretionary retail. It signals that despite the profit contraction from $506 million in 2021 to $439 million in FY24 (before recovering to $462.4 million in FY25), the business continues to generate strong returns on the capital shareholders have invested.
What ROE shows versus what it does not:
- It shows the business is converting equity into profit at a rate that indicates operational efficiency, not capital misallocation
- It does not guarantee future earnings growth or insulate the company from further margin compression
- It suggests the profit decline reflects a cyclical earnings headwind rather than a structural breakdown in the business model
- It does not tell investors whether the share price will recover, only that the underlying business remains capital-efficient
DuPont decomposition breaks ROE into its three component drivers — net profit margin, asset turnover, and financial leverage multiplier — allowing investors to identify whether a high ROE reflects genuine operational efficiency or a compressed equity base inflated by debt, a distinction that becomes especially important when comparing retailers operating on structurally thin margins.
The two signals, contracting profit and high ROE, are not contradictory. They describe different dimensions of performance. The profit trajectory captures the income statement pressure. The ROE figure captures how effectively the business operates with the capital it has. Both can be true simultaneously.
The macro forces behind the sell-off and what they mean for a recovery
Much of what appears to be a JB Hi-Fi problem is, on closer examination, an Australian consumer problem.
Persistent cost-of-living pressures, elevated interest rates, and weak consumer sentiment have directly suppressed demand for big-ticket discretionary items: televisions, computers, and home appliances. These are precisely the product categories that account for the bulk of revenue across all three JB Hi-Fi divisions.
The headline GDP figure obscures a more uncomfortable reality: Australia has been in a per capita recession even as aggregate output grows, with GDP per capita expanding just 0.4% in Q4 2025 while population growth flatters the top-line number, a distinction that matters directly for any retailer dependent on household spending capacity.
The RBA monetary policy guidance published in May 2026 explicitly links elevated cash rates to lower household spending, providing the direct policy mechanism through which interest rate settings translate into reduced demand for big-ticket discretionary purchases such as televisions, computers, and home appliances.
The sector-wide data confirms the pattern. The S&P/ASX 200 consumer discretionary sector is down approximately 14% year-to-date in 2026. JB Hi-Fi’s decline of more than 30% over 12 months materially exceeds that benchmark, implying a combination of sector headwinds and stock-specific sentiment compression.
The ASX consumer discretionary sector returned just 0.95% annualised over the five years to mid-2026, a period that includes the pandemic-era demand spike that briefly flattered earnings across the entire cohort, meaning the recent de-rating of electronics and appliance retailers is less a sudden reversal than an unwinding of conditions that were always temporary.
The macro headwinds acting on the business include:
- Elevated interest rates reducing household disposable income available for discretionary spending
- Cost-of-living pressures across rents, energy, and groceries competing for wallet share
- Weak consumer sentiment persisting through 2024-2025
- Intensifying competitive pressure from Amazon Australia (online pricing) and Harvey Norman (promotional store network)
No profit warnings, governance issues, or leadership changes were disclosed by JB Hi-Fi during the period from January 2025 to May 2026, the entire window in which the share price declined by more than 30%.
That absence of company-specific negative disclosures is analytically significant. It separates the macro headwinds from any internal deterioration, and it reframes the recovery thesis. If the decline is primarily macro-driven, then the recovery depends on macro improvement: rate cuts, improving consumer sentiment, and stabilising household budgets. Company-specific action alone may not be sufficient to drive a re-rating if the external environment remains hostile.
What the valuation signals say about the stock at $73
The valuation picture contains both a clear consensus direction and genuine uncertainty about the magnitude.
Consensus analyst targets sit in the range of approximately $82.52-$83.68, implying upside of roughly 12-15% from the prevailing price of approximately $73. The GuruFocus GF Value model assessed fair value at A$80.76 as of April 2026, describing the stock as “fairly valued.” A broker view cited in Motley Fool Australia in May 2026 described the stock as attractive at 17 times estimated FY26 earnings.
| Source | Valuation Estimate | Implied Move vs ~$73 | Basis |
|---|---|---|---|
| Consensus analyst target | $82.52-$83.68 | ~12-15% upside | 12-month price target (aggregated) |
| GuruFocus GF Value | A$80.76 | ~10% upside | Intrinsic value model (April 2026) |
| Broker (Motley Fool citation) | Attractive at 17x FY26 earnings | Implied upside not specified | Forward P/E multiple (May 2026) |
| Analyst low estimate | $57.00 | ~22% downside | Individual broker target |
| Analyst high estimate | $118.40 | ~62% upside | Individual broker target |
The individual analyst range spans from $57.00 to $118.40, a spread that reflects meaningful disagreement about the forward earnings path and the degree to which macro headwinds will persist.
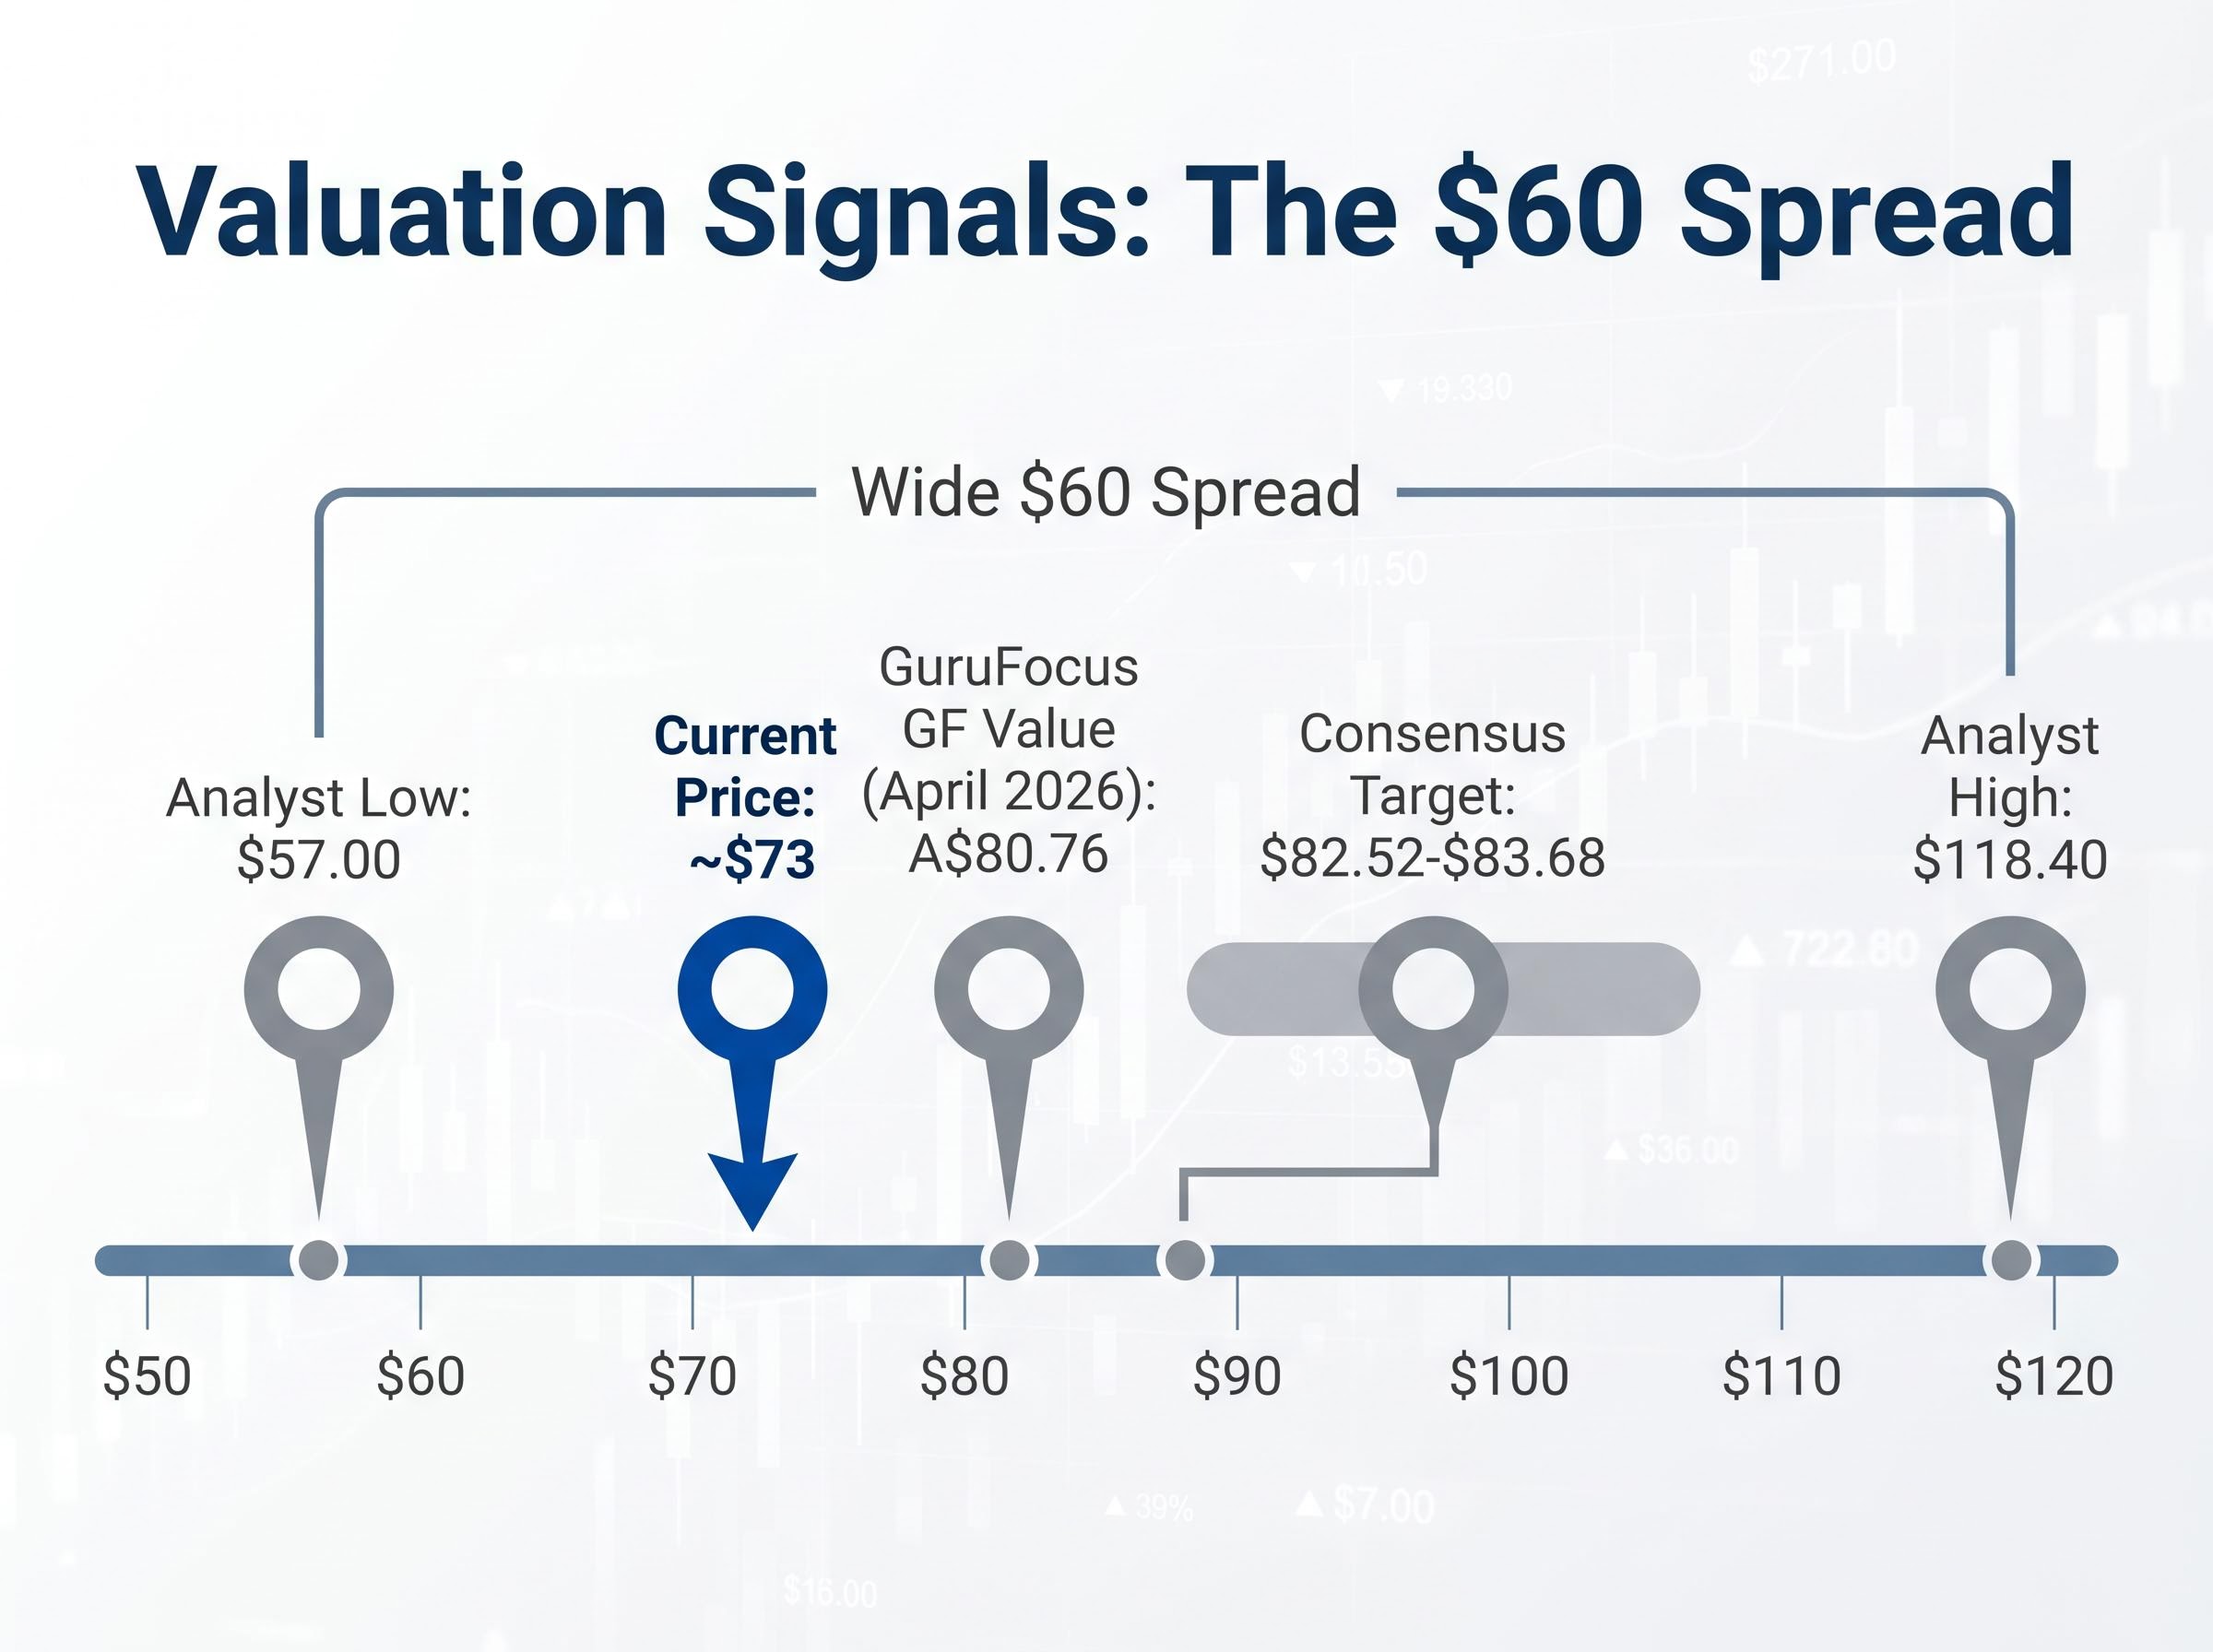
That spread is itself a data point. A range of more than $60 between the most bearish and most bullish estimates signals that the market has not converged on a single forward view. If consumer sentiment remains depressed or interest rates stay elevated, forward earnings estimates may be revised downward, and the current multiples could appear less attractive than they do today. The valuation signals lean positive on balance, but they carry a conditional asterisk that investors should weigh carefully.
For investors wanting to stress-test the consensus target range against their own assumptions, our full explainer on share valuation methods walks through DCF, EV/EBITDA, price-to-sales, and the Dividend Discount Model with sector-specific benchmarks, covering how each method produces a different intrinsic value estimate and why the spread between them often tells investors more than any single figure.
Oversold signal or value trap: what the evidence actually supports
The case for overreaction rests on three signals:
- FY25 delivered $10.55 billion in sales (up 10.0%) and NPAT of $462.4 million (up 5.4% underlying), a positive operational result
- No profit warnings, governance issues, or leadership disruption were disclosed during the entire decline period from January 2025 to May 2026
- Consensus analyst targets of $82-$84 sit materially above the current price, with multiple valuation frameworks pointing to fair value above $80
The bear case is not without substance:
- Net profit remains below its 2021 peak ($462.4 million versus $506 million), and the recovery trajectory is gradual rather than decisive
- The competitive environment has structurally intensified with Amazon Australia and Harvey Norman applying persistent margin pressure
The evidence available supports a reading that the sell-off is primarily macro- and sentiment-driven rather than caused by company-specific deterioration. Whether it constitutes a genuine market overreaction, however, depends on forward earnings delivery.
Three indicators will determine which reading proves correct:
- RBA rate decisions: any cut would directly ease pressure on discretionary spending
- Australian consumer sentiment trajectory: sustained improvement would signal a demand recovery for big-ticket electronics and appliances
- FY26 sales updates: the cadence of JB Hi-Fi’s trading updates will provide the most direct evidence of whether revenue momentum is holding or fading
The gap between a $10.55 billion business and a $73 share price contains either a buying opportunity or a warning. The macro environment, not the company’s management, holds the answer.
This article is for informational purposes only and should not be considered financial advice. Investors should conduct their own research and consult with financial professionals before making investment decisions.
Past performance does not guarantee future results. Financial projections are subject to market conditions and various risk factors.