South Korea and Taiwan have posted year-to-date equity gains of approximately 87.2% and 52.4% respectively by late May 2026, according to Yardeni Research. Those figures, if confirmed, would place both markets in territory that dwarfs every comparable benchmark this year. The explanation sits in a single industry: semiconductors. Both countries house the manufacturers at the centre of the global artificial intelligence hardware buildout, and as hyperscaler capital expenditure on AI infrastructure has accelerated, the earnings leverage flowing into these two indices has been extraordinary. This analysis traces the chain from AI spending to semiconductor revenue to index performance, explains why these indices behave more like sector funds than diversified country exposures, situates the rally within a broader international equity rotation, and maps the specific risks that could disrupt it.
The numbers that are redefining what an equity rally looks like
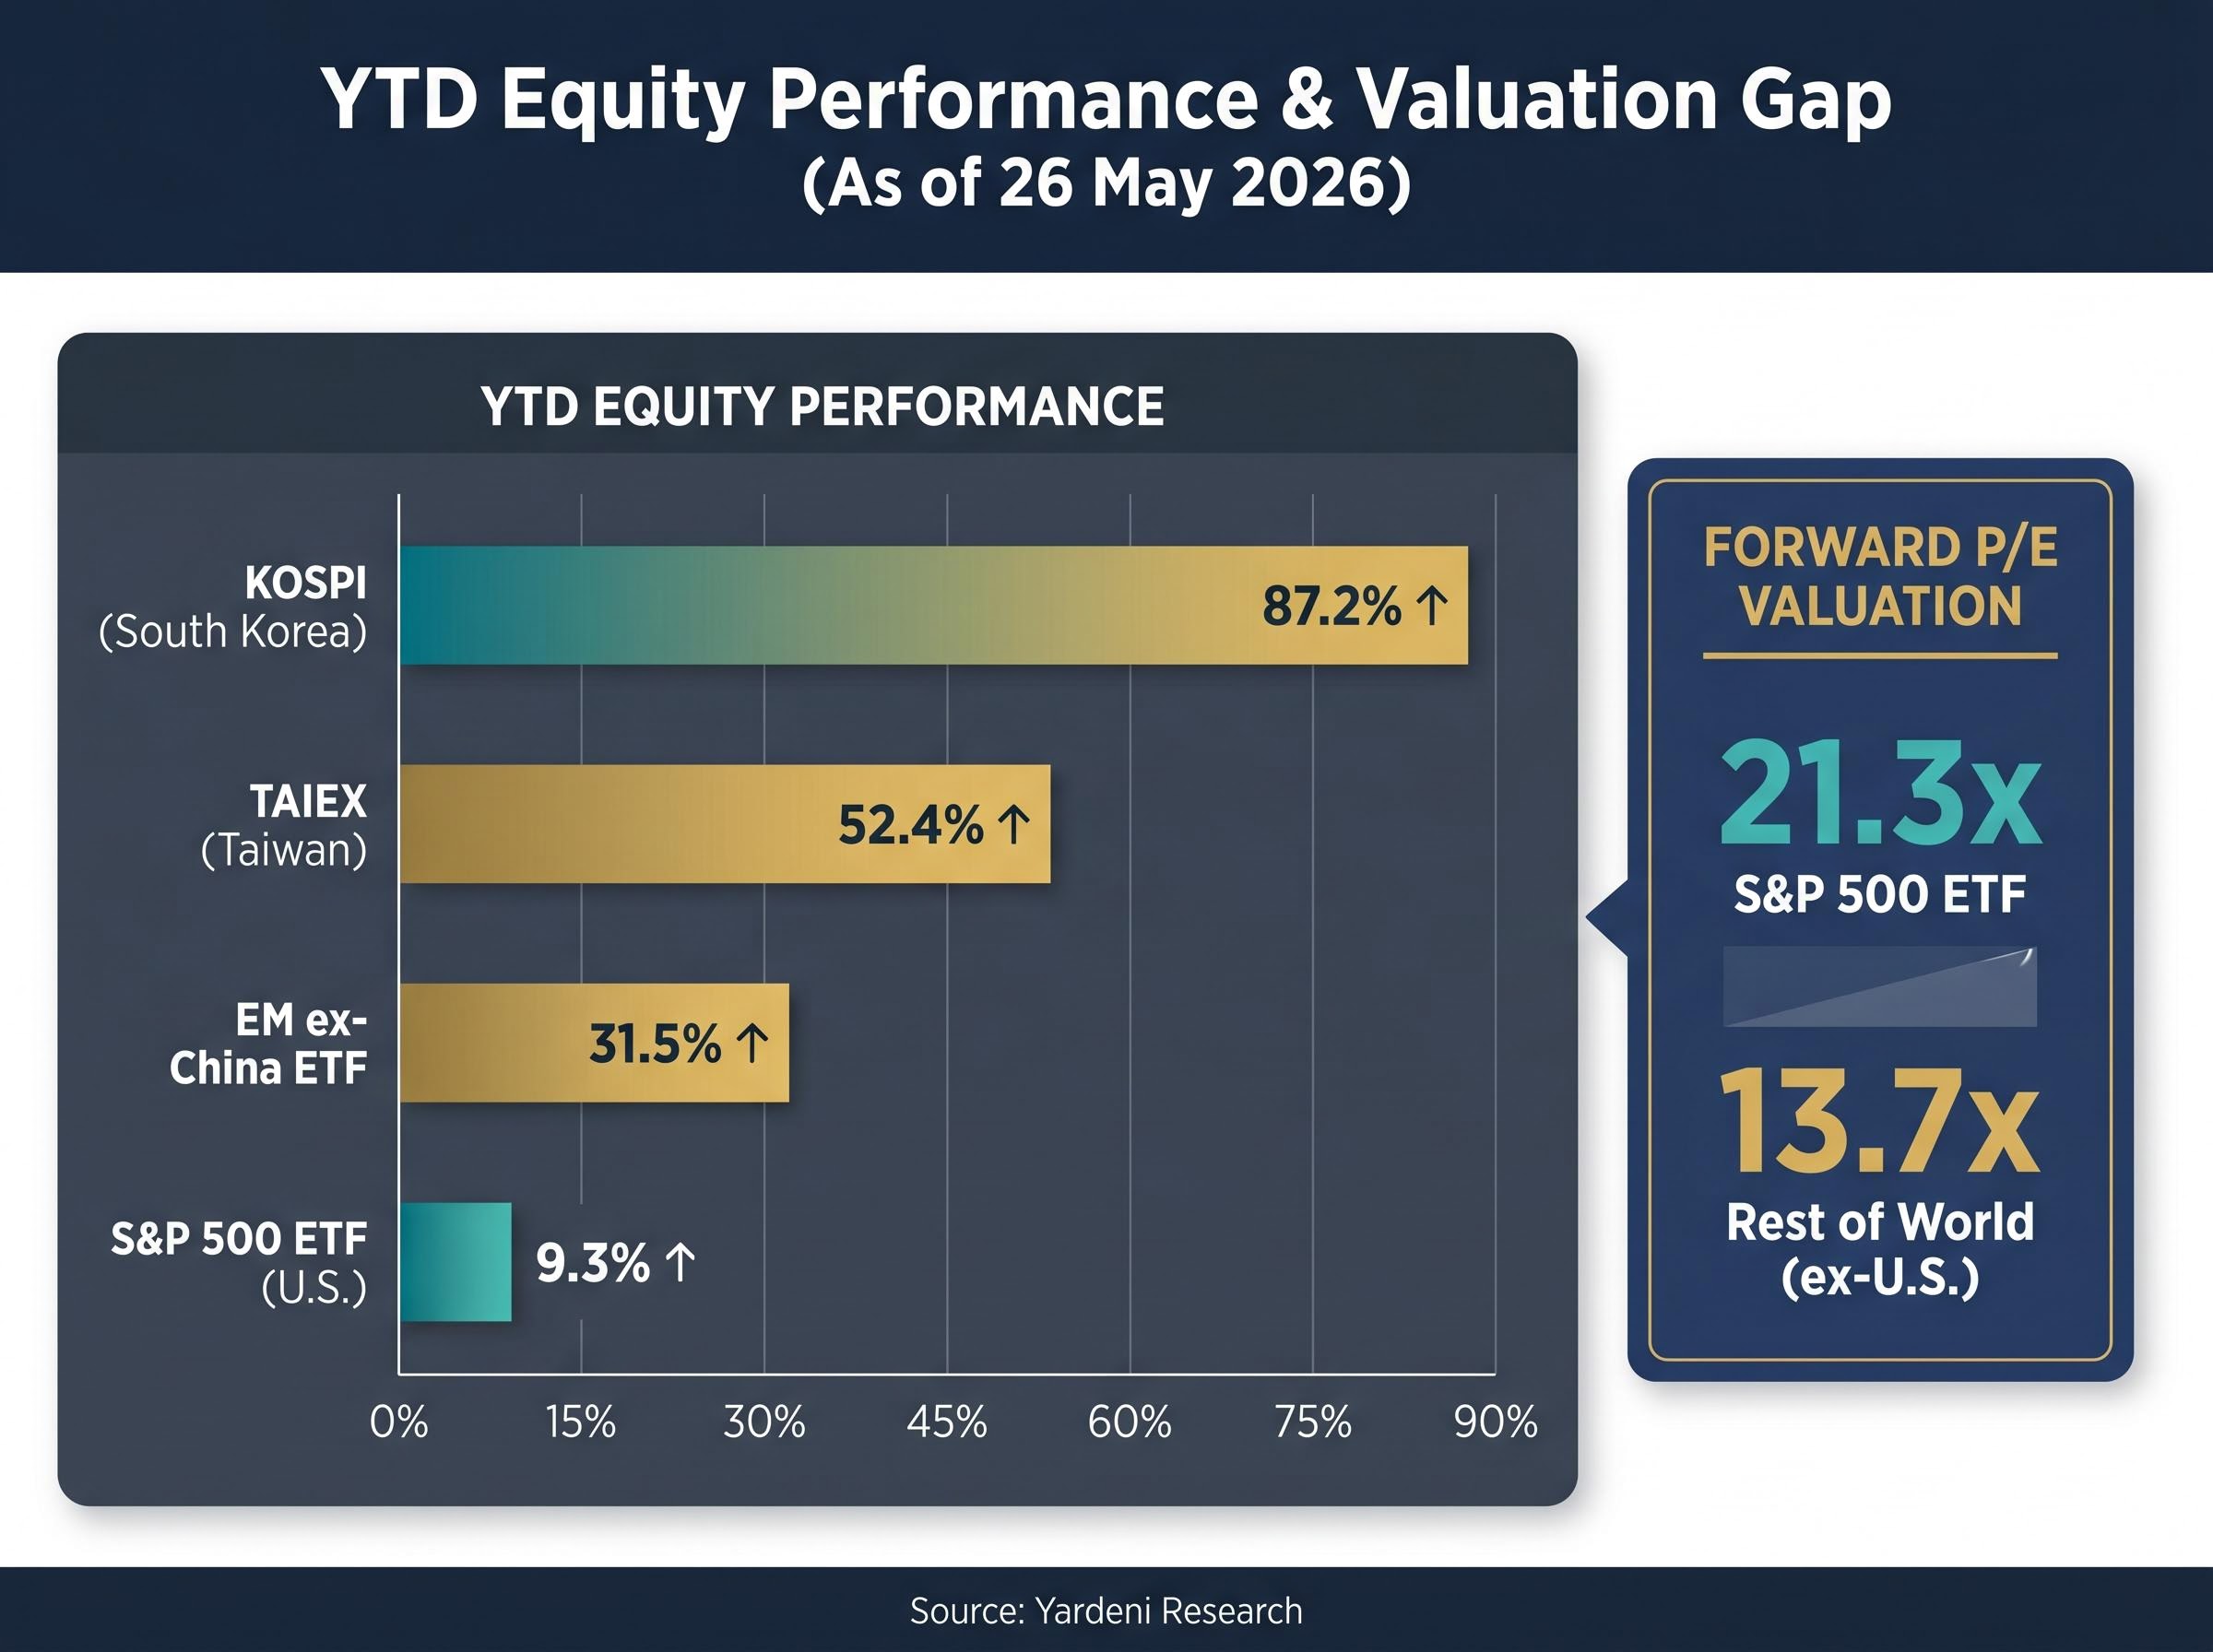
The scale requires context to register properly. South Korea’s KOSPI has gained approximately 87.2% year to date as of 26 May 2026, while Taiwan’s TAIEX has returned approximately 52.4% over the same period, according to Yardeni Research. Neither figure has been independently verified through primary index data, a limitation that warrants explicit acknowledgement; the numbers are attributed to a single research source.
Set those returns beside the benchmarks most international investors track. The S&P 500 ETF has returned approximately 9.3% year to date. The iShares Emerging Markets ex-China ETF has gained approximately 31.5%. Even that strong emerging market performance is roughly a third of what KOSPI has delivered.
| Market / Index | YTD Performance (approx.) | Forward P/E |
|---|---|---|
| KOSPI (South Korea) | 87.2% | N/A |
| TAIEX (Taiwan) | 52.4% | N/A |
| S&P 500 ETF (U.S.) | 9.3% | 21.3x |
| EM ex-China ETF | 31.5% | N/A |
| Rest of World (ex-U.S.) | N/A | 13.7x |
The All Country World ex-U.S. (ACWX) MSCI index has already outperformed the U.S. MSCI index over the prior year and into early 2026, the first time this pattern has held since the 2000s, according to Yardeni Research.
The gap between these returns and any comparable benchmark is large enough that any investor evaluating international allocation must understand the mechanism before deciding whether the divergence is likely to persist or narrow.
When big ASX news breaks, our subscribers know first
How AI infrastructure spending is flowing directly into KOSPI and TAIEX earnings
The chain is shorter than it appears. AI model training and inference at scale require two categories of semiconductor hardware: high-bandwidth memory (HBM), a specialised type of DRAM that delivers the data throughput AI accelerator chips need, and advanced logic chips, the processors designed by firms like Nvidia and AMD that execute the computations. South Korea and Taiwan house the dominant global producers of both categories.
When hyperscalers increase capital expenditure on AI infrastructure, a concentrated share of that procurement flows to a small number of manufacturers. Those manufacturers, in turn, represent a disproportionate share of their respective national equity indices. The result is a revenue channel that runs almost directly from Silicon Valley data centre budgets to KOSPI and TAIEX index points.
Verified earnings figures for Samsung Electronics, SK Hynix, and TSMC covering the 2025-2026 period were not available in confirmed sources. The analysis therefore proceeds on structural logic and publicly attributed Yardeni Research framing rather than company-level financial data.
South Korea’s memory advantage: HBM and the DRAM supply chain
- Samsung Electronics and SK Hynix are the two dominant global producers of high-bandwidth memory, the specific DRAM variant required for AI accelerator chips
- HBM is stacked, power-efficient, and bandwidth-intensive, making it non-substitutable in current AI hardware architectures
- Both companies also supply conventional DRAM and NAND flash, but HBM carries higher margins and has been the primary demand driver in the AI cycle
Taiwan’s foundry position: where AI chips are manufactured
- TSMC is the manufacturer of the advanced logic chips designed by Nvidia, AMD, and other AI chip architects
- CoWoS (Chip on Wafer on Substrate) advanced packaging represents an additional capacity constraint that concentrates AI chip production in Taiwan; no other foundry operates this technology at comparable scale
- The combination of leading-edge node manufacturing and advanced packaging means TSMC sits at a bottleneck in the AI hardware supply chain
The structural argument is direct: as long as AI infrastructure spending accelerates, the revenue flowing into these companies, and therefore into these indices, follows.
The memory chip supercycle now unfolding differs structurally from previous DRAM upcycles in one critical respect: supply cannot respond quickly, because new manufacturing lines for HBM will not reach mass production until after 2027, meaning the standard expectation that high prices attract capacity and compress margins may not hold on its usual timeline.
Why semiconductor companies dominate these indices in the first place
A reader encountering the KOSPI or TAIEX for the first time might assume they track diversified national economies comparable to the S&P 500’s representation of the United States. They do not.
Both indices are heavily concentrated in a small number of semiconductor and technology companies. Samsung Electronics alone has historically represented a substantial share of KOSPI market capitalisation, meaning its earnings performance can move the index materially in either direction. TSMC occupies a similar position within the TAIEX. When a single-sector earnings cycle strengthens, it translates with unusual efficiency into index-level returns because there are fewer offsetting sectors to dilute the effect.
This concentration is a two-sided structural feature. The same mechanism that amplifies gains in an up-cycle amplifies losses in a down-cycle.
Index concentration risk operates through a self-reinforcing loop: as Samsung and SK Hynix rise, their share of KOSPI market capitalisation grows, forcing passive index-tracking funds to purchase more shares and amplifying price moves in both directions beyond what underlying earnings alone would justify.
The practical difference between a concentrated semiconductor-weighted index and a diversified broad-market index is worth specifying:
- A semiconductor-weighted index moves primarily on chip demand cycles; a diversified index absorbs sector rotations across healthcare, financials, consumer, and energy
- Earnings surprises in one or two companies can shift a concentrated index by several percentage points; the same surprise in a diversified index is absorbed across hundreds of constituents
- Correlation with AI capital expenditure is high in a concentrated semiconductor index and diffuse in a broad-market index
- Drawdown risk during a sector downturn is amplified in a concentrated index and moderated in a diversified one
Understanding this dynamic explains why these markets behave more like sector funds than diversified country exposures, which should directly inform how investors size and classify any position they consider.
The broader rotation: international equity outperformance and the valuation gap driving it
The South Korea and Taiwan story is not occurring in isolation. It is one expression of a broader structural shift in global equity flows that has been building across multiple catalysts.
Yardeni Research’s “Go Global” stance, initially issued in December (the specific year was not confirmed in available sources), provides the strategic frame. The recommendation was maintained as of 26 May 2026, and it rests on two macro pillars: the valuation discount of international equities and the potential for geopolitical developments that would disproportionately benefit economies outside the United States.
The valuation gap is stark. U.S. equities trade at a forward price-to-earnings ratio of approximately 21.3x, according to Yardeni Research. The rest of the world trades at approximately 13.7x. That discount has persisted for years, but the performance divergence in 2026 suggests capital is beginning to respond to it.
Yardeni Research has framed the ACWX outperformance of the U.S. MSCI index as the first such sustained pattern since the 2000s, a signal that the era of automatic U.S. equity leadership may be entering a structural pause.
A potential U.S.-Iran peace deal that could lower oil prices would disproportionately benefit energy-importing economies, a category that includes both South Korea and Taiwan. However, both countries are benefiting primarily through the AI semiconductor channel rather than through energy cost relief. The two forces, valuation rotation and AI hardware demand, reinforce rather than duplicate each other.
The implication is that even if AI capital expenditure were to moderate, international equities broadly may have structural reasons to continue outperforming U.S. markets on a relative basis.
Investors wanting to situate the Korea-Taiwan rally within a longer-term reallocation thesis will find our full explainer on the market leadership rotation away from U.S. tech, which examines the multi-decade valuation spread between U.S. Technology and international developed markets, historical precedents from the Nifty Fifty and TMT bubble, and the institutional fund flow evidence suggesting this rotation is not yet crowded.
What could break the rally: concentration, geopolitics, and the AI capex cycle
The same structural features that produced these gains also define the vulnerabilities. Each risk category operates through a specific transmission mechanism to equity returns:
- Taiwan Strait geopolitics: TSMC’s physical concentration in Taiwan means any military escalation scenario would carry direct supply chain and equity implications. This is the most acute tail risk for TAIEX specifically, with consequences that would extend well beyond financial markets.
- AI capital expenditure cyclicality: Hyperscaler infrastructure spending is cyclical, not permanently accelerating. Any deceleration in AI capex would translate quickly into earnings pressure for HBM and foundry suppliers, with outsized effects on concentrated indices.
- South Korea political volatility: South Korea has experienced significant domestic political volatility. Governance uncertainty can affect investor confidence independently of semiconductor fundamentals, adding a risk dimension that has no direct equivalent in the Taiwan story.
- Currency risk (KRW and TWD): International investors holding positions denominated in Korean won or Taiwanese dollars face exchange rate exposure that can erode returns even when underlying equity performance remains strong.
- U.S. semiconductor tariff policy: Any shift in U.S. trade policy targeting semiconductor imports or supply chain localisation requirements could alter the demand dynamics that currently benefit these manufacturers.
The AI capex-to-revenue lag introduces a timing risk that sits beneath the structural earnings argument: Morningstar analyst Dennis Li has identified an 18-24 month gap between hyperscaler infrastructure commitments and the revenue they generate, meaning the earnings leverage flowing into KOSPI and TAIEX today partly reflects spending that has not yet produced commercial returns at the application layer.
No post-January 2026 analyst commentary on these specific risks was available in confirmed sources. The risks described are structural and logical rather than drawn from named analyst assessments covering the current period.
Investors who understand which risks are most material to each market can make more precise sizing and hedging decisions rather than treating both markets as interchangeable expressions of the same theme.
What the 87% rally tells investors about positioning for the AI hardware cycle
The correct classification matters more than the headline return. South Korea and Taiwan equities function as high-beta expressions of AI infrastructure spending, not as diversified country exposures. This distinction has direct implications for portfolio construction: positions in these markets will correlate with AI capital expenditure cycles, not with broader emerging market or global equity patterns.
For international investors, the primary liquid vehicles are EWY (iShares MSCI South Korea ETF) and EWT (iShares MSCI Taiwan ETF). No confirmed 2025-2026 inflow data was available for either fund, but both remain the standard instruments for gaining this exposure.
The valuation discount of international equities (13.7x forward P/E vs. 21.3x for U.S. markets) provides a relative value anchor that sits beneath the semiconductor-specific thesis. Combined with the concentration of AI hardware production in these two economies, the result is a differentiated risk and return profile that warrants an explicit allocation decision rather than passive inclusion within a broad emerging market basket.
A three-step analytical framework for evaluating exposure:
- Assess the AI capex outlook: Is hyperscaler infrastructure spending likely to accelerate, plateau, or decelerate over the next four to six quarters? The answer determines the primary earnings driver for both markets.
- Assess geopolitical risk tolerance: Taiwan Strait risk and South Korean political volatility operate independently of semiconductor demand. Position sizing should reflect an investor’s capacity to absorb tail-risk scenarios in either market.
- Choose the appropriate vehicle and position size: Classify the position as sector-concentrated rather than diversified country exposure, and size accordingly, with attention to currency hedging and correlation with existing technology or semiconductor holdings.
This article is for informational purposes only and should not be considered financial advice. Investors should conduct their own research and consult with financial professionals before making investment decisions.
A rotation two decades in the making, powered by silicon
Two forces are converging. The immediate catalyst is AI semiconductor demand, which has concentrated extraordinary earnings leverage in a small number of South Korean and Taiwanese manufacturers that dominate their national indices. The structural backdrop is a broader international equity rotation, the first sustained outperformance of non-U.S. markets since the 2000s, supported by a valuation discount that has persisted for years and is now attracting capital flows.
The specific performance figures cited throughout this analysis, approximately 87.2% for KOSPI and 52.4% for TAIEX, are attributed to Yardeni Research as of 26 May 2026 and could not be independently verified. Investors should treat the headline numbers as indicators requiring primary source confirmation before acting on them.
Even if the precise magnitude of the gains is adjusted on verification, the directional argument remains structurally coherent. AI hardware demand is concentrating earnings in South Korea and Taiwan. International equities are outperforming the United States for the first time in two decades. The two forces reinforce each other, and both bear close monitoring in the quarters ahead.
Past performance does not guarantee future results. Financial projections are subject to market conditions and various risk factors.