
Transurban’s revenue has grown at 12.6% per year for three years. Its net profit has fallen at 53.8% per year over the same period. Both numbers come from the same company’s financial reports.
As at May 2026, Transurban is one of the ASX’s largest infrastructure stocks, operating 22 urban motorways across Australia, Canada, and the United States. Investors monitoring the TCL share price are confronted with a financial profile that looks simultaneously impressive and alarming depending on which metric they examine first. Understanding why these two realities co-exist is the prerequisite to drawing any conclusions about the stock’s investment merit.
This analysis walks through six core financial metrics, explaining what each reveals about Transurban’s financial health, why the gap between revenue and profit is structural rather than incidental, and what the combination of high leverage and declining statutory profitability means for investors assessing the company at current levels.
The metric that makes Transurban look like a growth stock
Three-year revenue CAGR: 12.6%
That figure, combined with the most recently reported annual revenue of $4,119 million, makes Transurban look like a growth stock in an infrastructure wrapper. It is an unusual result for a toll-road operator, and the source of growth matters as much as the rate itself.
Three structural drivers underpin the revenue trajectory:
- Contractual toll escalation: CPI-linked or fixed-formula escalation clauses embedded in Transurban’s concession agreements automatically lift tolls each year, independent of traffic volumes.
- Post-COVID traffic normalisation: Volumes across Sydney, Melbourne, and Brisbane have recovered above pre-pandemic levels, with average daily trips growing at mid-to-high single-digit rates through FY24.
- Sydney network expansion: Integration and optimisation of the WestConnex network has added capacity and toll yield to the portfolio.
The most recent half-year results confirmed the trend is intact. Proportional total revenue for 1H26 reached $2,019 million, up 6.0% year-on-year, while FY24 proportional toll revenue came in at approximately $3.535 billion, up 6.7%. Growth of this quality, underpinned by contractual escalators rather than market-share gains, is rare on the ASX. It is precisely why institutional investors accept Transurban’s premium valuation multiple. The question is whether revenue growth alone is enough to carry the investment case.
When big ASX news breaks, our subscribers know first
Why a 57% gross margin tells only half the story
A gross margin of 57.0% tells investors that Transurban retains more than half of every dollar of toll revenue after covering the direct costs of operating its motorway network. Gross margin measures the proportion of revenue left after direct costs, before overhead, depreciation, and financing charges are deducted. For an infrastructure operator, 57.0% is a strong result and confirms that the underlying toll-road business is genuinely profitable at the operating level.
The 1H26 results reinforced this reading: proportional operating EBITDA (earnings before interest, tax, depreciation, and amortisation) reached $1,545 million, up 6.4% on the prior corresponding period. At the operating level, the business is performing well.
What gross margin does not capture is the weight of everything that sits between operating profit and the statutory bottom line. That gap is where Transurban’s financial complexity becomes visible.
From EBITDA to net profit: where the value disappears
The step-down from revenue to net profit illustrates the structural compression:
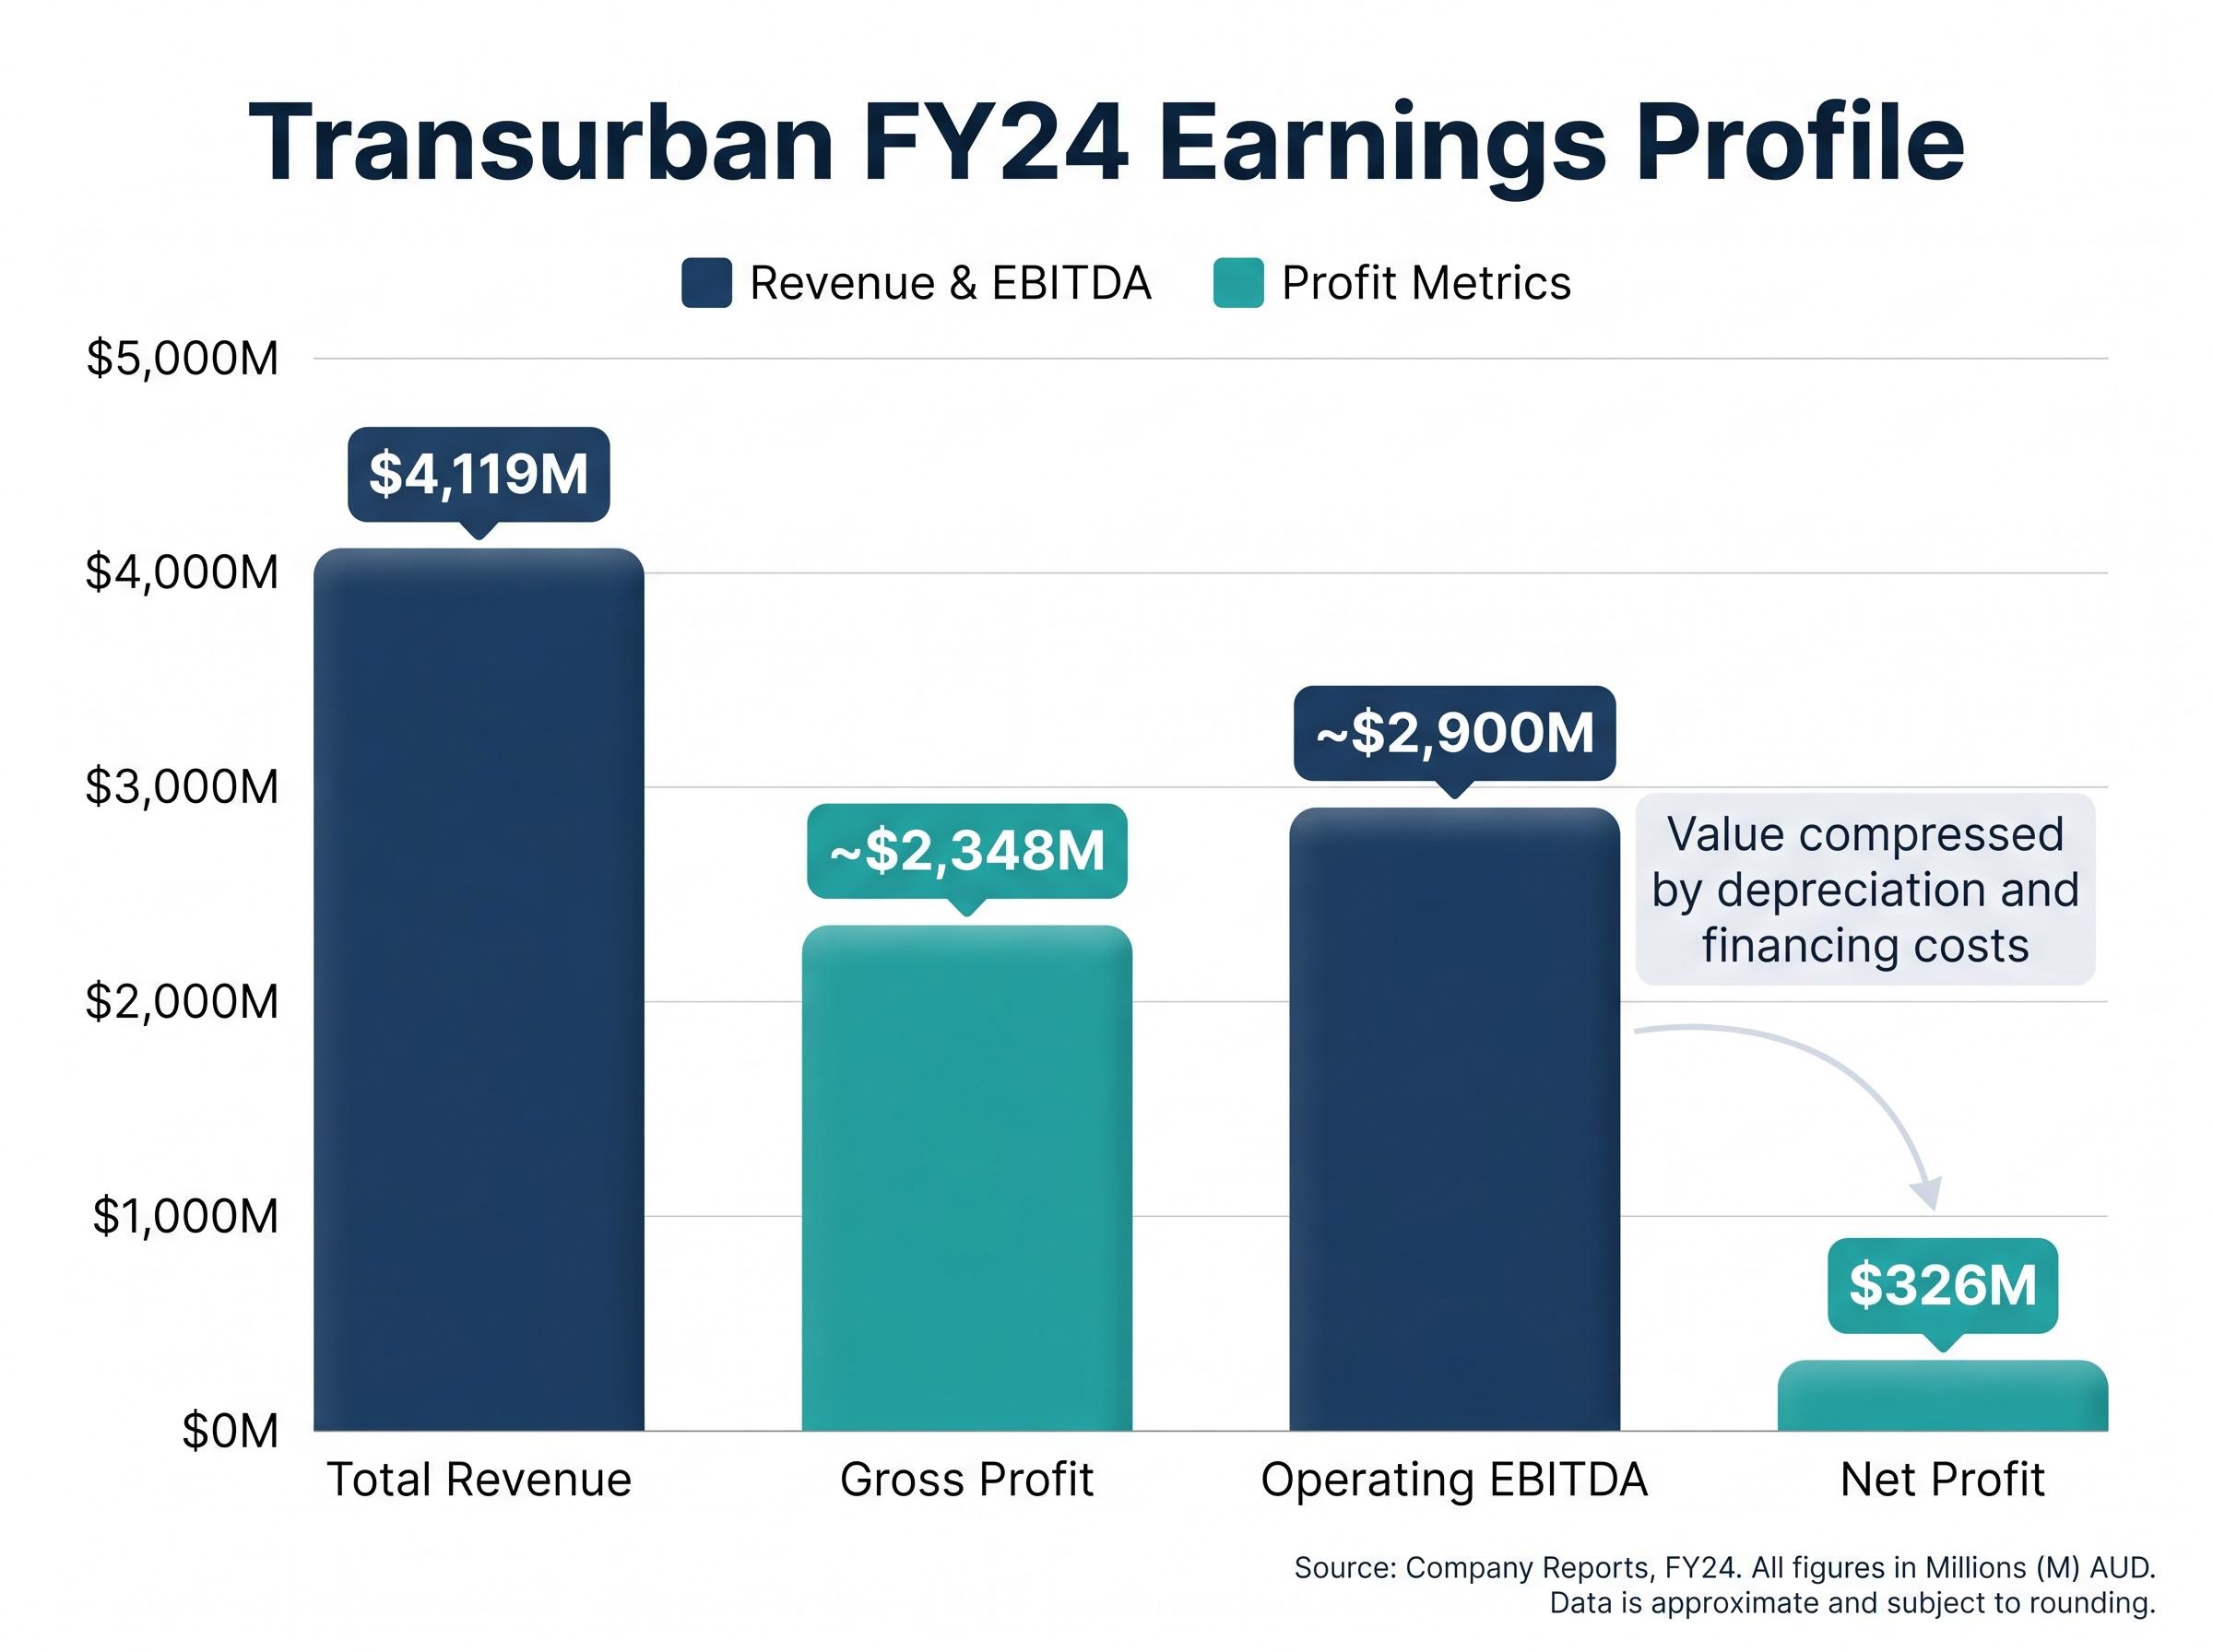
| Metric | FY24 Value | What It Captures |
|---|---|---|
| Total Revenue | $4,119M | Toll and other income |
| Gross Profit | ~$2,348M | Revenue after direct costs |
| Operating EBITDA | ~$2,900M | Before depreciation and interest |
| Net Profit | $326M | After all charges |
Depreciation on long-lived concession assets, financing costs on $26.8 billion of group debt (as at 30 June 2025), and tax effects combine to compress statutory net profit well below operating cash generation. This structural compression is why analysts and management prefer proportional EBITDA and free cash flow as performance benchmarks rather than statutory net profit.
Reading the profit collapse without misreading the business
Three-year net profit CAGR: negative 53.8%
The headline figures are stark. Net profit fell from $3,303 million three years prior to $326 million in FY24. That negative 53.8% compound annual decline demands explanation, but it does not carry the meaning it would for an industrial company reporting the same trajectory.
The primary cause lies in the composition of the prior-period result. The $3,303 million figure was materially elevated by non-recurring items, including asset revaluations and divestment gains, that do not reflect ongoing operating earnings. The FY24 figure of $326 million represents a more normalised statutory result for a business with Transurban’s capital structure.
Three categories explain the gap:
- Prior-period one-off items: Asset revaluations and transaction-related gains inflated the base year, creating a comparison that overstates the rate of decline in underlying profitability.
- Rising financing costs: As long-dated interest-rate hedges have rolled off and been refinanced at higher base rates, cash interest expense has increased progressively.
- Increased depreciation: Network expansion in Sydney has added depreciable concession assets to the balance sheet, lifting non-cash charges.
The most recent data point offers some evidence of stabilisation. Statutory profit after tax for 1H26 came in at $343 million, already exceeding the full-year FY24 result at the halfway mark.
Investors who dismiss Transurban on the basis of the headline profit CAGR alone risk misunderstanding a structurally leveraged infrastructure business. Equally, those who dismiss the profit trend entirely risk underweighting genuine financing cost pressure that will persist as hedges continue to roll.
The balance sheet: $18 billion in net debt and what it means for risk
The income statement tells one part of the story. The balance sheet tells the other.
| Metric | Value | What It Signals |
|---|---|---|
| Net Debt | ~$18,018M | Scale of leverage on the asset base |
| Debt-to-Equity | 175.1% | High gearing relative to equity |
| ROE | 3.0% | Low statutory return on equity capital |
A 175.1% debt-to-equity ratio would be alarming for an industrial company. For a toll-road operator with long-duration, inflation-linked cash flows, it is a deliberate structural choice. Morningstar Australia has described Transurban as operating with “structurally high leverage,” arguing that concession-based cash flows justify higher gearing than industrials, provided credit ratings remain investment grade.
Those ratings, BBB+/Baa1/A- from S&P, Moody’s, and Fitch respectively, remain intact. However, all three agencies have flagged that further debt-funded growth without commensurate cash-flow uplift would pressure credit metrics.
Group debt reached approximately $26.8 billion by 30 June 2025, with an average hedged cost of debt of approximately 4.5-4.6%.
The April 2026 WestConnex bond issuance, a dual-tranche A$1.21 billion senior secured placement structured across 2032 and 2036 maturities, illustrates how Transurban manages refinancing risk at the asset level, ring-fencing debt within concession vehicles rather than consolidating it on the group balance sheet.
Why interest rates matter more to TCL than to most ASX stocks
Broker commentary from Citi has described Transurban as “one of the more interest-rate-sensitive names in the ASX infrastructure and utilities universe.” UBS and MST Marquee have flagged that even modest changes in long-term bond yields materially affect equity valuation multiples.
Long-bond yield movements directly compress or expand the present value of Transurban’s long-duration cash flows. As existing interest-rate hedges roll off and are refinanced at higher current base rates, the group’s cash interest bill will progressively increase over the medium term, even with stable credit ratings.
The ROE of 3.0% captures the combined effect of all this structural complexity. It is not a verdict on operational quality but a signal of how much financial architecture sits between the toll-road assets and investor returns.
Distribution growth and the metric that actually drives TCL’s share price
For ASX infrastructure investors, distribution yield and distribution growth are the primary valuation anchors for Transurban, not statutory net profit. The business is structured to return cash flow rather than maximise reported earnings, and the distribution track record reflects the quality of underlying cash generation.
The trajectory has been consistent: 63 cents per security in FY24, 65.0 cents in FY25 (representing 4.8% growth), with FY26 guidance pointing to approximately 6.2% growth.
FY26 distribution growth guidance: approximately 6.2%
Three steps form the framework most institutional investors use to assess the TCL share price:
- Estimate sustainable free cash flow from the proportional toll-road portfolio, net of maintenance capital expenditure and cash interest.
- Assess distribution coverage and growth trajectory, testing whether free cash flow covers the current distribution with room for annual increases.
- Compare the resulting yield against long-bond rates, determining whether the spread compensates for leverage and regulatory risk.
Transurban’s valuation multiple (EV/EBITDA) compresses when long-bond yields rise and expands when they fall. This makes the relative yield spread between the distribution and the risk-free rate a central driver of the share price at any given time. Year-to-date through 26 May 2026, the TCL share price has risen 2.33%.
The synchronised bond yield repricing across four sovereign markets on 18 May 2026 hit ASX infrastructure and A-REIT sectors hardest precisely because long-duration cash flows are most sensitive to discount rate expansion, with the S&P/ASX 200 A-REIT Index falling 2.62% in a single session.
FY26 full-year results are scheduled for 13 August 2026, providing the next complete update on distribution coverage and free cash flow generation.
Six metrics, one verdict: strong asset, complex investment
The six metrics tell a coherent story when read together rather than in isolation.
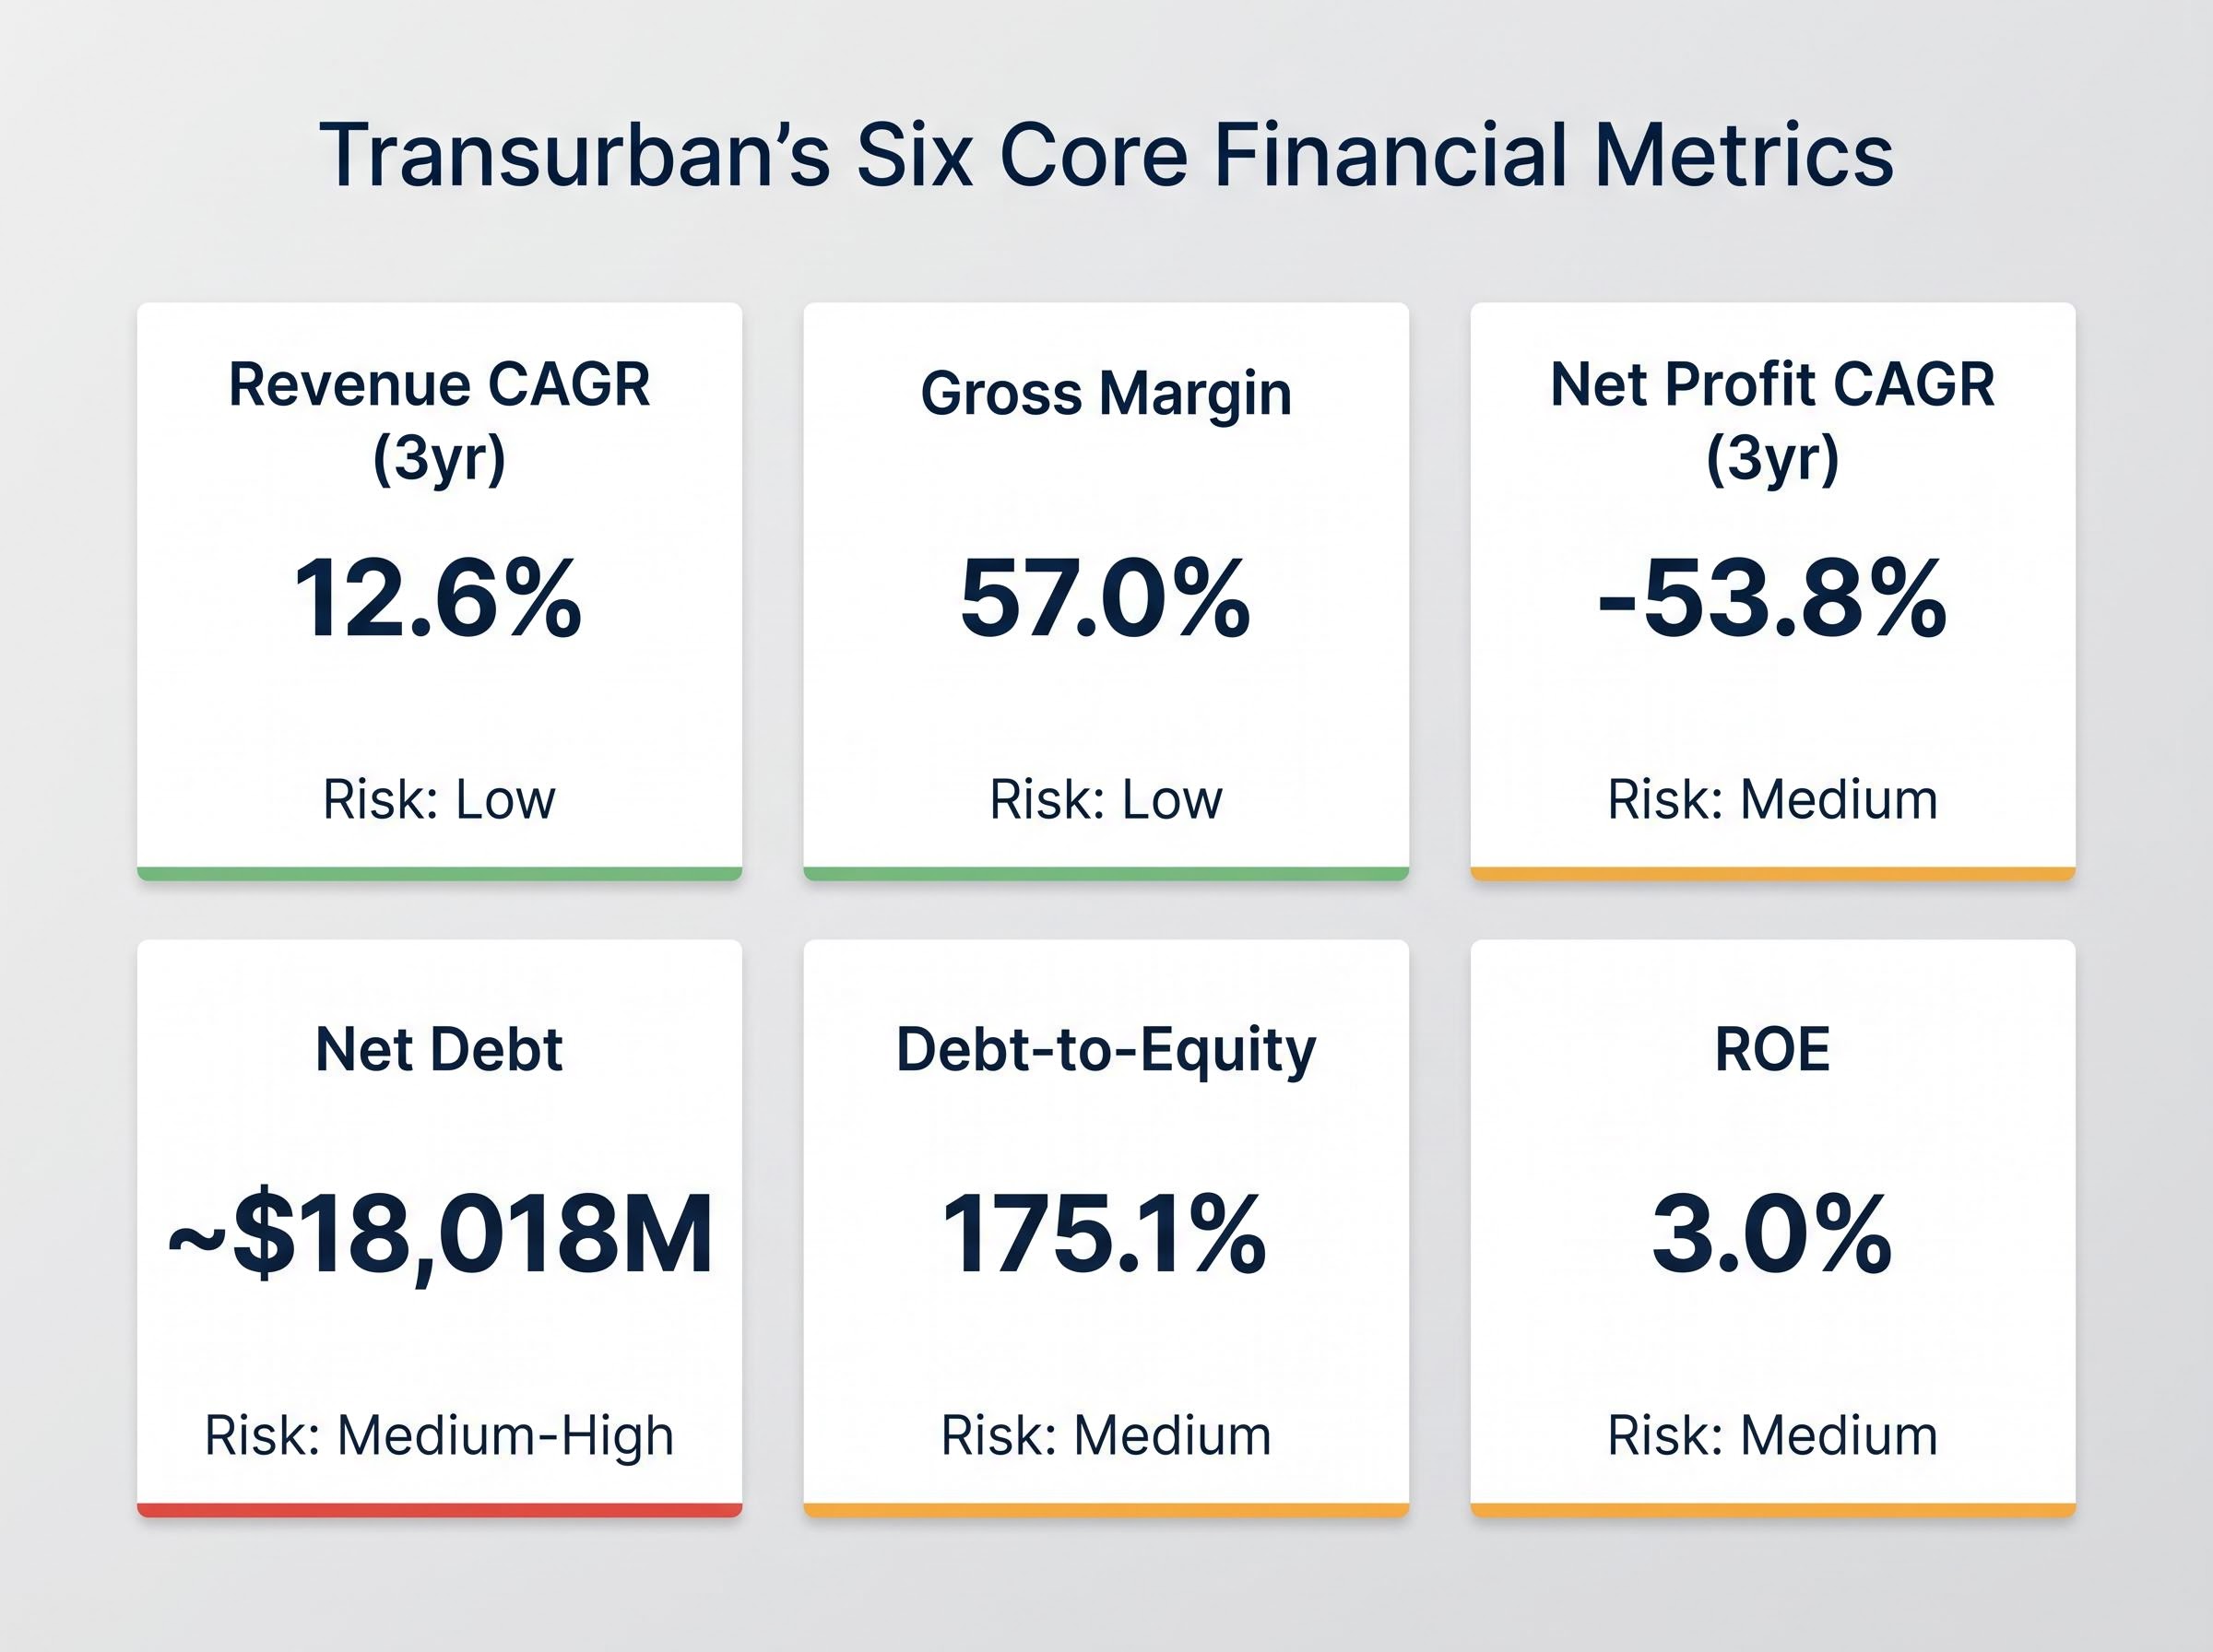
| Metric | Value | Signal | Context | Risk Level |
|---|---|---|---|---|
| Revenue CAGR (3yr) | 12.6% | Strong growth | Contractual escalators and traffic recovery | Low |
| Gross Margin | 57.0% | Healthy operations | Direct cost control; does not reflect financing | Low |
| Net Profit CAGR (3yr) | -53.8% | Statutory weakness | Prior-year one-offs inflate the decline rate | Medium |
| Net Debt | ~$18,018M | High leverage | Structural for toll-road concessions | Medium-High |
| Debt-to-Equity | 175.1% | Capital-intensive structure | Accepted by ratings agencies at current levels | Medium |
| ROE | 3.0% | Low statutory return | Reflects leverage, depreciation, and financing costs | Medium |
These six metrics are a starting framework, not a complete valuation. Investors should assess Transurban relative to ASX infrastructure peers, consider NSW toll reform policy risk (where government rebate and cap schemes are designed not to undermine existing concession agreements, representing policy risk rather than contract risk), and evaluate whether the current share price reflects a fair discount rate assumption.
Atlas Arteria’s FY25 results, which reported 9.4% proportional toll revenue growth to $2 billion at a 75% EBITDA margin while reaffirming a 40 cents per security distribution, provide a direct peer reference point for assessing whether Transurban’s revenue growth rate and distribution yield represent sector leadership or sector-average performance.
FY26 full-year results are scheduled for 13 August 2026, providing the next comprehensive reassessment point.
Before acting on these numbers, here is what the metrics do not tell you
The six metrics have done their work. They reveal the tension at the centre of Transurban’s financial profile: a high-quality infrastructure operator with strong operating metrics and a capital structure that compresses statutory returns and amplifies interest-rate sensitivity. What they cannot resolve are the three inputs that would need to be settled before any investment decision is sound:
- The appropriate discount rate for long-duration toll-road cash flows, which determines whether the current valuation multiple is fair, stretched, or cheap.
- The outcome of NSW toll reform on medium-term revenue, where political dynamics could shift the balance between policy risk and contract certainty.
- The pace at which interest-rate hedges roll off, which will determine whether the group’s cash interest bill rises gradually or accelerates over the next two to three years.
Whether the current rate environment represents a temporary disruption or long-term rate normalisation has direct consequences for the discount rate assumption embedded in any TCL valuation; US 30-year Treasury yields at approximately 5.1% in May 2026 are consistent with pre-quantitative-easing historical ranges, suggesting investors anchored to post-2008 yield levels may be systematically mispricing long-duration infrastructure assets.
The NSW Treasury’s Independent Toll Review, which delivered 42 recommendations in July 2024 including the proposed establishment of a centralised “NSW Motorways” entity, is the policy process most likely to reshape the commercial terms under which Transurban operates its Sydney network over the medium term.
The Infrastructure Australia 2025 Infrastructure Market Capacity Report adds a further forward consideration: construction cost inflation and project-delivery capacity constraints may lift capital expenditure costs for planned network expansions, affecting future project returns.
Practical next steps for investors monitoring TCL
Comparing Transurban’s distribution yield against APA Group and other ASX infrastructure peers provides a relative value reference point. Reviewing the concession maturity schedule and hedging profile in the FY25 annual report offers primary-source visibility on the two structural risks that matter most.
13 August 2026 is the next scheduled results date, delivering the complete FY26 financial picture. Investors who understand what the six metrics reveal, and what they leave unresolved, are better positioned to ask the right questions when that data arrives.
This article is for informational purposes only and should not be considered financial advice. Investors should conduct their own research and consult with financial professionals before making investment decisions. Past performance does not guarantee future results. Financial projections are subject to market conditions and various risk factors.