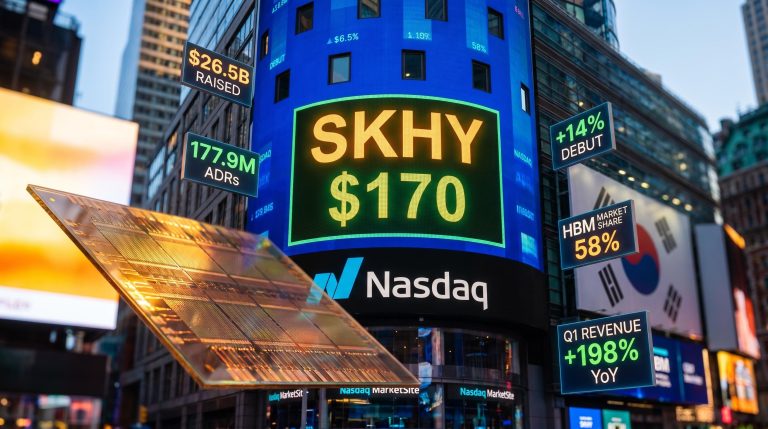
SK Hynix’s $26.5B Nasdaq Listing Shatters ADR Demand Records
9 hrs ago
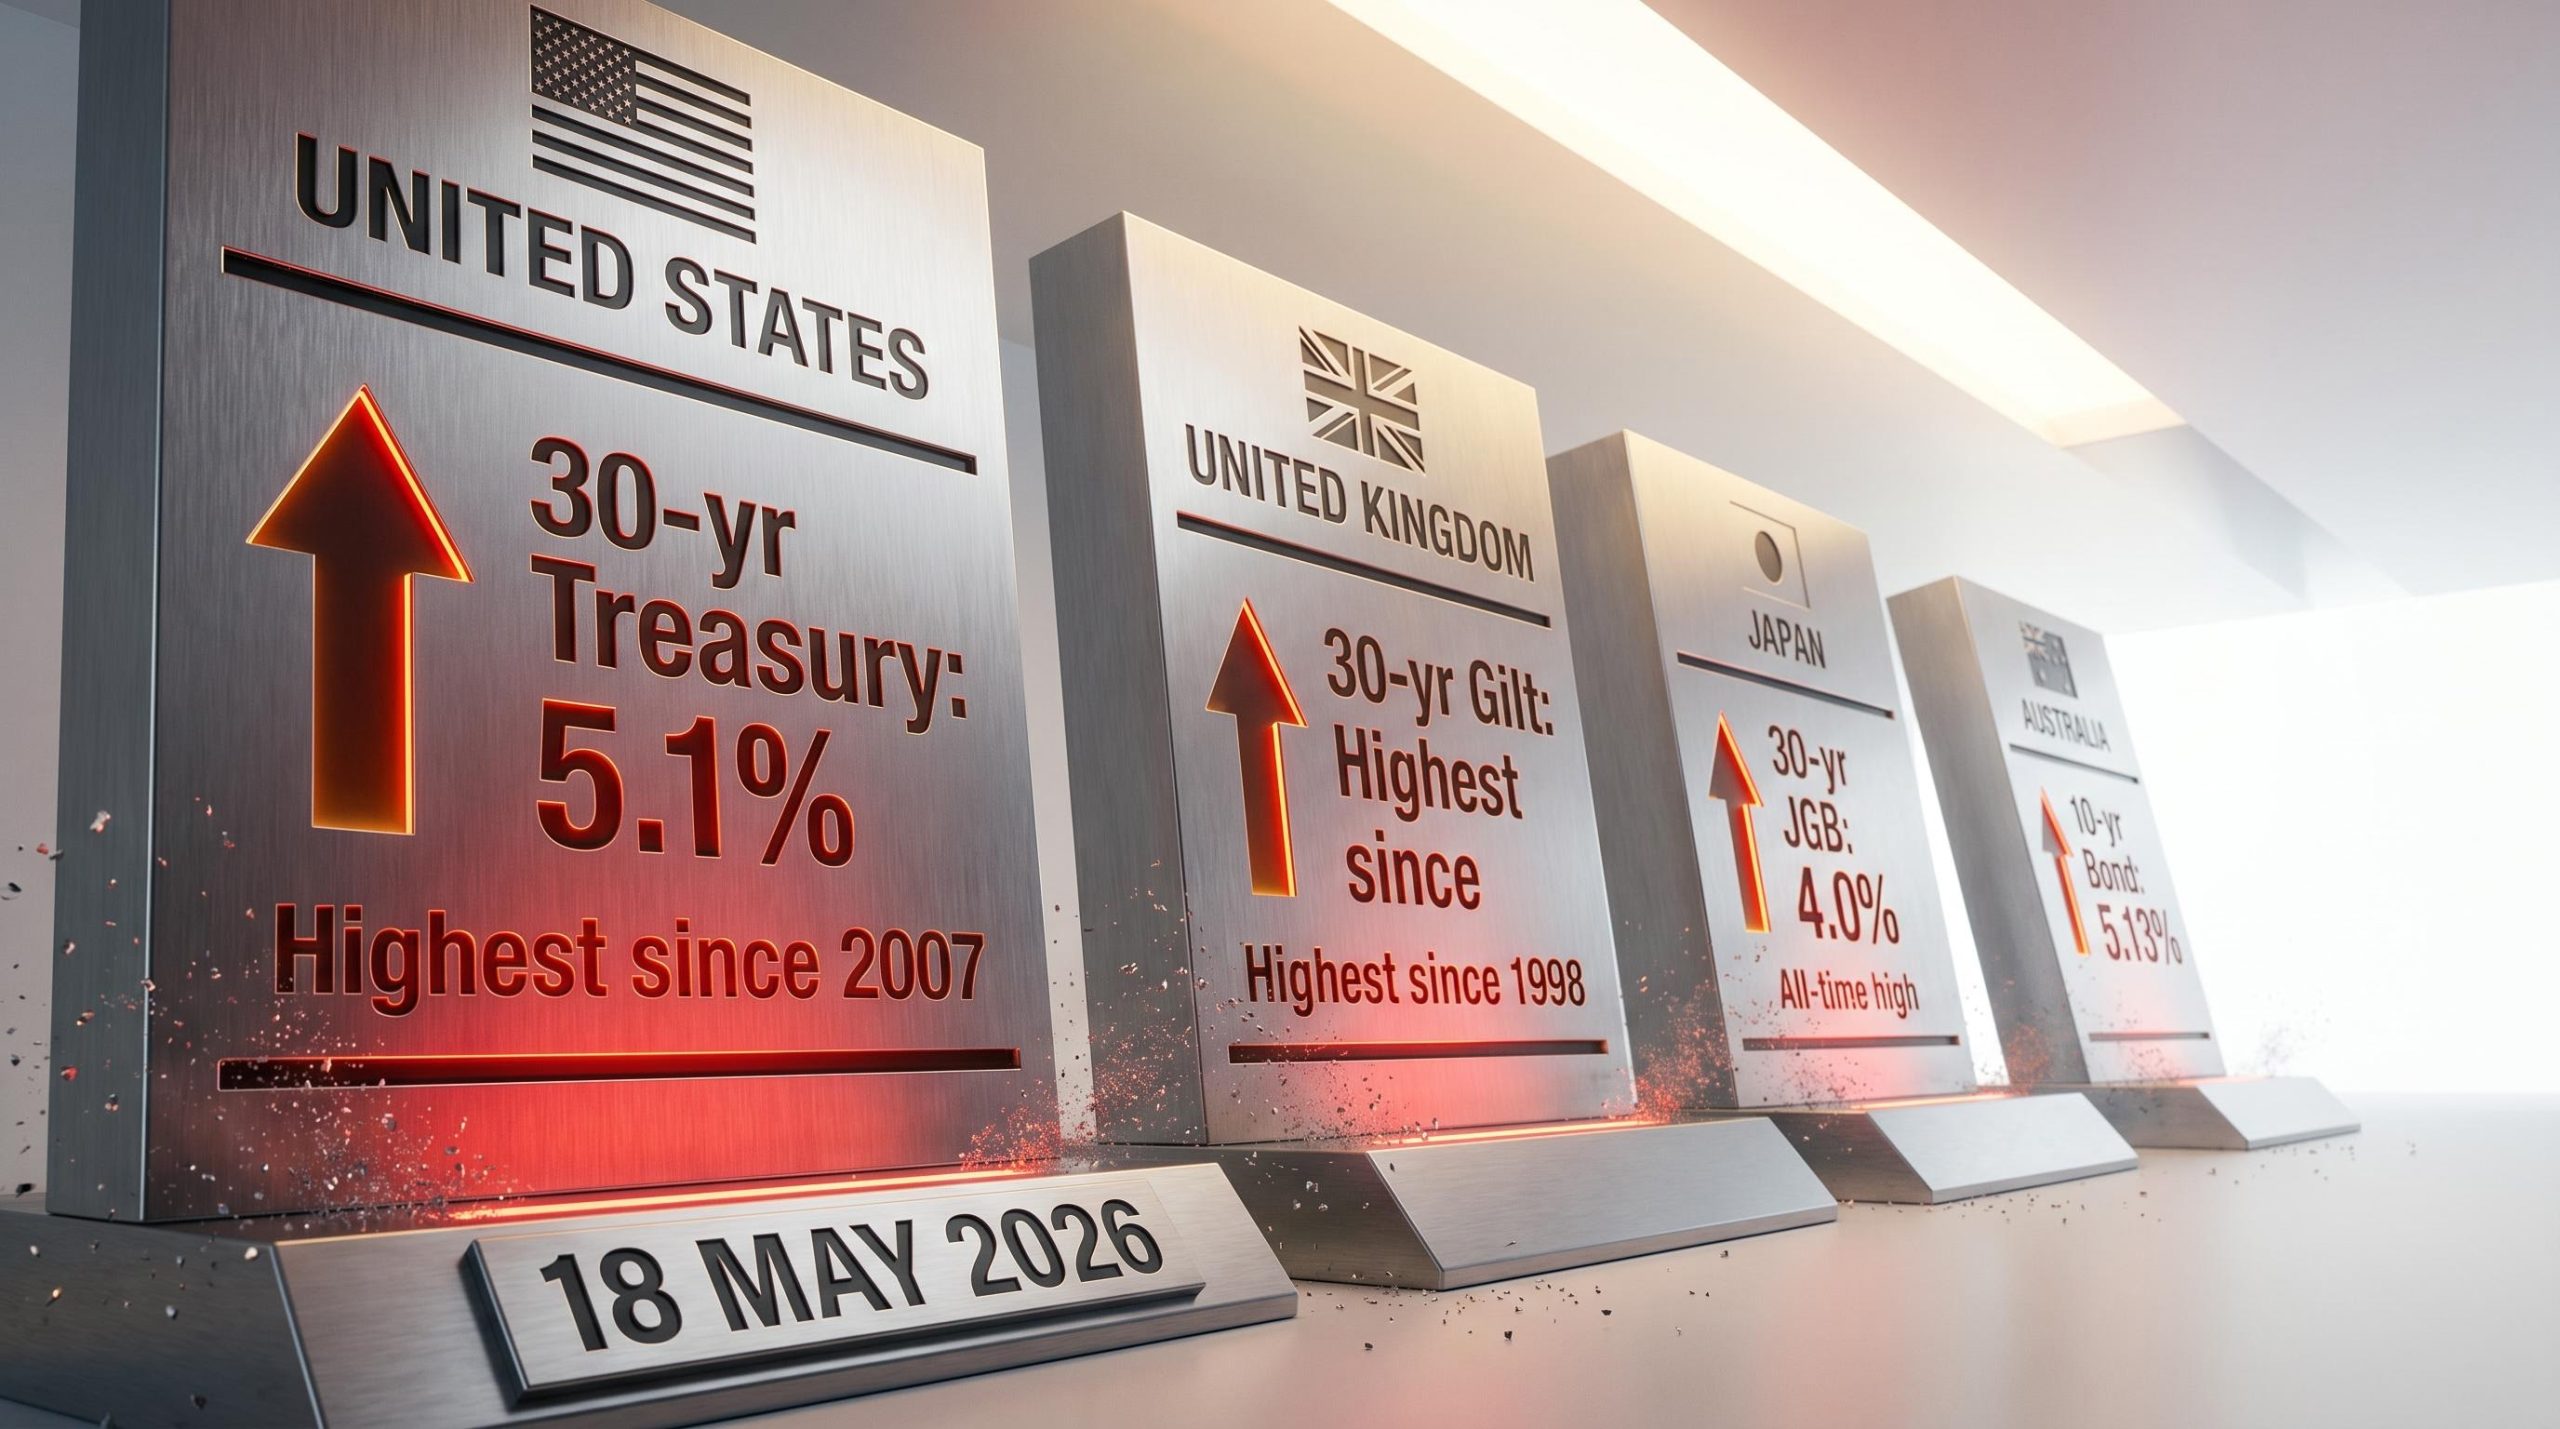
On 18 May 2026, the yield on a 30-year UK government bond hit its highest level since 1998. Japan’s 30-year bond touched 4% for the first time since those securities were issued in 1999. In the United States, the 30-year Treasury broke above 5.1% for the first time since 2007. Australia’s 10-year yield crossed 5.13%. These are not four separate stories. They are one.
A synchronised global bond selloff, driven by hotter-than-expected US inflation data and sustained Middle East energy-price pressure, has forced a simultaneous repricing of risk-free capital across every major developed economy. Government bond yields are the foundation on which all other asset prices are built. What happens in sovereign bond markets does not stay there.
What follows explains what is driving the selloff, why rising bond yields mechanically compress equity valuations, and which corners of the ASX face the most direct pressure, giving Australian retail investors a clear framework for interpreting the week’s events in their own portfolios.
The defining feature of this week’s bond rout is not the size of any single move. It is the simultaneity. Between 15 and 18 May 2026, yields surged across the United States, United Kingdom, Japan, and Australia in lockstep, removing the escape valve investors typically rely on: rotating into another country’s government bonds when one market sells off. That option did not exist this week.
The global bond selloff that began on 15 May 2026 concentrated multiple structural pressures into a single session: an oil shock from Strait of Hormuz disruption, sticky inflation expectations, and political risk premia that bond markets had not fully priced, producing simultaneous record or decade-high yields across four sovereign markets in what strategists described as a structural repricing of long-duration debt.
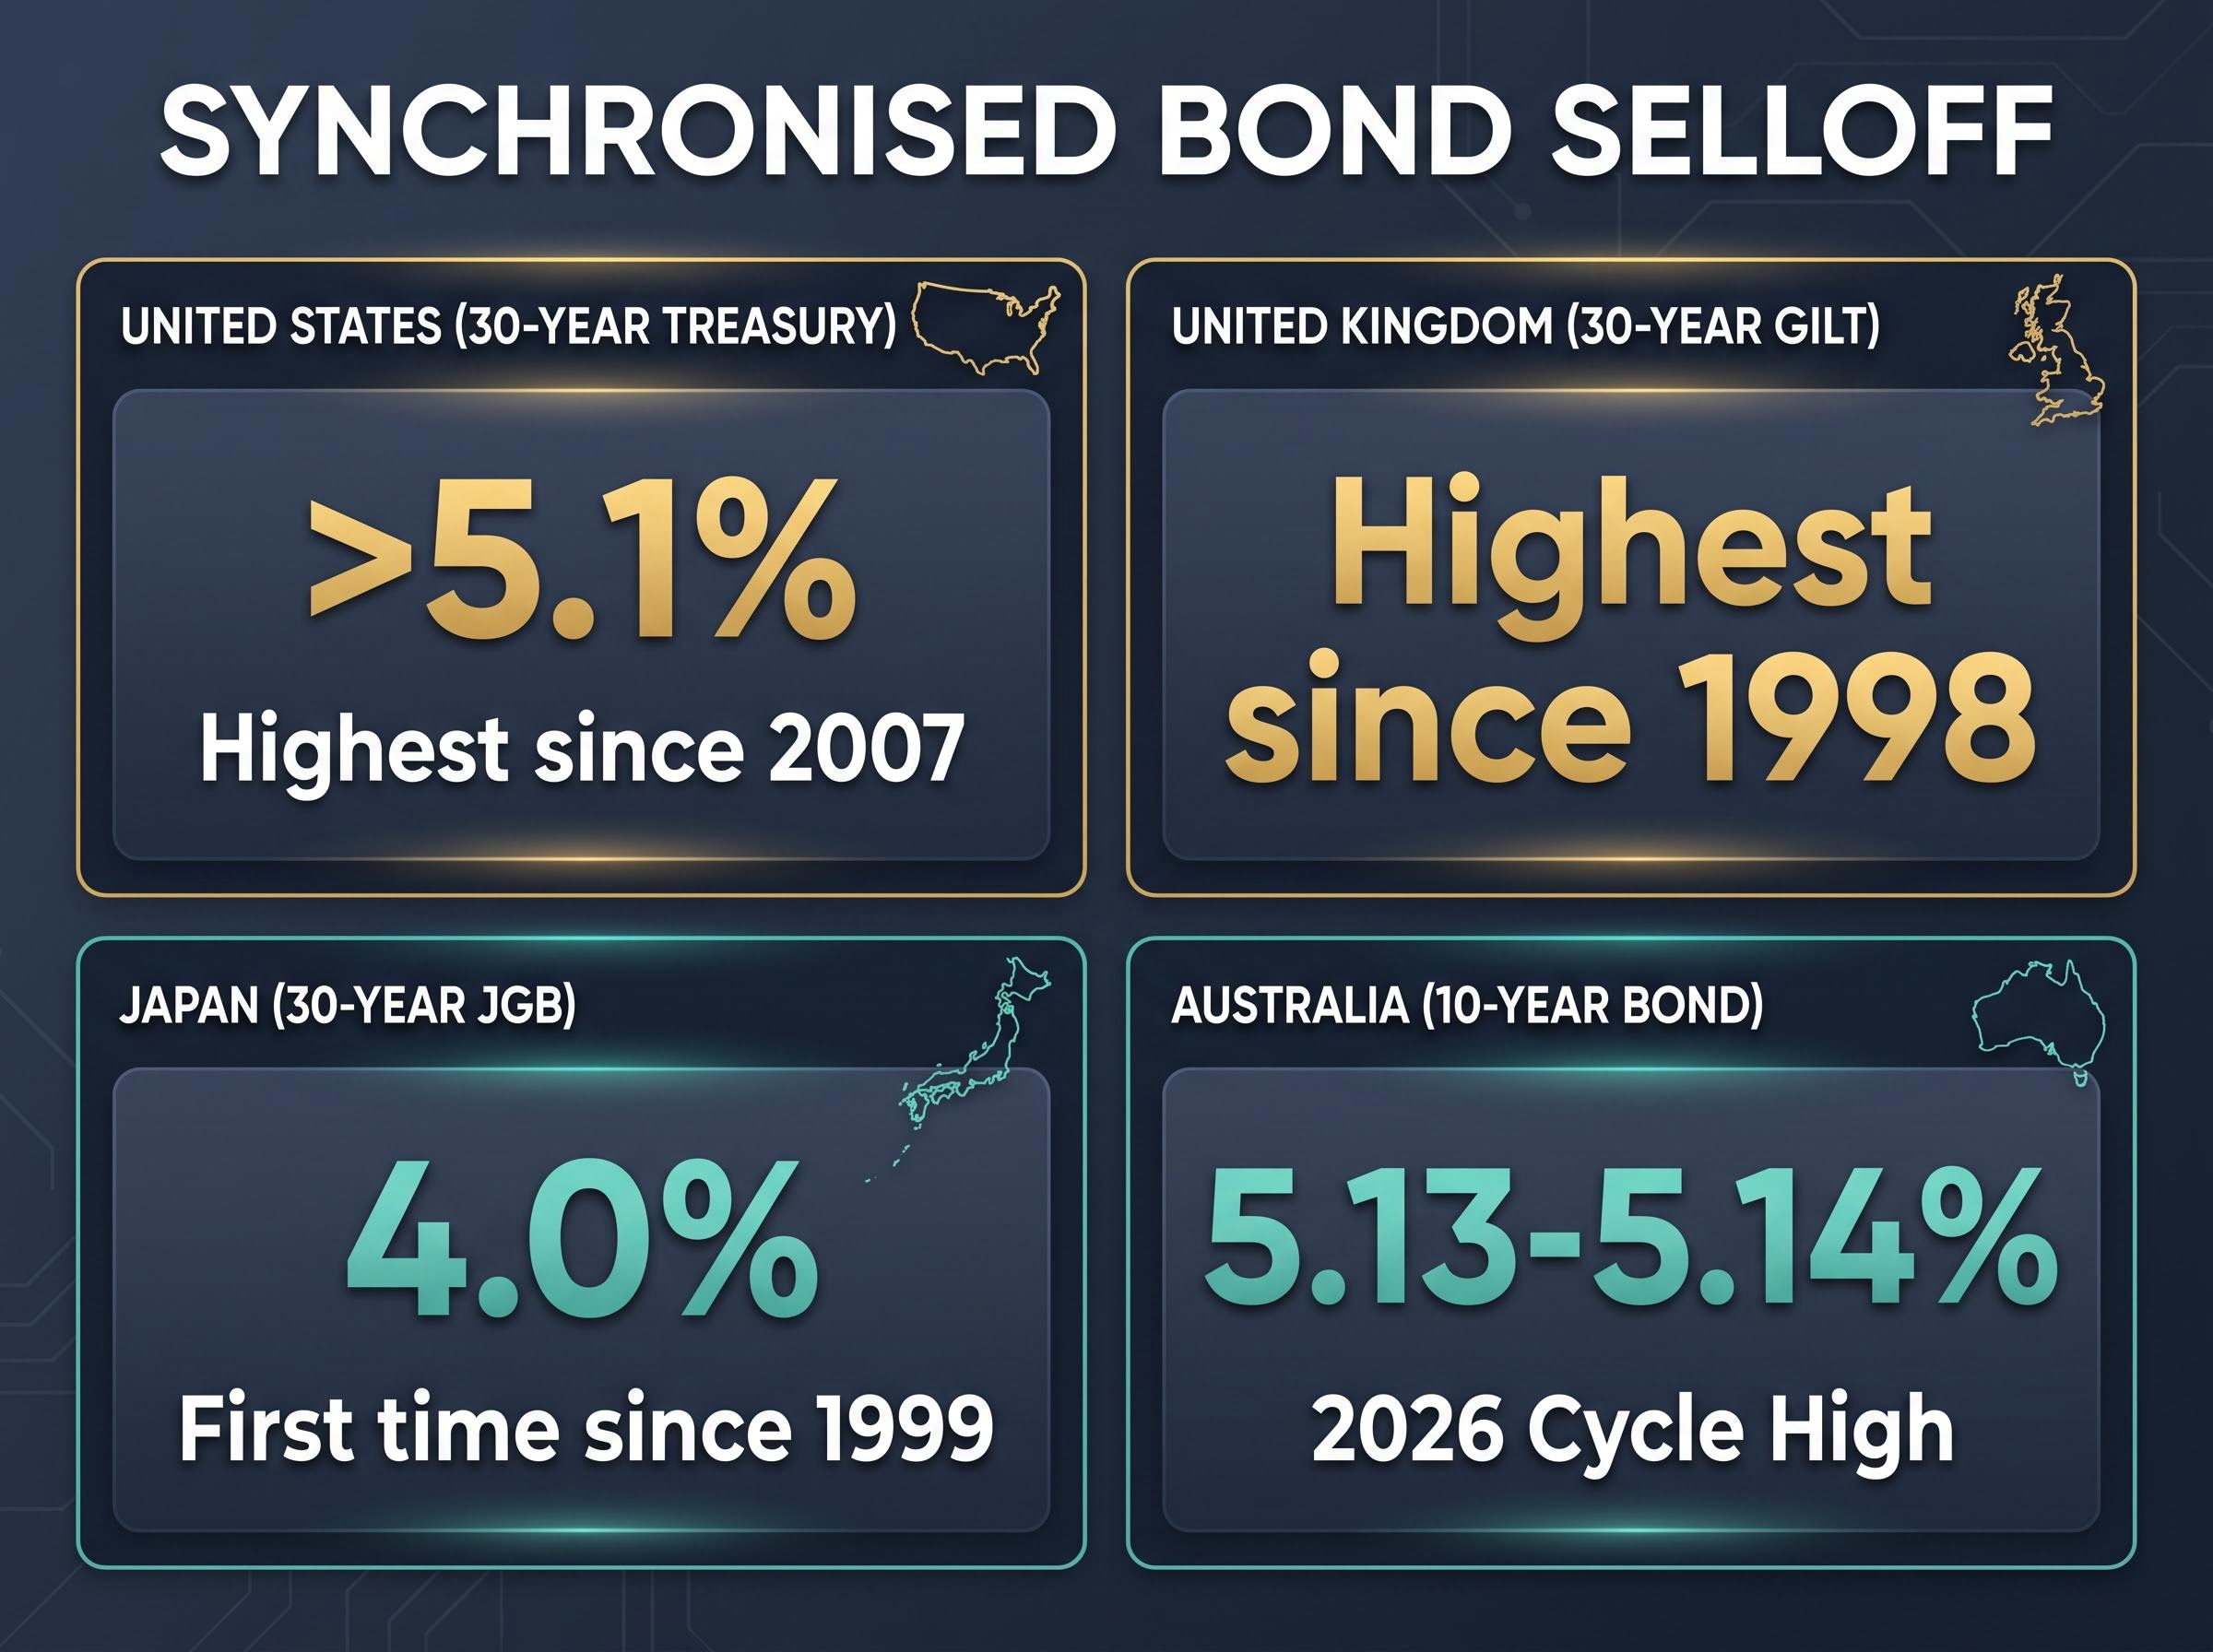
| Market | Instrument | Current yield | Historical comparison | Last time yield was this high |
|---|---|---|---|---|
| United States | 30-year Treasury | Above 5.1% | Post-GFC high | 2007 |
| United Kingdom | 30-year gilt | Highest since 1998 | Pre-euro era | 1998 |
| Japan | 30-year JGB | 4.0% | All-time high | Never (first issued 1999) |
| Australia | 10-year bond | ~5.13-5.14% | Multi-year high | 2026 (new cycle high) |
Two confirmed catalysts drove the repricing. US April consumer price index data came in at 3.8% annually, while producer prices surged 6.0%, with energy costs cited as the primary driver. Sustained oil and gas price pressure linked to the ongoing Middle East conflict reinforced the inflation signal, convincing bond markets that rate relief is further away than equity investors had assumed.
The UK 30-year gilt yield reached its highest level since 1998, a benchmark that predates the euro, the Global Financial Crisis, and two decades of quantitative easing.
Government bond yields represent the risk-free rate: the baseline return available to any investor willing to accept no credit risk, no business risk, and no uncertainty beyond the sovereign guarantee. Every other investment, equities, property, infrastructure, commodities, must offer a return above this baseline to justify the additional risk involved.
This is where the mechanism that matters to equity investors becomes visible. When the risk-free rate rises:
The effect is purely mechanical. It requires no deterioration in earnings, revenue, or management quality. It is arithmetic.
Consider a stock generating $1 annually in perpetuity. Discounted at a 2% risk-free rate, that stream of income is worth approximately $50 today. Discounted at 5%, the same stream is worth approximately $20.
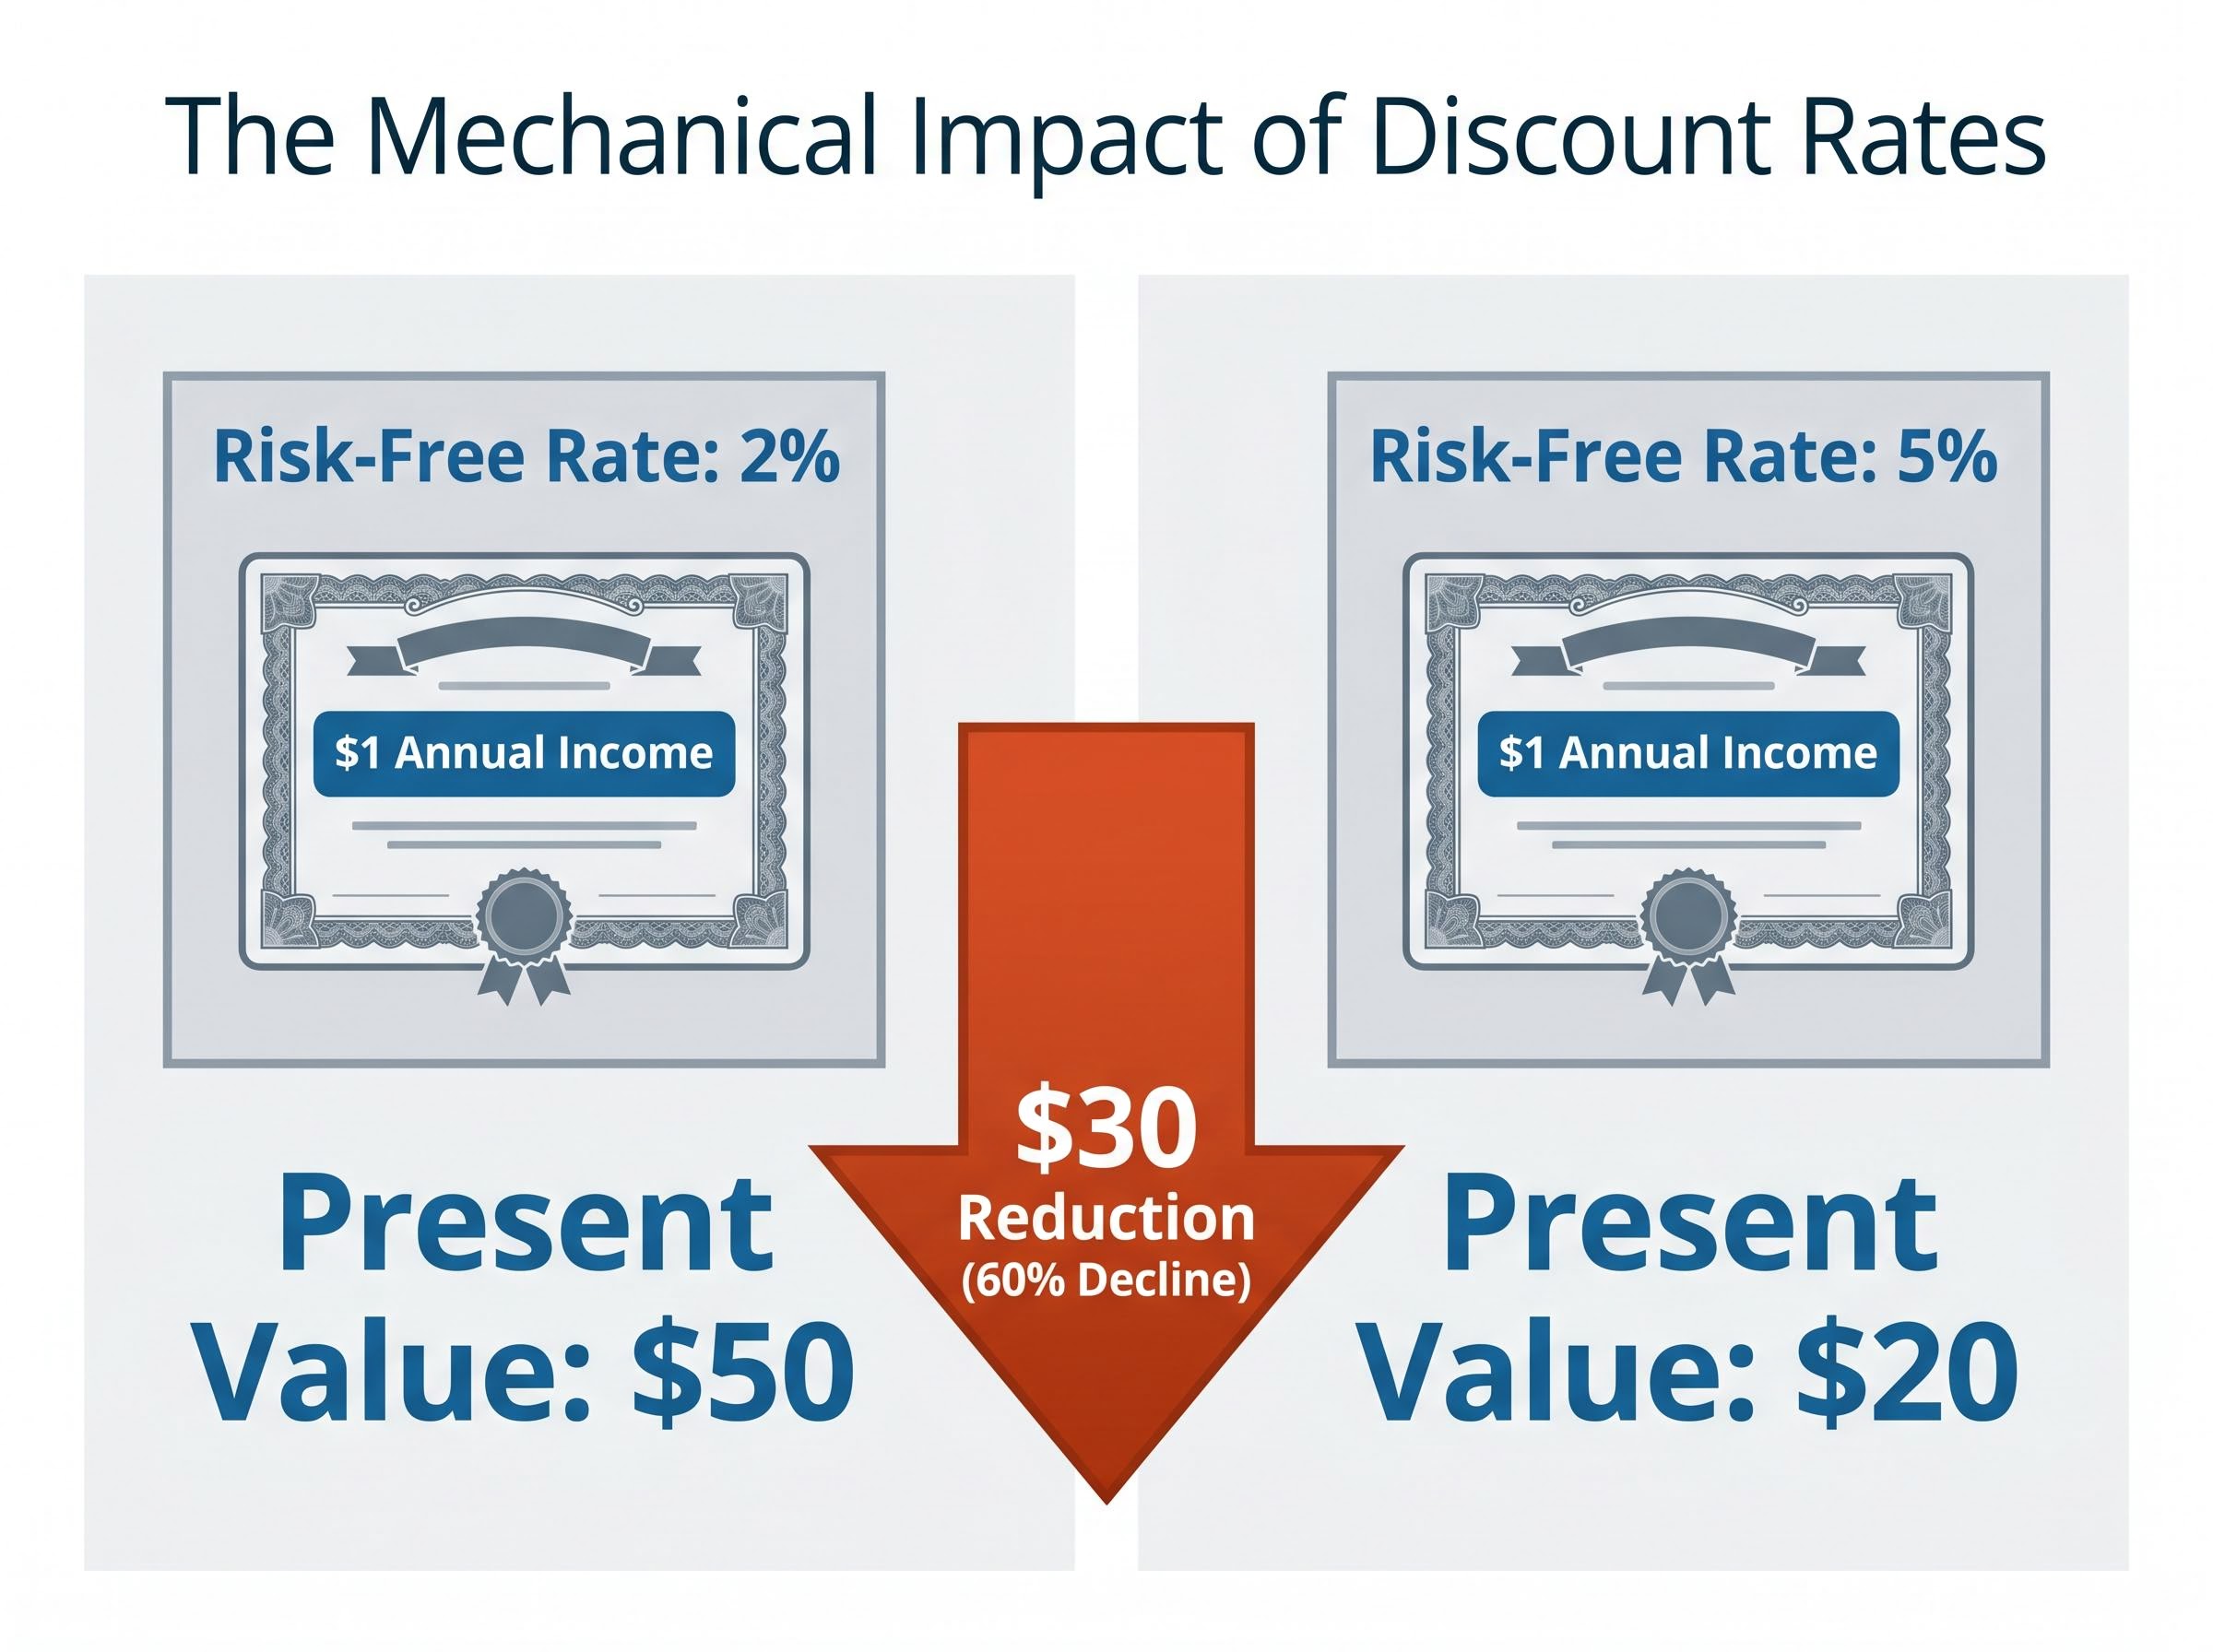
That is a $30 reduction in present value, a 60% decline, with no change to the company’s operations, competitive position, or profitability. With the US 30-year yield now above 5% and the Australian 10-year yield at approximately 5.13%, this compression is not theoretical. It is the active force repricing asset values across the ASX and global equity markets right now.
The discount rate mechanism does not apply equally across all equities. The degree of exposure depends on when a company’s cash flows arrive.
Companies whose value is concentrated in earnings projected far into the future, sometimes a decade or more away, are classified as long-duration equities. A small shift in the discount rate produces a large shift in their present value because the compounding effect of that higher rate compounds over many years. Companies delivering strong near-term profits are less mechanically exposed to the same yield change.
The equity categories with the greatest sensitivity to this week’s yield moves, ranked by relative exposure:
The S&P/ASX 200 A-REIT Index fell 2.62% on 18 May 2026 alone, closing at 1,621.60, providing a live illustration of yield sensitivity in one of the ASX’s most widely held income sectors.
Individual major bank share price data and infrastructure sub-index performance for the week were not available at time of publication.
The pressure on commodity prices this week operates through two distinct mechanisms, and their compounding effect makes the headwind more durable than either would be in isolation.
Higher US yields attract global capital into dollar-denominated assets, lifting the US dollar. Because most commodities are priced in USD, a stronger greenback raises the effective cost for non-US buyers and softens demand at the margin. The Australian dollar traded in a range of approximately 0.712-0.726 during 13-18 May, closing around 0.7123-0.7148 on 18 May, reflecting the risk-off sentiment accompanying the bond rout.
The commodity damage this week was broad-based.
| Commodity | Exchange | Weekly price change | Follow-through |
|---|---|---|---|
| Aluminium | LME | -3.5% | — |
| Copper | LME | -3.1% | COMEX futures down a further 0.9% in Asian trading |
| Nickel | LME | -2.8% | — |
For ASX-listed resource companies, the combination of weaker commodity prices and a softer Australian dollar creates a two-sided squeeze that carries outsized significance given Australia’s resource-heavy index composition.
Gold generates no income. Its entire investment appeal depends on capital appreciation and its role as an inflation hedge. When risk-free bonds yield 5% or more annually, the opportunity cost of holding a zero-income asset rises materially.
Gold has retreated sharply from its January 2026 high of approximately US$5,589 per ounce. At current yield levels, the trade-off between holding gold and holding income-bearing government bonds is the least favourable it has been in nearly two decades.
The opportunity cost of holding gold rises in direct proportion to the risk-free rate, and with silver futures dropping more than 4% and platinum slipping alongside bullion on 17 May 2026, the precious metals complex reflected a broad repricing of zero-income assets as the dollar firmed and bond yields pressed higher.
The ASX sectors most Australian retail investors are likely to hold in their superannuation or direct equity portfolios are precisely those most exposed to the current yield environment.
Bond-proxy sectors, those whose investment appeal rests on income relative to the risk-free rate, reprice downward when yields rise because their relative advantage diminishes. Consider a utility paying a 5% dividend yield. When risk-free bonds yielded 2%, that income stream offered a 3-percentage-point premium for taking on business, regulatory, and operational risk. At current Australian 10-year yields of approximately 5.13%, the same dividend offers near-zero premium for substantially more risk.
A 5% dividend yield that was once generous compared to a 2% bond becomes unremarkable against a 5% risk-free rate. The income has not changed. The comparison has.
The specific ASX sectors under pressure, and why:
The bond selloff is more than a market event. It is an assertion. Bond markets are repricing the assumption that inflation would remain manageable and that central banks would prioritise growth. The April US data, 3.8% CPI and 6.0% PPI, challenged that assumption directly, and sustained Middle East energy-price pressure suggests the inflationary impulse is structural rather than transient.
For Australian investors, the forward question is duration. If inflation remains elevated and central banks including the Reserve Bank of Australia (RBA) respond with further rate pressure, the yield environment currently battering bond-proxy sectors may persist rather than reverse quickly. The RBA’s May 2026 Statement on Monetary Policy discussed elevated long-term yields in general terms, though direct commentary on the global bond selloff had not been issued at time of publication.
RBA rate divergence from other major central banks intensified this dynamic: while the Fed, ECB, and Bank of England all held rates steady in the same week the RBA lifted to 4.35%, the resulting gap of up to 235 basis points between Australia and its peers added a domestic tightening layer on top of the global yield shock, compressing the margin further for rate-sensitive Australian assets.
Three conditions would sustain elevated yields:
Three data points and events will most directly signal whether yield pressure is easing or intensifying:
These are monitoring signals, not predictions. The bond market will price its conclusions before commentary arrives.
The bond market has not moved in isolation this week. It has repriced the cost of capital for equities, compressed the relative appeal of income-paying sectors, pressured commodity prices through dollar strength, and raised the opportunity cost of holding gold. The mechanism linking all of these is the same: the risk-free rate moved, and everything priced against it adjusted.
Australian investors holding infrastructure, listed property, or major bank positions now hold assets whose valuations are mechanically sensitive to where bond yields settle. Understanding that sensitivity, and monitoring the inflation data, RBA signals, and energy prices that will determine whether current yields persist, is the first step in managing portfolios through an environment where the bond market is setting the pace.
Investors looking to reposition around the yield environment described in this article will find our dedicated guide to building an inflation-aware ASX ETF portfolio covers six specific ASX-listed funds across fixed income, global equities, and cash categories, with each fund assessed against the current 4.6% CPI rate and 4.10% RBA cash rate.
This article is for informational purposes only and should not be considered financial advice. Investors should conduct their own research and consult with financial professionals before making investment decisions. Past performance does not guarantee future results. Financial projections are subject to market conditions and various risk factors.
When bond yields rise, the risk-free rate of return increases, meaning every other asset class must offer a higher return to justify its risk. This mechanically reduces the present value of future corporate earnings and pushes share prices lower even if a company's business has not changed.
The synchronised selloff was triggered by hotter-than-expected US inflation data (CPI at 3.8% and PPI at 6.0% annually) combined with sustained energy price pressure from Middle East conflict, which convinced bond markets globally that interest rate relief was further away than previously assumed.
A-REITs, infrastructure, utilities, and major banks are most exposed because their investment appeal rests on income relative to the risk-free rate. The S&P/ASX 200 A-REIT Index fell 2.62% on 18 May 2026 alone as a direct result of yield-driven repricing.
Rising yields strengthen the US dollar, which raises the effective cost of USD-priced commodities for non-US buyers and softens demand. Gold is additionally pressured because its zero-income nature becomes less attractive when risk-free bonds yield 5% or more, increasing the opportunity cost of holding bullion.
The three key signals to watch are upcoming US CPI and PPI releases, RBA communications in June 2026 for any shift in domestic rate guidance, and sustained movements in energy prices tied to Middle East developments, since oil costs were the primary driver of the April US inflation spike.