
Netwealth Group commands a return on equity of 62.3%, a figure that would be exceptional in almost any sector on the ASX. Yet as of late May 2026, the share price was sitting 43.6% below its 52-week high. For investors unfamiliar with high-growth platform businesses, that disconnect can look like distress. For those who understand how to read a business like Netwealth (ASX: NWL), it raises a more precise question: does the discount reflect a structural problem, or a market that has temporarily repriced growth? This Netwealth Group analysis unpacks what the company’s financial metrics actually signal, why conventional valuation tools can mislead investors who apply them to a business of this type, and what a more appropriate analytical framework looks like for ASX-listed wealth platforms operating with this kind of financial profile.
How NWL’s share price gap looks against its operating fundamentals
NWL was trading 43.6% below its 52-week high as of late May 2026.
That figure, on its own, could mean almost anything. A business with deteriorating fundamentals trading at a steep discount is unremarkable. A business with $88 billion in funds under administration (FUA), a 20.8% compounded annual revenue growth rate, $83 million in net profit for FY24, and a 62.3% return on equity trading at the same discount warrants a different kind of attention.
The gap between operational performance and share price does not resolve itself into a simple conclusion. Several legitimate interpretations apply:
- A broad repricing of growth multiples across the ASX technology and fintech sector, compressing valuations regardless of individual company quality.
- A sector-specific sentiment shift, where investors reassess the pace of adviser platform adoption or competitive dynamics.
- A normalisation from a valuation that ran ahead of fundamentals during a period of elevated market enthusiasm for platform businesses.
Each of these reads the same data differently, and none is inherently wrong. What the gap does require is that investors go deeper than the metrics presented here, into competitive positioning, adviser market trends, and forward earnings expectations, before drawing conclusions in either direction.
When big ASX news breaks, our subscribers know first
What Netwealth Group actually does, and why the model matters
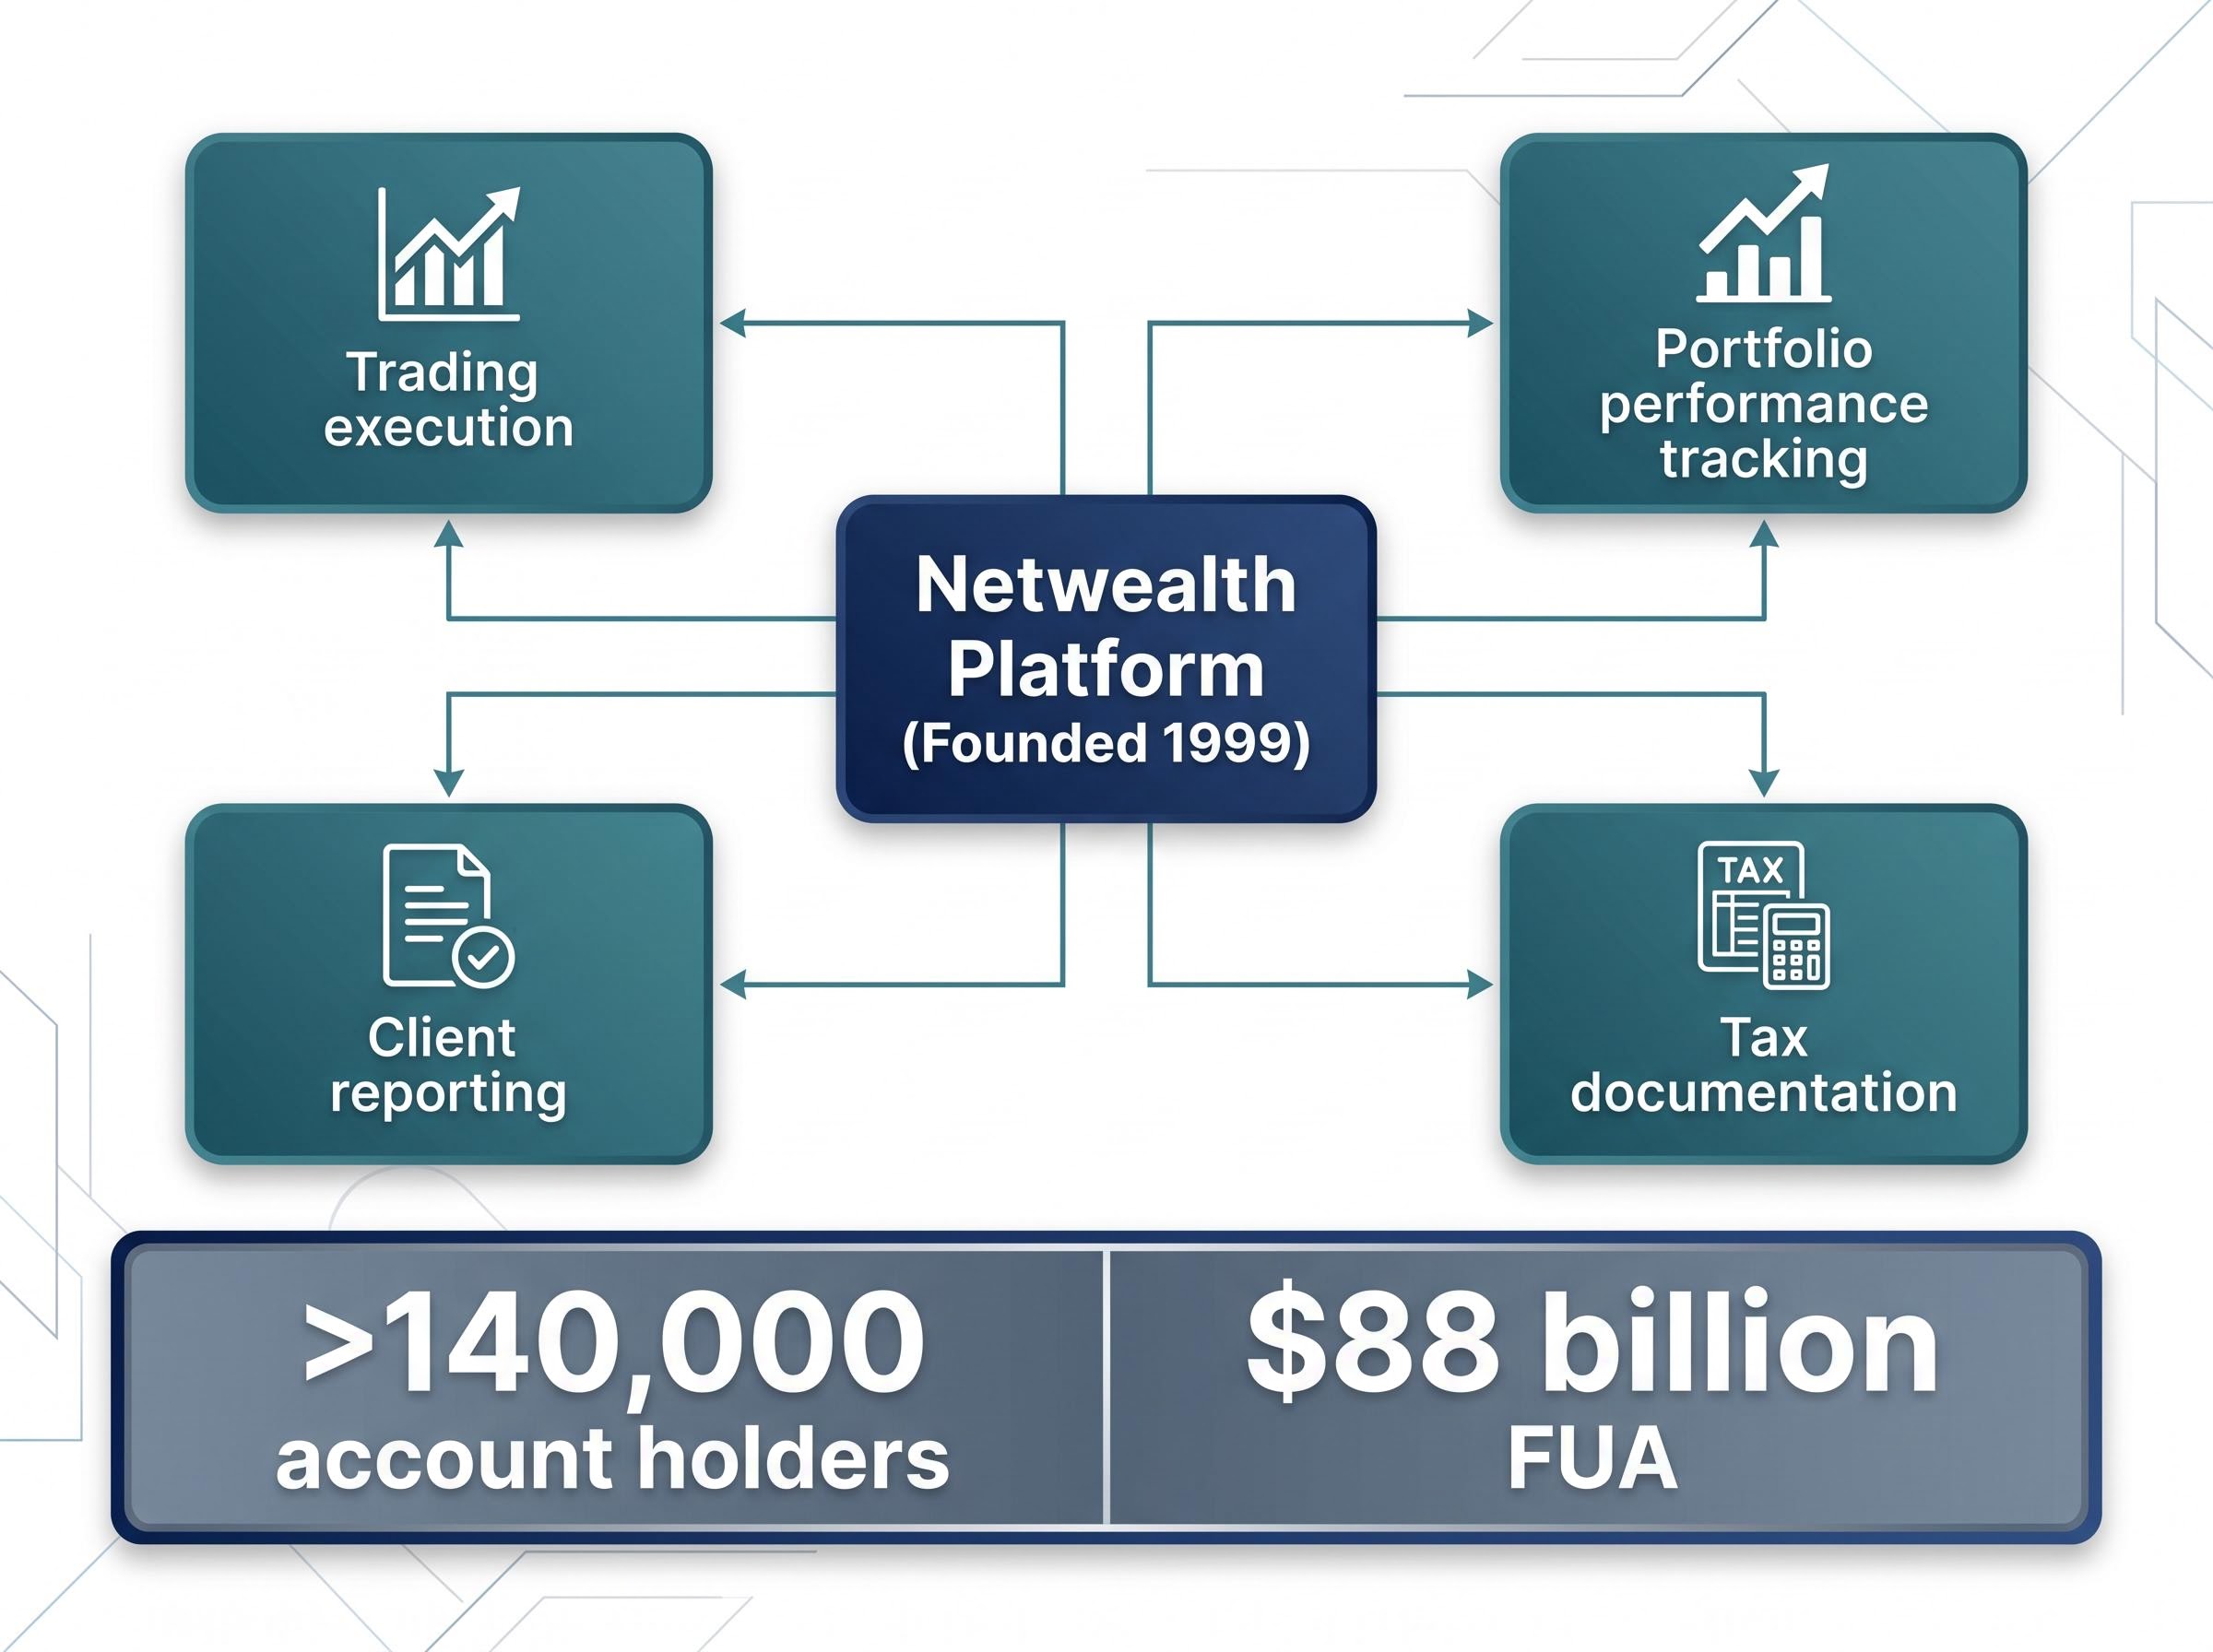
Netwealth Group, founded in 1999, operates a technology-enabled wealth administration platform. It is not a fund manager. It is not a financial adviser. The distinction matters because it determines how the business earns revenue and how its cost structure behaves as it grows.
The platform serves financial advisers who manage client investment portfolios online. It consolidates four core functions into a single integrated environment:
- Trading execution
- Portfolio performance tracking
- Client reporting
- Tax documentation
As of 2024, the platform served more than 140,000 account holders with FUA exceeding $88 billion.
Hub24’s FUA trajectory tells a closely parallel story: $151.7 billion in total funds under administration by March 2026 alongside a 16.2% share price decline from the start of 2025, a divergence between operational momentum and market sentiment that mirrors the analytical questions the Netwealth numbers raise and allows investors to assess whether the pattern is company-specific or sector-wide.
ASIC’s Regulatory Guide 148 sets out the disclosure and operational obligations that govern platforms providing investor directed portfolio services in Australia, establishing the compliance baseline within which Netwealth and its competitors must operate.
Why a platform model produces different economics
The value of understanding the platform structure is that it explains why Netwealth’s financial ratios look fundamentally different from those of a bank or an asset manager. In a platform business, revenue scales with accounts and FUA. The cost base, predominantly technology infrastructure and staff, grows more slowly. This is operating leverage: each additional dollar of FUA generates incremental revenue without a proportional increase in cost.
That structural characteristic is why return on equity and profit growth are more revealing metrics for a business like Netwealth than asset turnover or dividend yield. The economics of the model itself determine which analytical tools are appropriate.
Three years of compounding: reading the revenue and profit trajectory
A single year of strong revenue can be an anomaly. Three years of compounding at scale tells a different story.
Netwealth’s revenue grew at a compounded annual rate of 20.8% over the three years to FY24.
By FY24, revenue reached $255 million. Net profit expanded from $54 million to $83 million over the same three-year window. The trajectory matters more than any individual year’s figure because it indicates whether growth is converting to earnings or being absorbed by rising costs.
| Metric | Base year (FY21) | FY24 | Change |
|---|---|---|---|
| Revenue | — | $255 million | 20.8% CAGR |
| Net profit | $54 million | $83 million | +$29 million |
Revenue growing at 20.8% compounded while net profit rises from $54 million to $83 million signals a business that is scaling efficiently. The cost base is not consuming the incremental revenue. For investors evaluating any growth-stage platform, that relationship between the top line and the bottom line over a multi-year window is the single most important diagnostic.
What ROE of 62% actually means for a business like this
Return on equity (ROE) measures the profit a company generates for each dollar of shareholder equity retained in the business. A company earning $10 million in profit on $100 million of equity delivers a 10% ROE, a level broadly accepted as adequate for mature businesses.
Return on equity sits alongside revenue growth, earnings per share, profit margins, and the price-to-earnings ratio as one of the five fundamental analysis metrics that together form a diagnostic picture of a business, and the reason ROE carries particular weight for Netwealth is that it captures the productivity of reinvested earnings rather than simply the scale of the business.
Netwealth’s most recently reported ROE: 62.3%.
That figure is not merely high. It signals something specific about how the business deploys the capital it retains. A high-growth platform company that reinvests earnings rather than distributing them as dividends will naturally display elevated ROE, but only if that reinvestment is productive. A 62.3% ROE indicates that every dollar Netwealth retains is generating outsized returns, compounding the equity base at a rate most ASX-listed businesses cannot approach.
For context:
The DuPont decomposition of ROE separates the metric into its component drivers, namely net profit margin, asset turnover, and financial leverage, revealing that two businesses can report identical ROE figures through entirely different economic mechanisms, which is why the metric must be interpreted differently for a capital-light platform than for a bank or industrial.
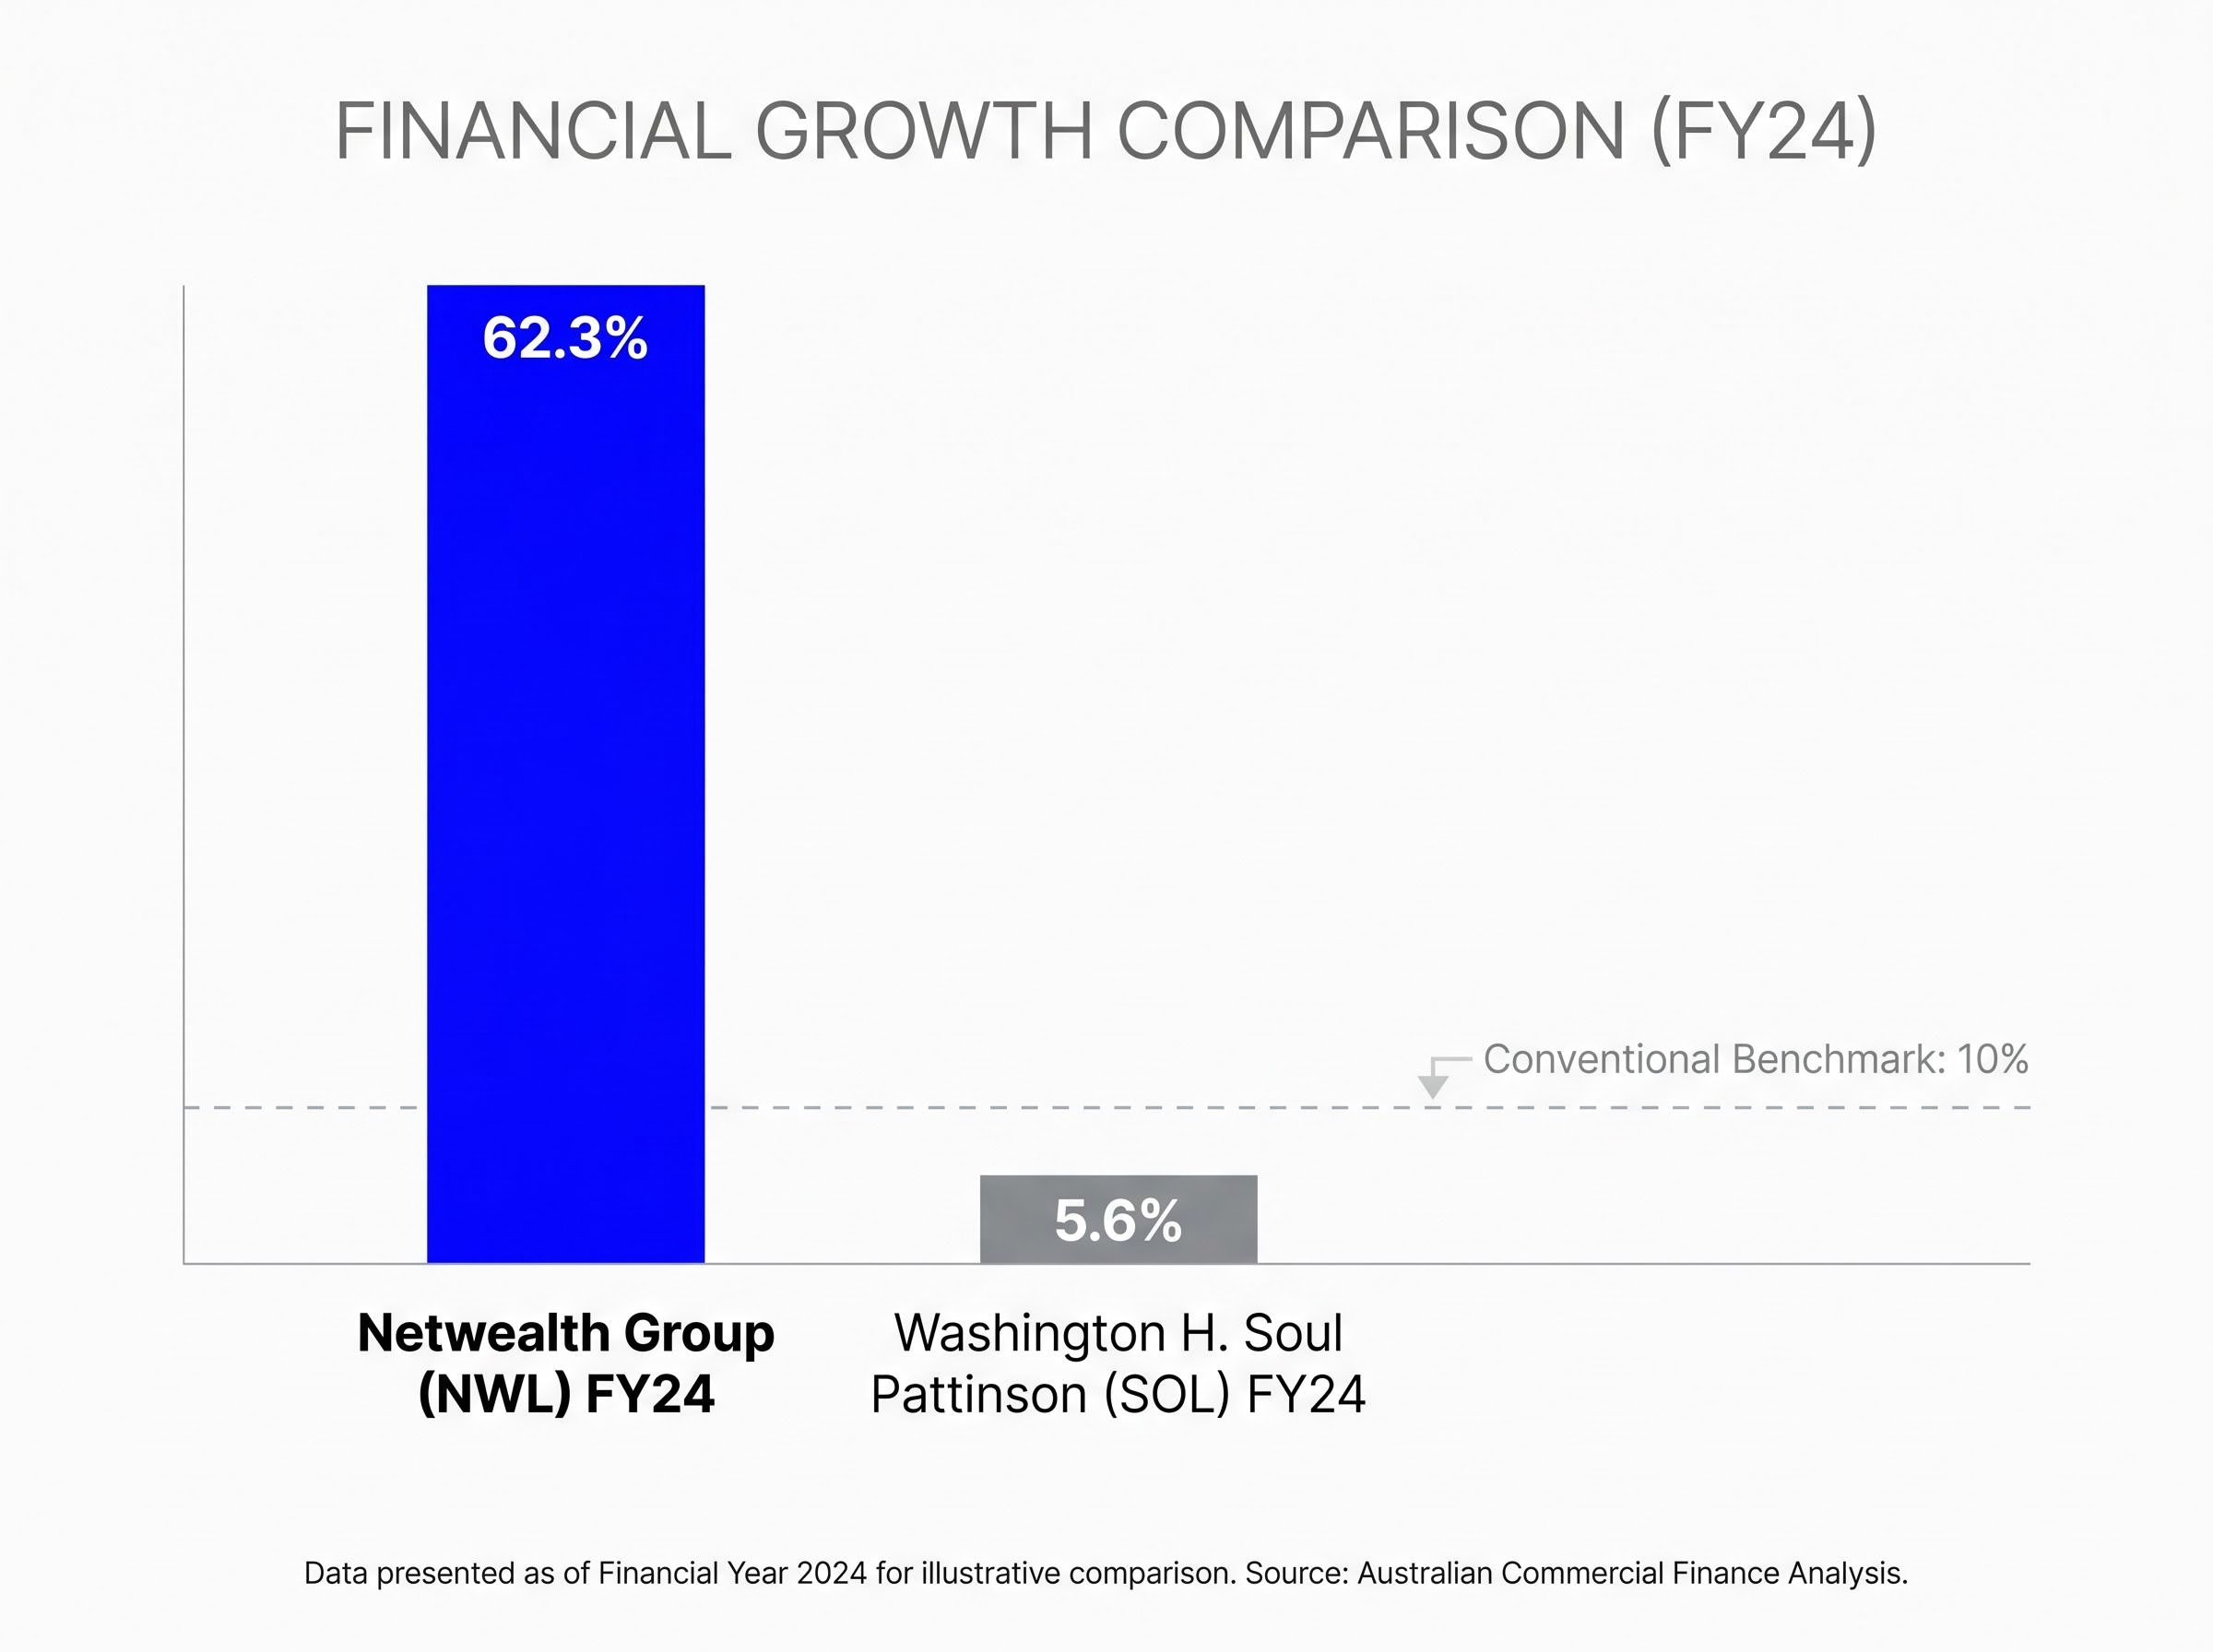
- Netwealth Group ROE: 62.3% (FY24)
- Washington H. Soul Pattinson (SOL), a mature diversified investment holding company: 5.6% ROE (FY24), below the conventional 10% benchmark
The comparison is not a judgement on SOL. It illustrates that the same metric carries different analytical weight depending on business type. For a reinvestment-oriented growth platform, ROE at this level is the primary evidence that the compounding engine is working, and the primary reason investors may be willing to pay a premium valuation multiple.
Why conventional valuation metrics can mislead here
Investors accustomed to evaluating banks, utilities, or mature industrials tend to reach for familiar tools: dividend yield, debt-to-equity ratio, or price-to-earnings on a single year’s earnings. These metrics are designed for businesses with stable, predictable cash flows and regular distributions. Applied to a high-growth, low-dividend platform business like Netwealth, they produce a distorted picture.
Dividend yield, for example, penalises a company that retains earnings for reinvestment. If that reinvestment generates a 62.3% return on equity, distributing less cash to shareholders may in fact be the more value-creating decision. A debt-to-equity ratio built for assessing leverage risk in capital-intensive businesses carries limited diagnostic value for a platform with minimal physical infrastructure.
This is not a limitation unique to Netwealth. It applies structurally to any ASX-listed fintech or wealth platform in a high-growth phase. According to the Rask Invest analytical framework, revenue trajectory, profit growth, and ROE are more informative than point-in-time figures for companies operating in this mode.
The price-to-sales ratio offers one bridge between these frameworks: Netwealth’s P/S of 21.24x as of mid-2026 sits approximately 10.5% below its five-year historical average of 23.72x, a compression that reflects both the lower share price and an expanded revenue base, providing a relative valuation anchor that neither the P/E nor the ROE alone supplies.
Evaluating growth platform performance: which metrics carry the most weight
For investors evaluating businesses like Netwealth, the following three-metric framework provides a more appropriate diagnostic:
- Multi-year compounded revenue growth rate: Does the business demonstrate sustained demand, or is a single year flattering the picture?
- Net profit expansion over the same window: Is the growth converting to earnings, or is the cost base consuming it?
- Return on equity: Is the capital being retained and reinvested productively, or is the business simply growing without generating efficient returns?
None of these is a valuation trigger on its own. They are diagnostic tools that establish whether a business warrants deeper due diligence, not substitutes for a complete investment case. The SOL versus NWL comparison illustrates why applying the same framework to fundamentally different business types produces misleading conclusions in both directions.
Netwealth’s metrics are a starting point, not a verdict
The metrics examined here, including FUA of $88 billion, a 20.8% revenue CAGR, net profit growth from $54 million to $83 million, and a 62.3% ROE, represent an analytical entry point. They do not constitute a complete investment case. Competitive dynamics, adviser market trends, regulatory developments, and forward earnings expectations all require separate, detailed assessment.
Margin compression at Netwealth adds a layer of complexity that the three-metric framework does not fully capture: net profit margin fell from 35.4% to 15.71% even as FUA grew to AU$125.8 billion and 16 analysts maintained a consensus price target implying more than 20% upside, a divergence that raises specific questions about cost cycle timing rather than structural deterioration.
For investors pursuing deeper due diligence, Netwealth’s ASX announcements and investor presentations are available through the ASX announcements portal and the company’s investor centre. Independent broker research provides additional context on valuation and forward estimates.
The analytical framework applied here, prioritising multi-year revenue trajectory, profit growth direction, and ROE over conventional point-in-time metrics, is transferable to the wider ASX wealth platform sector. Any comparable business trading in this space can be assessed through the same lens.
This article is for informational purposes only and should not be considered financial advice. Investors should conduct their own research and consult with financial professionals before making investment decisions.