
ASX 200 Valuation Leaves No Room for an Earnings Miss
17 mins ago


Bendigo and Adelaide Bank shares have spent late May 2026 trading around $10.40-$10.50, a range that feels settled until two standard valuation methodologies are applied to the bank’s actual financial data. A comparable company P/E analysis, using the Australian banking sector’s average multiple, produces an estimate of $15.77 per share. A Dividend Discount Model, adjusted for franking credits, stretches as high as $19.64. The gap between where the stock trades and where these models say it could be valued is wide enough to demand scrutiny, not acceptance. What follows is a worked analysis of both frameworks, applied to Bendigo and Adelaide Bank’s FY24 and 1H FY25 results, designed to show where the estimates agree, where they diverge, and what drives the spread between them.
Bendigo and Adelaide Bank reported FY24 cash earnings of approximately $530 million, translating to cash earnings per share (EPS) of $0.87. The total FY24 dividend came in at $0.63 per share, fully franked, representing a payout ratio of approximately 70-75%.
The 1H FY25 result, announced on 17 February 2025, showed cash earnings of $265.2 million and diluted cash EPS of 46.9 cents. The interim dividend was $0.32 per share, fully franked.
One detail matters for everything that follows: BEN has not issued quantified FY25 EPS or net profit guidance. Management’s forward commentary remains qualitative, covering loan growth, margin stability, and cost targets. Any valuation model applied from this point forward relies on scenario assumptions, not company-issued forecasts.
At the current price of approximately $10.40-$10.50, BEN’s implied trailing P/E sits at roughly 12x based on FY24 cash EPS of $0.87. The broker community is not aligned on where the stock goes from here.
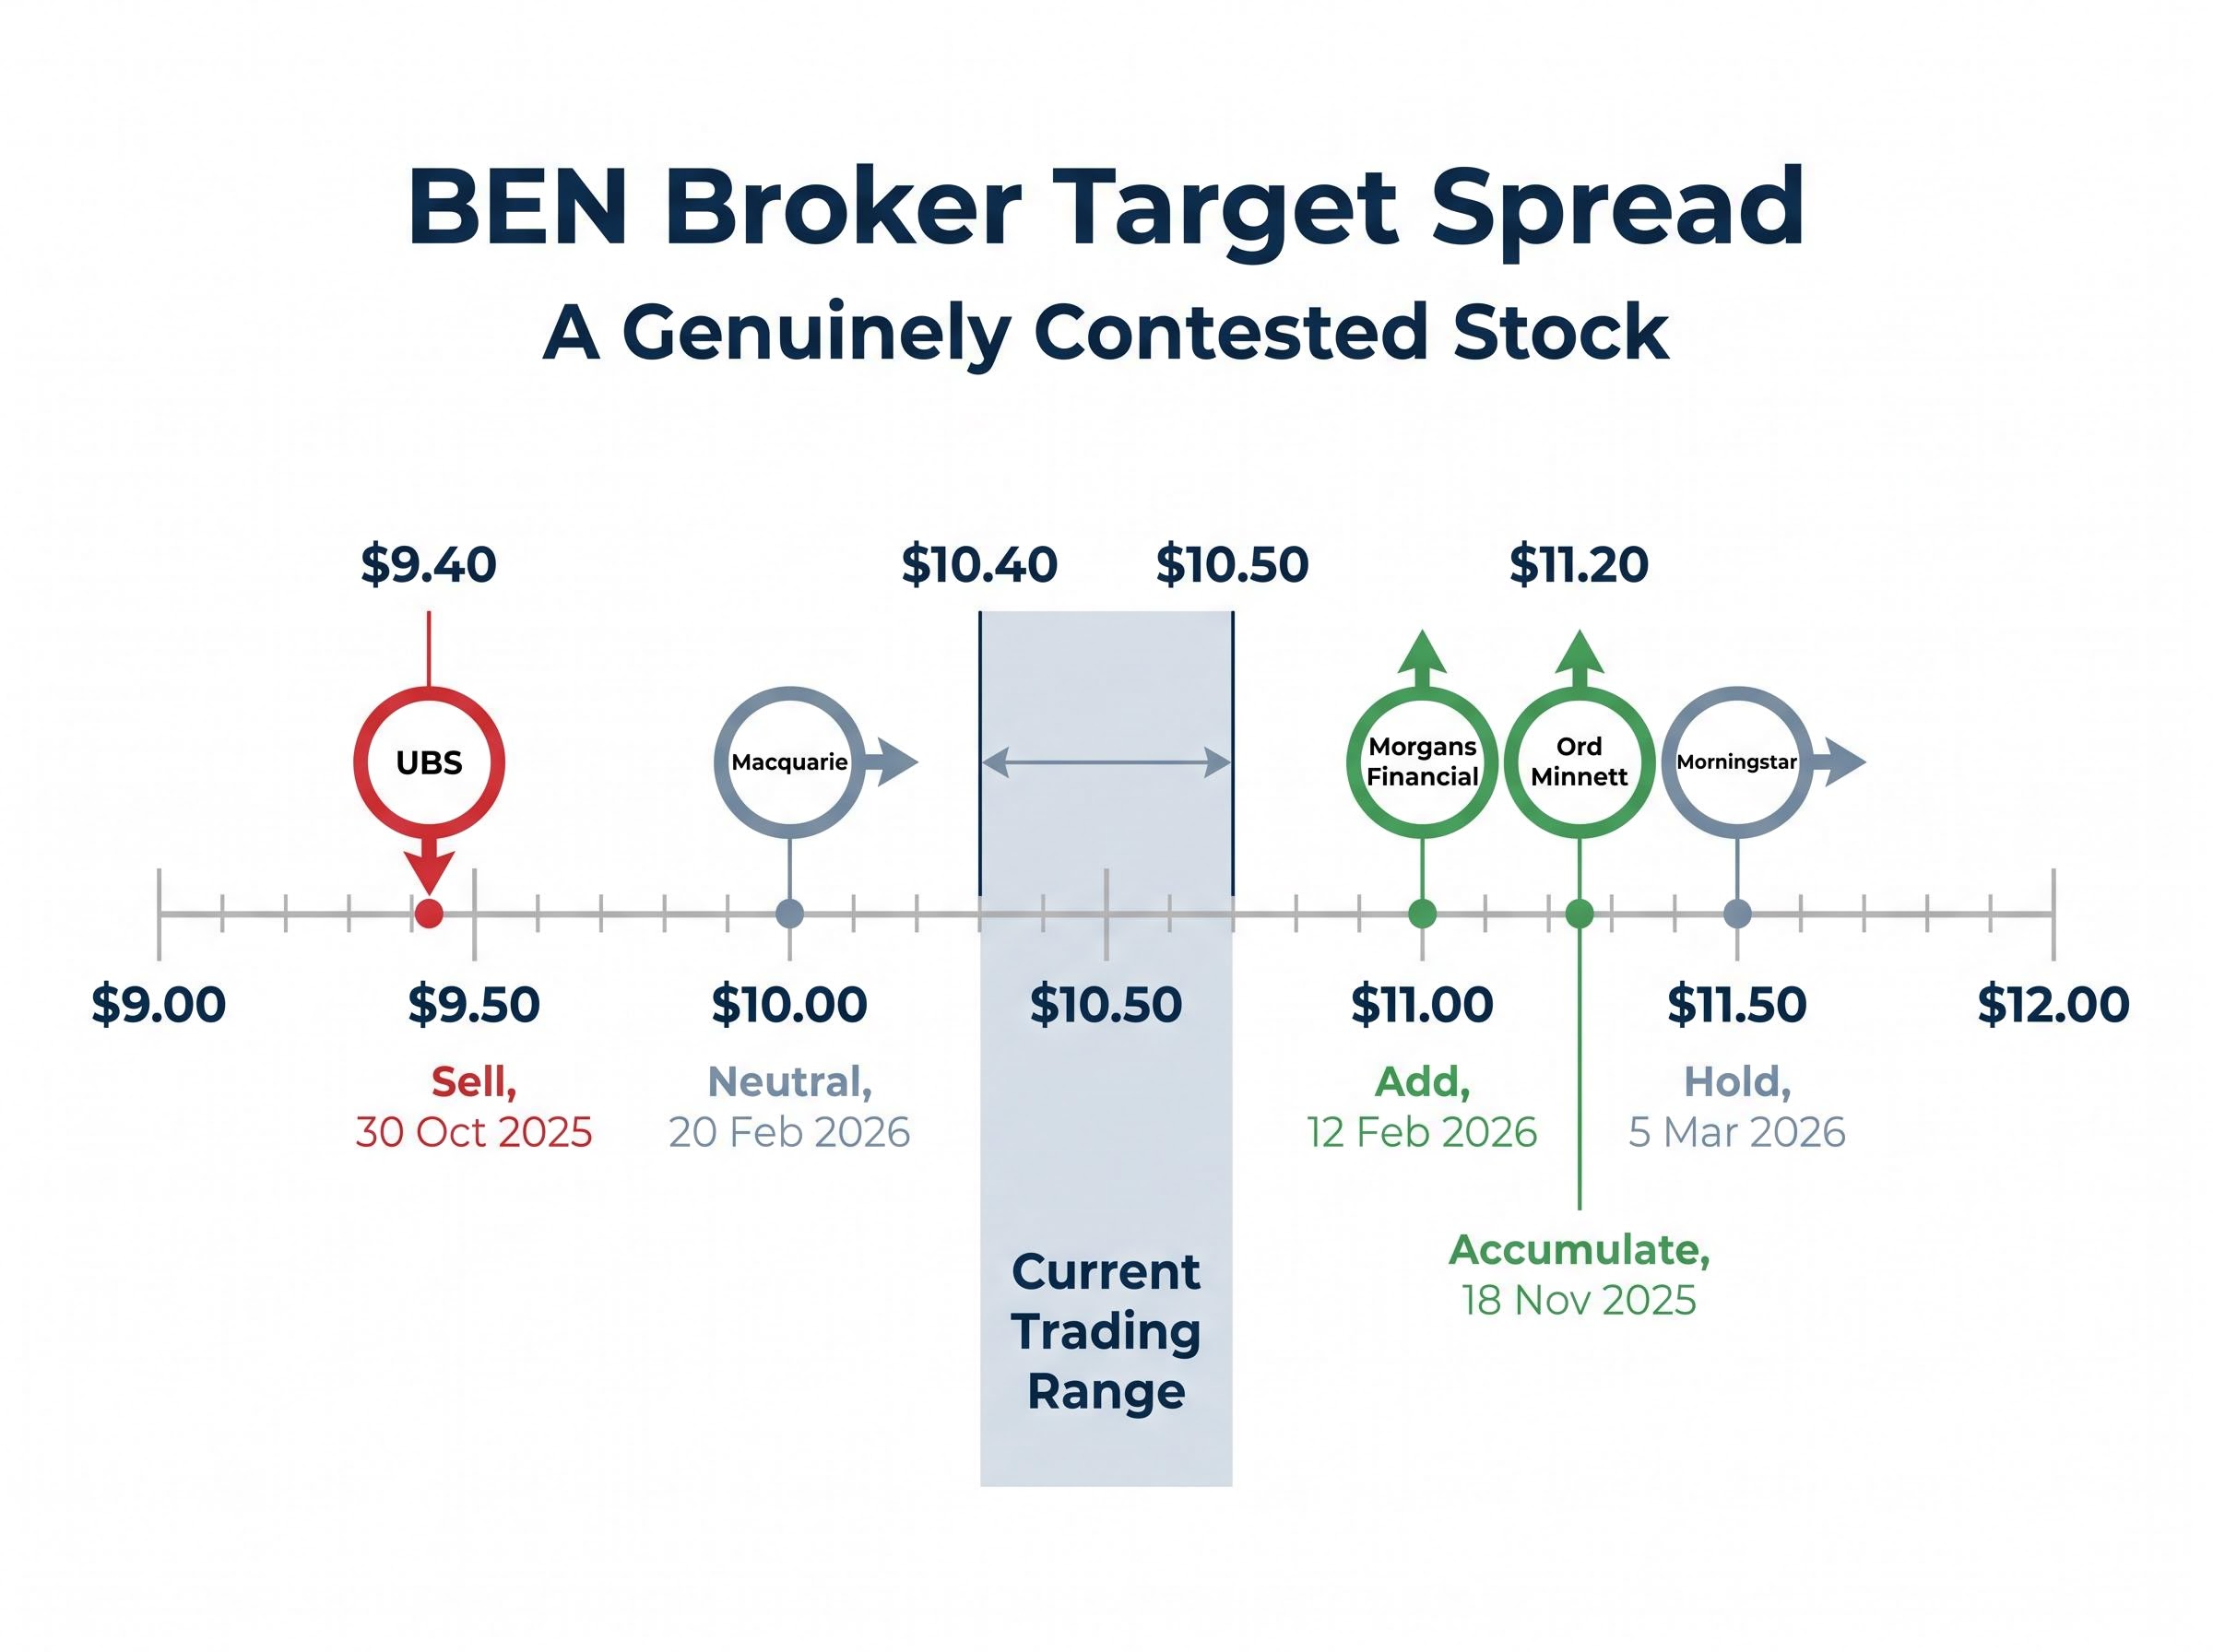
| Broker | Rating | Price Target | Date |
|---|---|---|---|
| UBS | Sell | $9.40 | 30 October 2025 |
| Macquarie | Neutral | $10.00 | 20 February 2026 |
| Morgans Financial | Add | $11.00 | 12 February 2026 |
| Ord Minnett | Accumulate | $11.20 | 18 November 2025 |
| Morningstar | Hold (Fair Value) | $11.50 | 5 March 2026 |
$9.40 to $11.50: the spread alone tells you this stock is genuinely contested.
UBS maintained its Sell rating in October 2025, citing structural margin pressure and deposit competition. At the other end, Morningstar assessed BEN as modestly undervalued relative to its $11.50 fair value estimate as recently as March 2026. The range reflects a real disagreement about whether BEN’s discount to the sector is a feature or a flaw.
Banks are unusual valuation subjects. Their earnings are relatively stable compared to growth companies, their payout ratios are explicit, and their dividends form a substantial portion of total shareholder return. This makes dividend-based models, such as the Dividend Discount Model, a natural fit. A bank paying 70-75% of cash earnings as dividends provides a clear, observable cash flow to model against.
The P/E comparable method, by contrast, introduces a judgment call that is particularly consequential for regional banks. The Australian banking sector’s average forward P/E of approximately 17-18x (with CBA trading above 19x at times in early 2026) is heavily influenced by the four major banks. Their scale, diversified franchises, and higher return on equity justify that premium.
Regional banks trade at a structurally lower multiple, approximately 11-13x on a forward basis. Analysts cite several reasons for this persistent gap:
According to Morningstar, comparing regional banks to majors on headline P/E or yield “is misleading” without adjusting for risk and growth differences.
Morningstar primarily values BEN using a discounted cash flow/excess returns model, treating the DDM as a useful secondary lens for income investors. The P/E gap between regionals and majors is described by analysts as structurally persistent rather than a cyclical anomaly that investors should expect to close.
The structural profitability gap between ASX regional banks and the Big Four is measurable across three core metrics, net interest margin, return on equity, and CET1 capital efficiency, and it is this gap, rather than any temporary earnings shortfall, that anchors the persistent discount regional banks trade at relative to the sector average P/E.
Understanding this structural discount is the single most important concept for interpreting the P/E valuation result that follows.
The mechanics are straightforward:
Using the sector average P/E of 18x, the calculation produces $0.87 x 18 = $15.77 per share, a figure that implies roughly 50% upside from the current trading range.
That number deserves immediate qualification. Applying the full sector average multiple to a regional bank means assuming BEN warrants the same earnings premium as CBA, NAB, ANZ, and Westpac. Given the structural differences outlined above, this is a stretch.
The more revealing exercise is running the same calculation at different multiples to see where the output lands relative to reality.
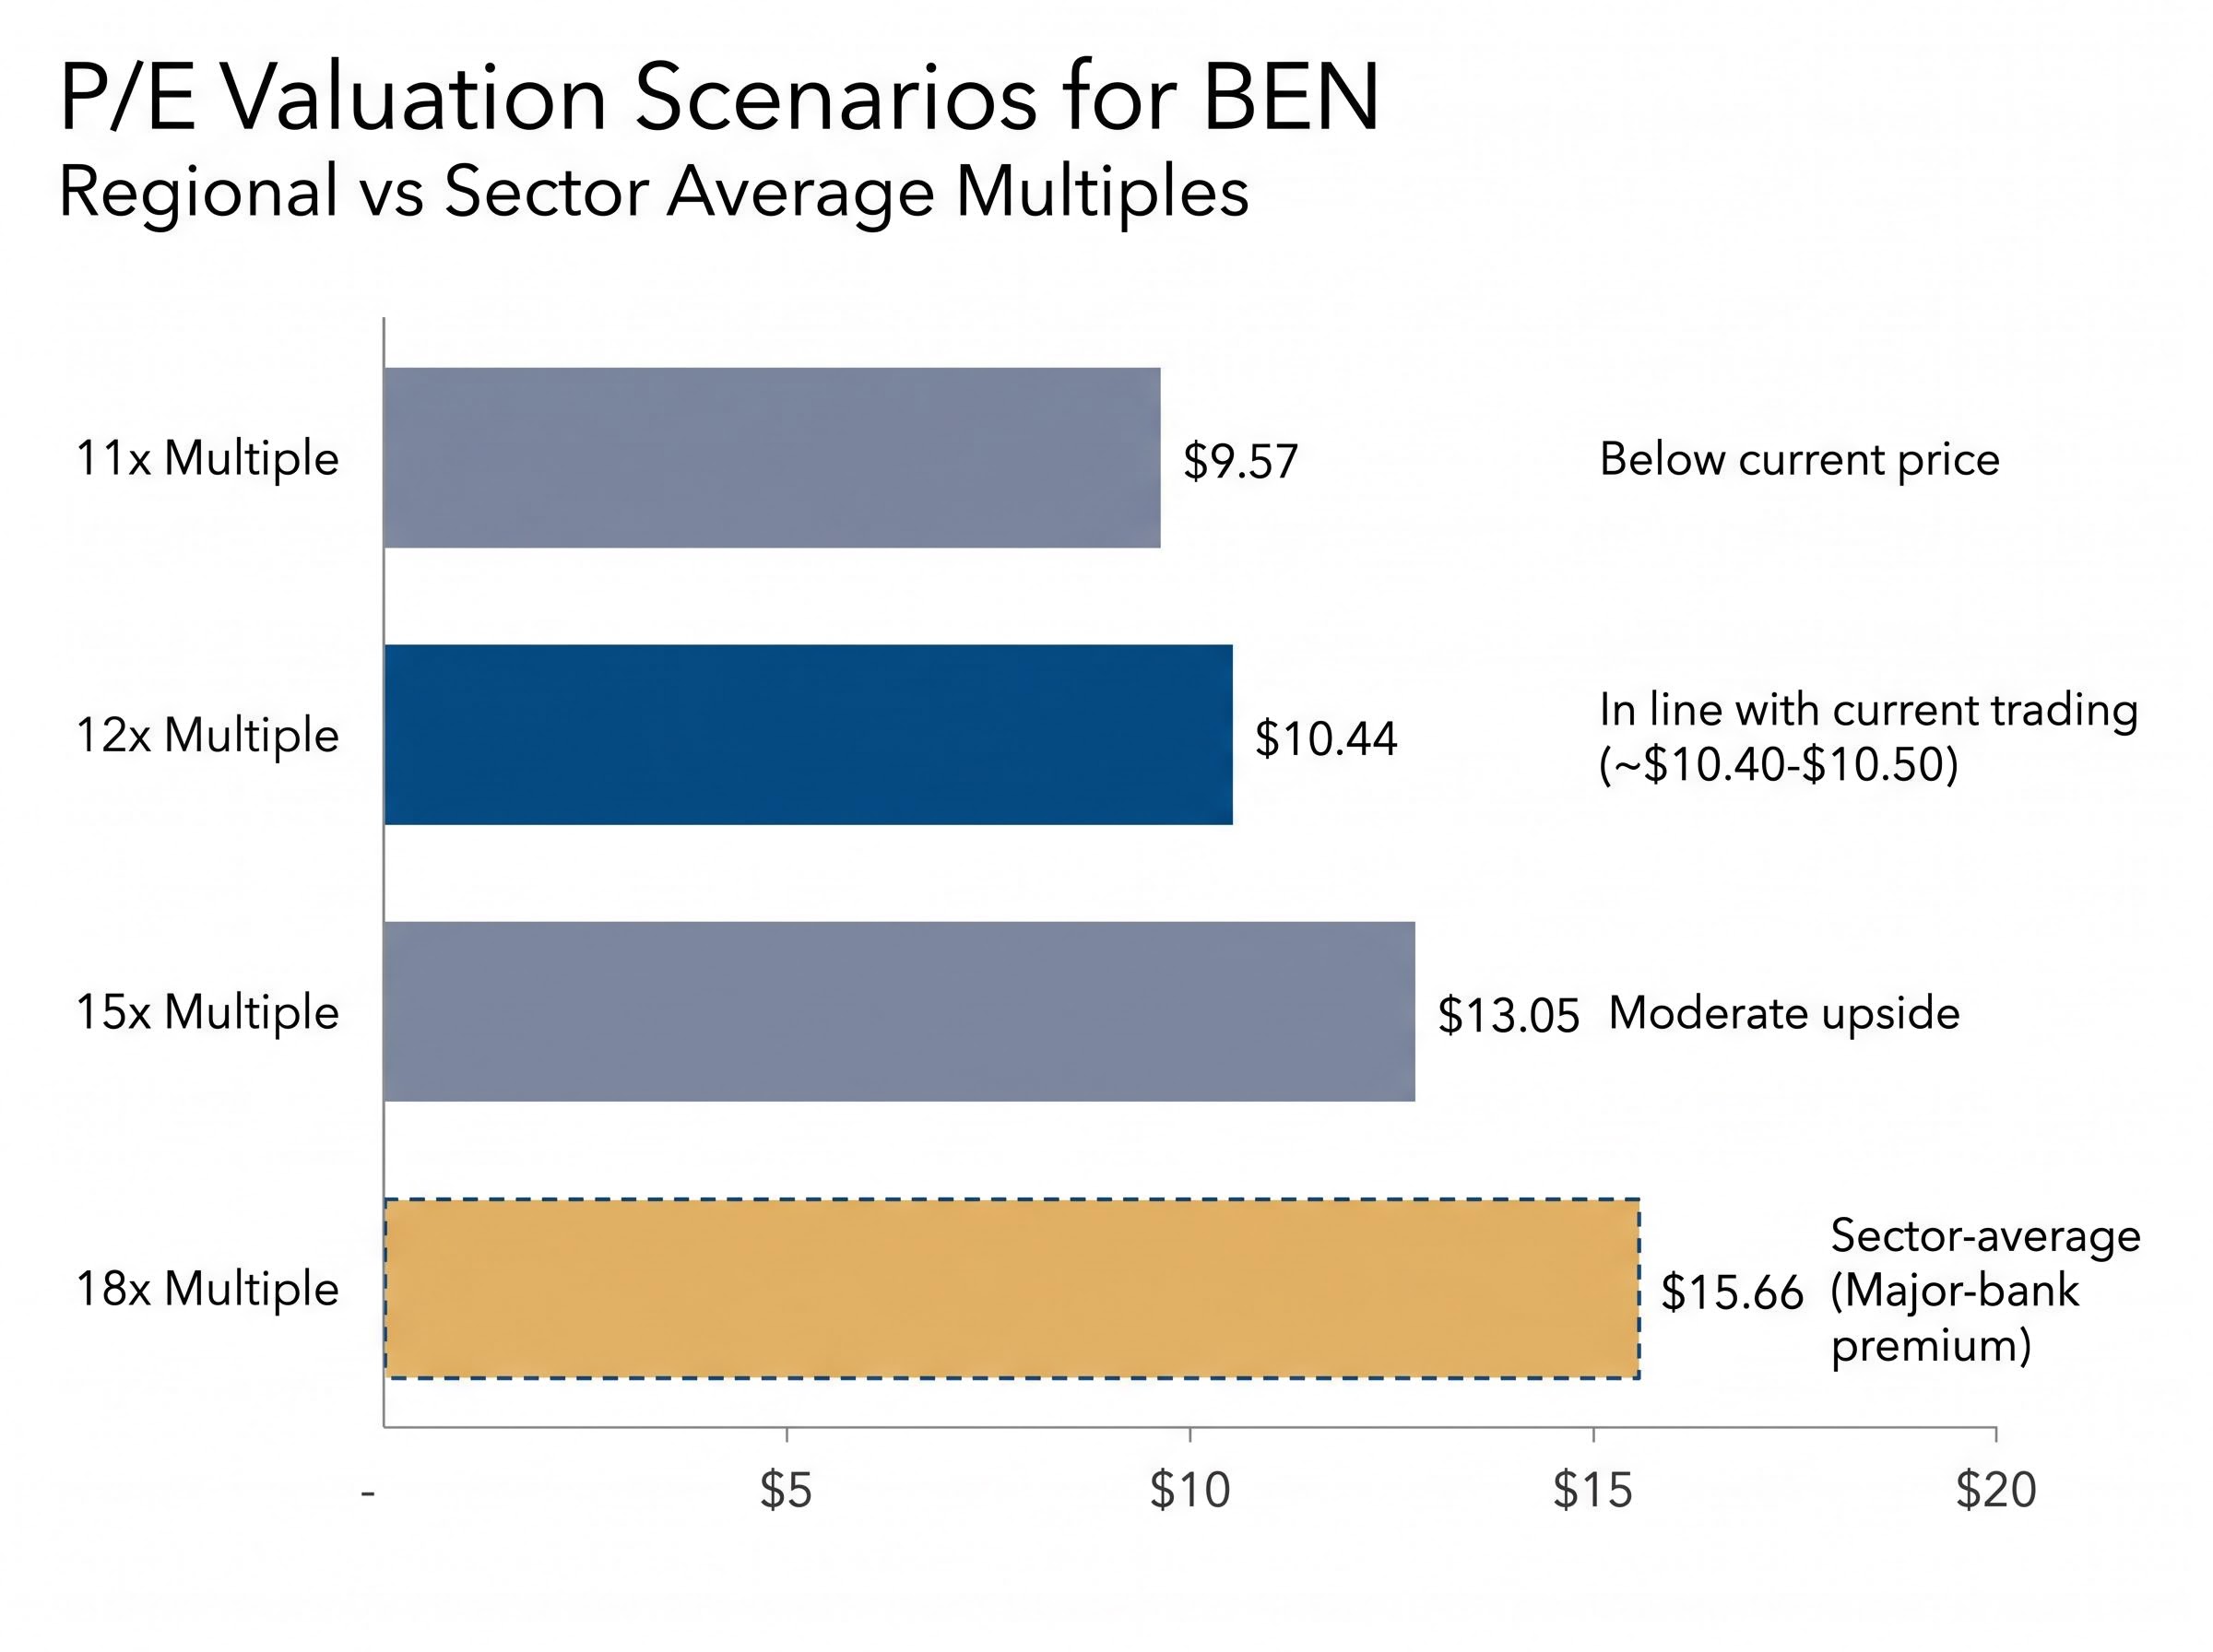
| P/E Multiple Applied | Implied Valuation | Interpretation |
|---|---|---|
| 11x | $9.57 | Below current price; implies overvaluation |
| 12x | $10.44 | Approximately in line with current trading |
| 15x | $13.05 | Moderate upside; requires partial re-rating |
| 18x | $15.66 | Sector-average multiple; assumes major-bank premium |
At the regional peer midpoint of 12x, the P/E method produces approximately $10.44, almost exactly where the stock trades today. The market, in other words, is already pricing BEN at its regional peer multiple. The $15.77 estimate is a ceiling that requires the structural discount to disappear, not a target the stock is likely to drift toward on its own.
DDM Formula: Share Price = Annual Dividend / (Required Return Rate minus Dividend Growth Rate)
The dividend discount model mechanics that make this method so sensitive to assumption changes are rooted in the Gordon Growth Model formula, where a one-percentage-point shift in either the required return or the growth rate can produce valuation swings of 30-50% on a stable dividend payer like BEN.
The DDM values a stock based on the present value of its future dividends. The required return rate represents the minimum annual return an investor demands for holding the stock. The dividend growth rate represents how quickly dividends are expected to grow over time. A small change in either variable produces a large change in the output.
Using BEN’s FY24 annual dividend of $0.63 per share, with blended assumptions for required return between 6% and 11% and dividend growth between 2% and 4%, the model produces an average valuation of approximately $13.32 per share. Adjusting for the slightly higher 1H FY25 dividend run-rate (an annualised $0.65), the estimate edges to approximately $13.75.
The sensitivity range is wide. At the most conservative inputs (11% required return, 2% growth), the DDM produces just $7.22. At the most optimistic (6% required return, 4% growth), it reaches $32.50. Neither extreme is particularly useful. The range in between is where real investor decisions live.
| Required Return | 2% Growth | 3% Growth | 4% Growth |
|---|---|---|---|
| 6% | $15.75 | $21.00 | $31.50 |
| 8% | $10.50 | $12.60 | $15.75 |
| 10% | $7.88 | $9.00 | $10.50 |
| 11% | $7.00 | $7.88 | $9.00 |
The table makes the analytical point clearly: the DDM is not a single number but a range shaped entirely by the assumptions an investor brings to it.
BEN’s dividends are fully franked, meaning the company has already paid corporate tax on the earnings distributed. For eligible Australian resident taxpayers and superannuation funds, franking credits effectively gross up the dividend. BEN’s $0.63 per share becomes a gross dividend of approximately $0.93 when the franking credit (at a 30% corporate tax rate) is included.
Plugging the gross dividend into the DDM lifts the valuation estimate to approximately $19.64 per share.
This figure is not a universal fair value. It is relevant only to investors who can fully utilise franking credits. A non-resident investor, or an entity that cannot claim the credit, should use the pre-franking base case. The distinction matters, and conflating the two figures overstates the stock’s attractiveness to a significant portion of the market.
Both valuation models rest on assumptions about dividend sustainability and earnings stability. Those assumptions are shaped by the current macroeconomic environment, and the picture is mixed.
APRA’s unquestionably strong capital framework sets the CET1 benchmarks that all ADIs must maintain, with the 10.5% floor for major banks and an adjusted target for standardised banks like BEN, making capital adequacy a hard constraint on dividend policy rather than a discretionary management choice.
The RBA’s “narrow path” commentary, balancing inflation control against economic growth, is frequently cited by analysts as a reason bank provisioning levels could rise even without a recession.
Loan loss provisioning across the major banks increased by approximately $800 million in the most recent reporting season, a precautionary build that reflects management expectations of future credit stress even as observed arrears remain low, and the same dynamic applies to BEN’s regional mortgage book where a localised softening could accelerate provisioning requirements faster than sector-level data would indicate.
None of these indicators signal imminent risk to BEN’s dividend. Equally, none suggest the kind of earnings acceleration that would justify the upper end of the DDM range.
When the P/E multiple is calibrated to regional peers (11-12x) rather than the sector average (18x), the P/E method produces approximately $10.44. The DDM base case, using the cash dividend of $0.63, produces approximately $13.32, extending to $13.75 with the slightly higher annualised dividend run-rate.
Both methods, applied with appropriate regional bank adjustments, converge toward a valuation range of approximately $10.44-$13.75 per share. The wider range of $10.44-$19.64 only applies if the franking-adjusted gross dividend is used, and even then only for investors who can fully capture that credit.
The current share price of approximately $10.40-$10.50 sits at or just below the lower bound of even the conservative range. The stock is not obviously expensive. It is also not offering a dramatic margin of safety; the models do not suggest BEN is deeply undervalued unless an investor applies an optimistic set of growth assumptions or values the full franking credit benefit.
The broker consensus range of $9.40-$11.50 aligns broadly with the conservative end of the model outputs, reinforcing that the market is pricing BEN within the zone both methods suggest when calibrated for a regional bank’s structural position.
Quantitative valuation is a starting point, not a complete analysis. Three questions sit beyond what either method can answer:
These are not optional extras. They are the qualitative layer that determines whether the quantitative range is reliable or misleading.
Two valuation methodologies, applied with appropriate regional bank calibrations, produce estimates suggesting Bendigo and Adelaide Bank is not wildly overpriced at current levels. The peer-calibrated P/E method lands almost exactly at the current share price. The DDM base case suggests modest upside to the $13.32-$13.75 range.
The franking-credit-adjusted DDM estimate of $19.64 is a personalised number for investors who can fully utilise those credits. It is not a universal fair value, and readers should be clear about which category they fall into before anchoring to that figure.
BEN’s current pricing reflects the structural discount the market applies to regional banks. Any re-rating toward the broader sector average would require a specific catalyst, whether that is a step-change in scale, a net interest margin surprise, or a broader sector rotation toward yield. Time in the market alone is unlikely to close the gap.
For investors who have worked through the valuation range and are now deciding whether the potential upside justifies holding BEN over a passive alternative, our full explainer on choosing between BEN and a low-cost ETF applies a four-step framework covering time horizon, monitoring capacity, NIM conviction, and regulatory risk tolerance to help readers reach a considered position at current prices.
This article is for informational purposes only and should not be considered financial advice. Investors should conduct their own research and consult with financial professionals before making investment decisions. Past performance does not guarantee future results. Financial projections are subject to market conditions and various risk factors.
The Dividend Discount Model values a stock by calculating the present value of all future dividends. Applied to Bendigo and Adelaide Bank using its FY24 annual dividend of $0.63 per share, the base case produces an estimate of approximately $13.32, rising to $19.64 when franking credits are included for eligible Australian investors.
Regional banks like BEN trade at a structurally lower multiple of around 11-13x compared to the sector average of 17-18x because of smaller scale, narrower product sets, more concentrated geographic exposure, and lower return on equity relative to CBA, NAB, ANZ, and Westpac.
Because BEN pays fully franked dividends, eligible Australian resident investors and superannuation funds can gross up the $0.63 annual dividend to approximately $0.93 when the 30% corporate tax credit is included, which lifts the DDM valuation estimate from around $13.32 to approximately $19.64 per share.
Broker price targets for BEN range from $9.40 (UBS, Sell) to $11.50 (Morningstar, Hold), with Morgans Financial at $11.00 (Add) and Ord Minnett at $11.20 (Accumulate), reflecting genuine disagreement about whether the stock's discount to the sector is justified.
Key factors include the RBA cash rate holding at 4.35%, unemployment at 4.3% (historically low and supportive of mortgage arrears), and national home values rising approximately 5% over 12 months to April 2026, all of which support dividend maintenance but do not signal the earnings acceleration needed to justify the upper end of DDM estimates.