
Why Most Wealth-Building Strategies Aren’t Built for You
3 hrs ago
Most investors know they should buy “quality” companies. Few can define what quality looks like on a balance sheet. Reece Ltd (ASX: REH), Australia’s dominant plumbing and bathroom products distributor with over a century of domestic operations, offers a rare teaching opportunity: a genuinely mature blue-chip with publicly available, verified metrics that sit precisely where benchmark guidance says they should. With Australian interest rates higher than they were through most of the 2010s, the metrics that matter most when valuing blue chip stocks have shifted. Debt levels, income reliability, and capital efficiency now carry more weight than growth projections for established businesses. This guide uses Reece as a concrete worked example to explain the three metrics most useful for assessing mature ASX companies: debt-to-equity ratio, long-run average dividend yield, and return on equity. Readers will leave with a reusable framework they can apply to any comparable blue-chip on the ASX.
Reece reported revenue of $8,978 million in FY25, down 1% on FY24, with EBIT falling 20% and earnings per share declining 24%. Through a growth lens, that looks alarming. Through a quality lens, it looks like a soft year for a century-old distributor that still generates above-benchmark returns on capital.
The mismatch is not accidental. Metrics like revenue growth rate and price-to-earnings expansion are designed for businesses still scaling. They apply poorly to companies whose primary value lies in capital efficiency and income reliability. A mature blue-chip is not a growth stock. It is a compounder: a business that does the same thing very well, decade after decade, at high returns on the capital deployed. Morgan Stanley characterised Reece’s valuation as “full but justified by quality and execution,” a framing that only makes sense if quality, rather than growth, is the evaluation standard.
Investors new to equity screening often encounter fundamental analysis metrics such as P/E ratio, earnings per share, and revenue growth before they encounter ROE, which makes the transition to quality-focused evaluation of mature businesses feel more like a shift in framework than an incremental step.
The appropriate toolkit for a business like Reece is built around three metrics:
Each of the following sections defines one metric, benchmarks it against published Australian guidance, and applies it directly to Reece’s reported figures.
Debt-to-equity ratio measures how much of a business is funded by borrowing versus owner capital. The calculation is straightforward: total debt divided by shareholders’ equity, expressed as a percentage. A D/E of 50% means the company carries fifty cents of debt for every dollar of equity.
The metric matters more in a higher-rate environment. Rising interest costs compress margins faster for leveraged businesses, and tighter bank covenants reduce operational flexibility for heavily geared companies. Livewire Markets commentary from 2024 emphasised that higher leverage raises a company’s weighted average cost of capital (WACC) more sharply when rates are elevated, compressing intrinsic value. An AFR article on Metcash’s June 2024 result described balance sheet discipline as “a valuation support” in precisely this environment.
The ASX interest rate market highlights for Q4 2025 document rising short-term rates and higher funding costs across the Australian market, conditions that directly increase the weighted average cost of capital for leveraged companies and compress intrinsic value multiples for businesses carrying above-benchmark debt loads.
For mature ASX industrials and distributors, the published benchmarks cluster around a clear comfort zone.
“We like to see debt levels we can sleep at night with, often that means D/E comfortably under 60% for non-financial blue-chips.” — Rask Education
| Source / Benchmark | D/E Threshold |
|---|---|
| Rask “comfort zone” for mature industrials | Below 50-60% |
| Motley Fool “high gearing” flag for mature industrials | Above 100% |
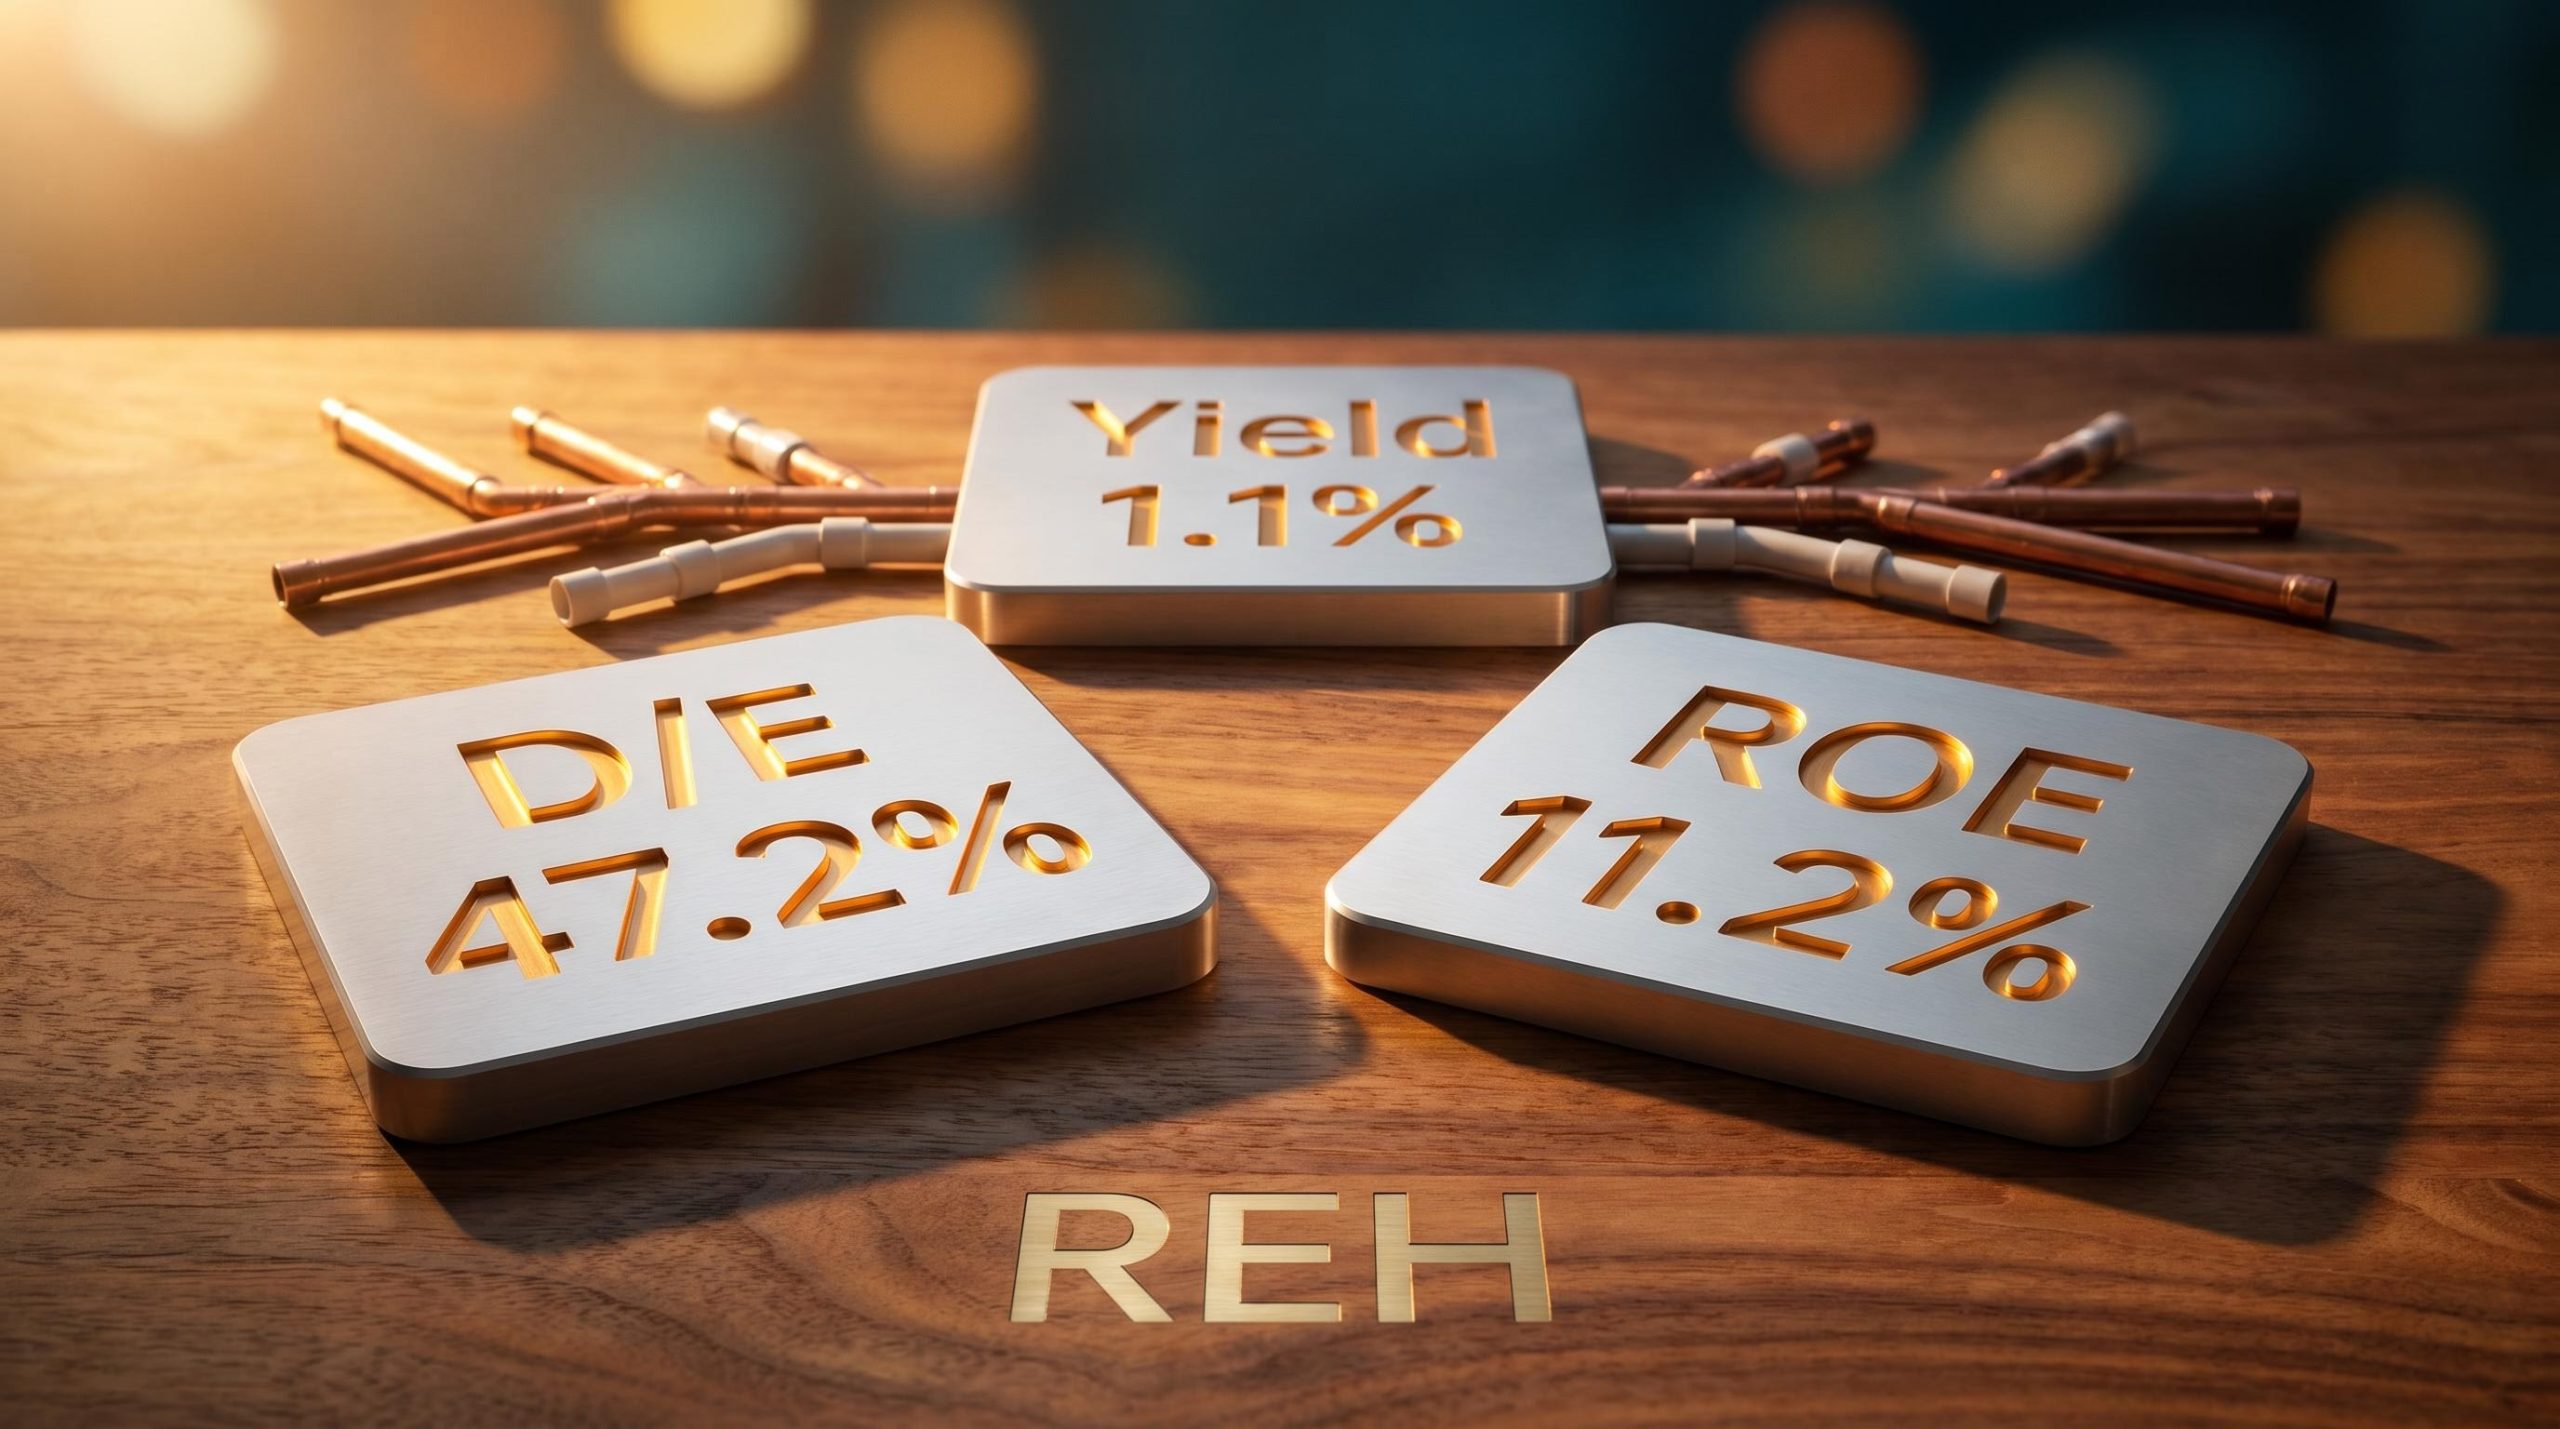
| Reece Ltd (FY24 actual) | 47.2% |
Reece’s 47.2% D/E ratio (reported by Rask Media, May 2026) sits inside the comfort zone. That positioning does not just signal safety. In the post-rate-hike environment, lower leverage supports valuation multiples because it means a lower cost of capital and less earnings volatility, exactly the attributes fund managers indicated they are willing to pay higher multiples for.
Return on equity answers a simple question: for every dollar of equity capital retained in the business, how many cents of profit does the company generate? The formula is net profit divided by shareholders’ equity. An ROE of 11% means the business produces roughly eleven cents of profit for each dollar of equity.
The benchmark hierarchy is well established in Australian investor education. Rask Education labels ROE above 10% as “good” for a mature company and above 15% as “excellent.” Motley Fool Australia targets double-digit ROE as the minimum standard, while describing sub-8% ROE as unimpressive for non-regulated industrials. Livewire Markets fund manager contributors use 15%+ ROE as shorthand for “high quality” when screening for compounders.
Peer-reviewed research on ROE as a portfolio performance predictor finds that portfolios constructed around sustained high return on equity generate positive abnormal returns over time, providing an empirical basis for using double-digit ROE as a quality screen rather than simply a historical accounting measure.
“Double-digit ROE is what we want to see, and the higher the better, so long as it isn’t all driven by debt.” — Motley Fool Australia
| ROE Tier | Label | Example Companies |
|---|---|---|
| Below 8% | Unimpressive | Sub-benchmark non-regulated industrials |
| 10-15% | Good | Reece (11.2%), mature industrials |
| 15%+ | Excellent | REA Group (18.9%), high-quality compounders |
Reece’s 11.2% ROE (FY24, per Rask Media, May 2026) places it solidly in the “good” category for a capital-intensive distributor. It sits above the 10% floor and below the 15% ceiling, which is exactly where a well-run, mature industrial should land.
One caveat requires attention. Very high ROE can be partly driven by high leverage, because less equity in the denominator inflates the ratio. This is precisely why the D/E ratio context from the previous section matters: Reece’s moderate 47.2% D/E confirms the efficiency is genuine rather than a product of aggressive gearing. CBA offers a useful contrast, delivering mid-teens ROE with a 4-5% fully franked yield (per Livewire Markets, May 2024), demonstrating that the same metric can produce different profiles depending on business model and leverage.
The same three-metric framework applied to Coles and Brambles illustrates how a compressed equity base from high leverage can inflate ROE figures in ways that would not be visible from the ratio alone, a dynamic that makes the D/E cross-check essential for any blue-chip assessment.
Dividend yield is the metric most frequently misread by Australian retail investors. The instinct is straightforward: higher yield equals better income. For mature blue-chips, that instinct produces two distinct errors.
The first error is dismissing low-yield compounders. A company like Reece, with a five-year average annual dividend yield of just 1.1% (Rask Media, May 2026) and a final fully franked dividend of 11.86 cents per share in FY25, looks unappealing next to a bank yielding 4-5%. The second error is chasing yield without context. Motley Fool Australia flags yields above 6-7% as a red flag for income stocks, because unsustainably high payouts often precede dividend cuts.
The distinction that resolves both errors is between two yield-reading frameworks:
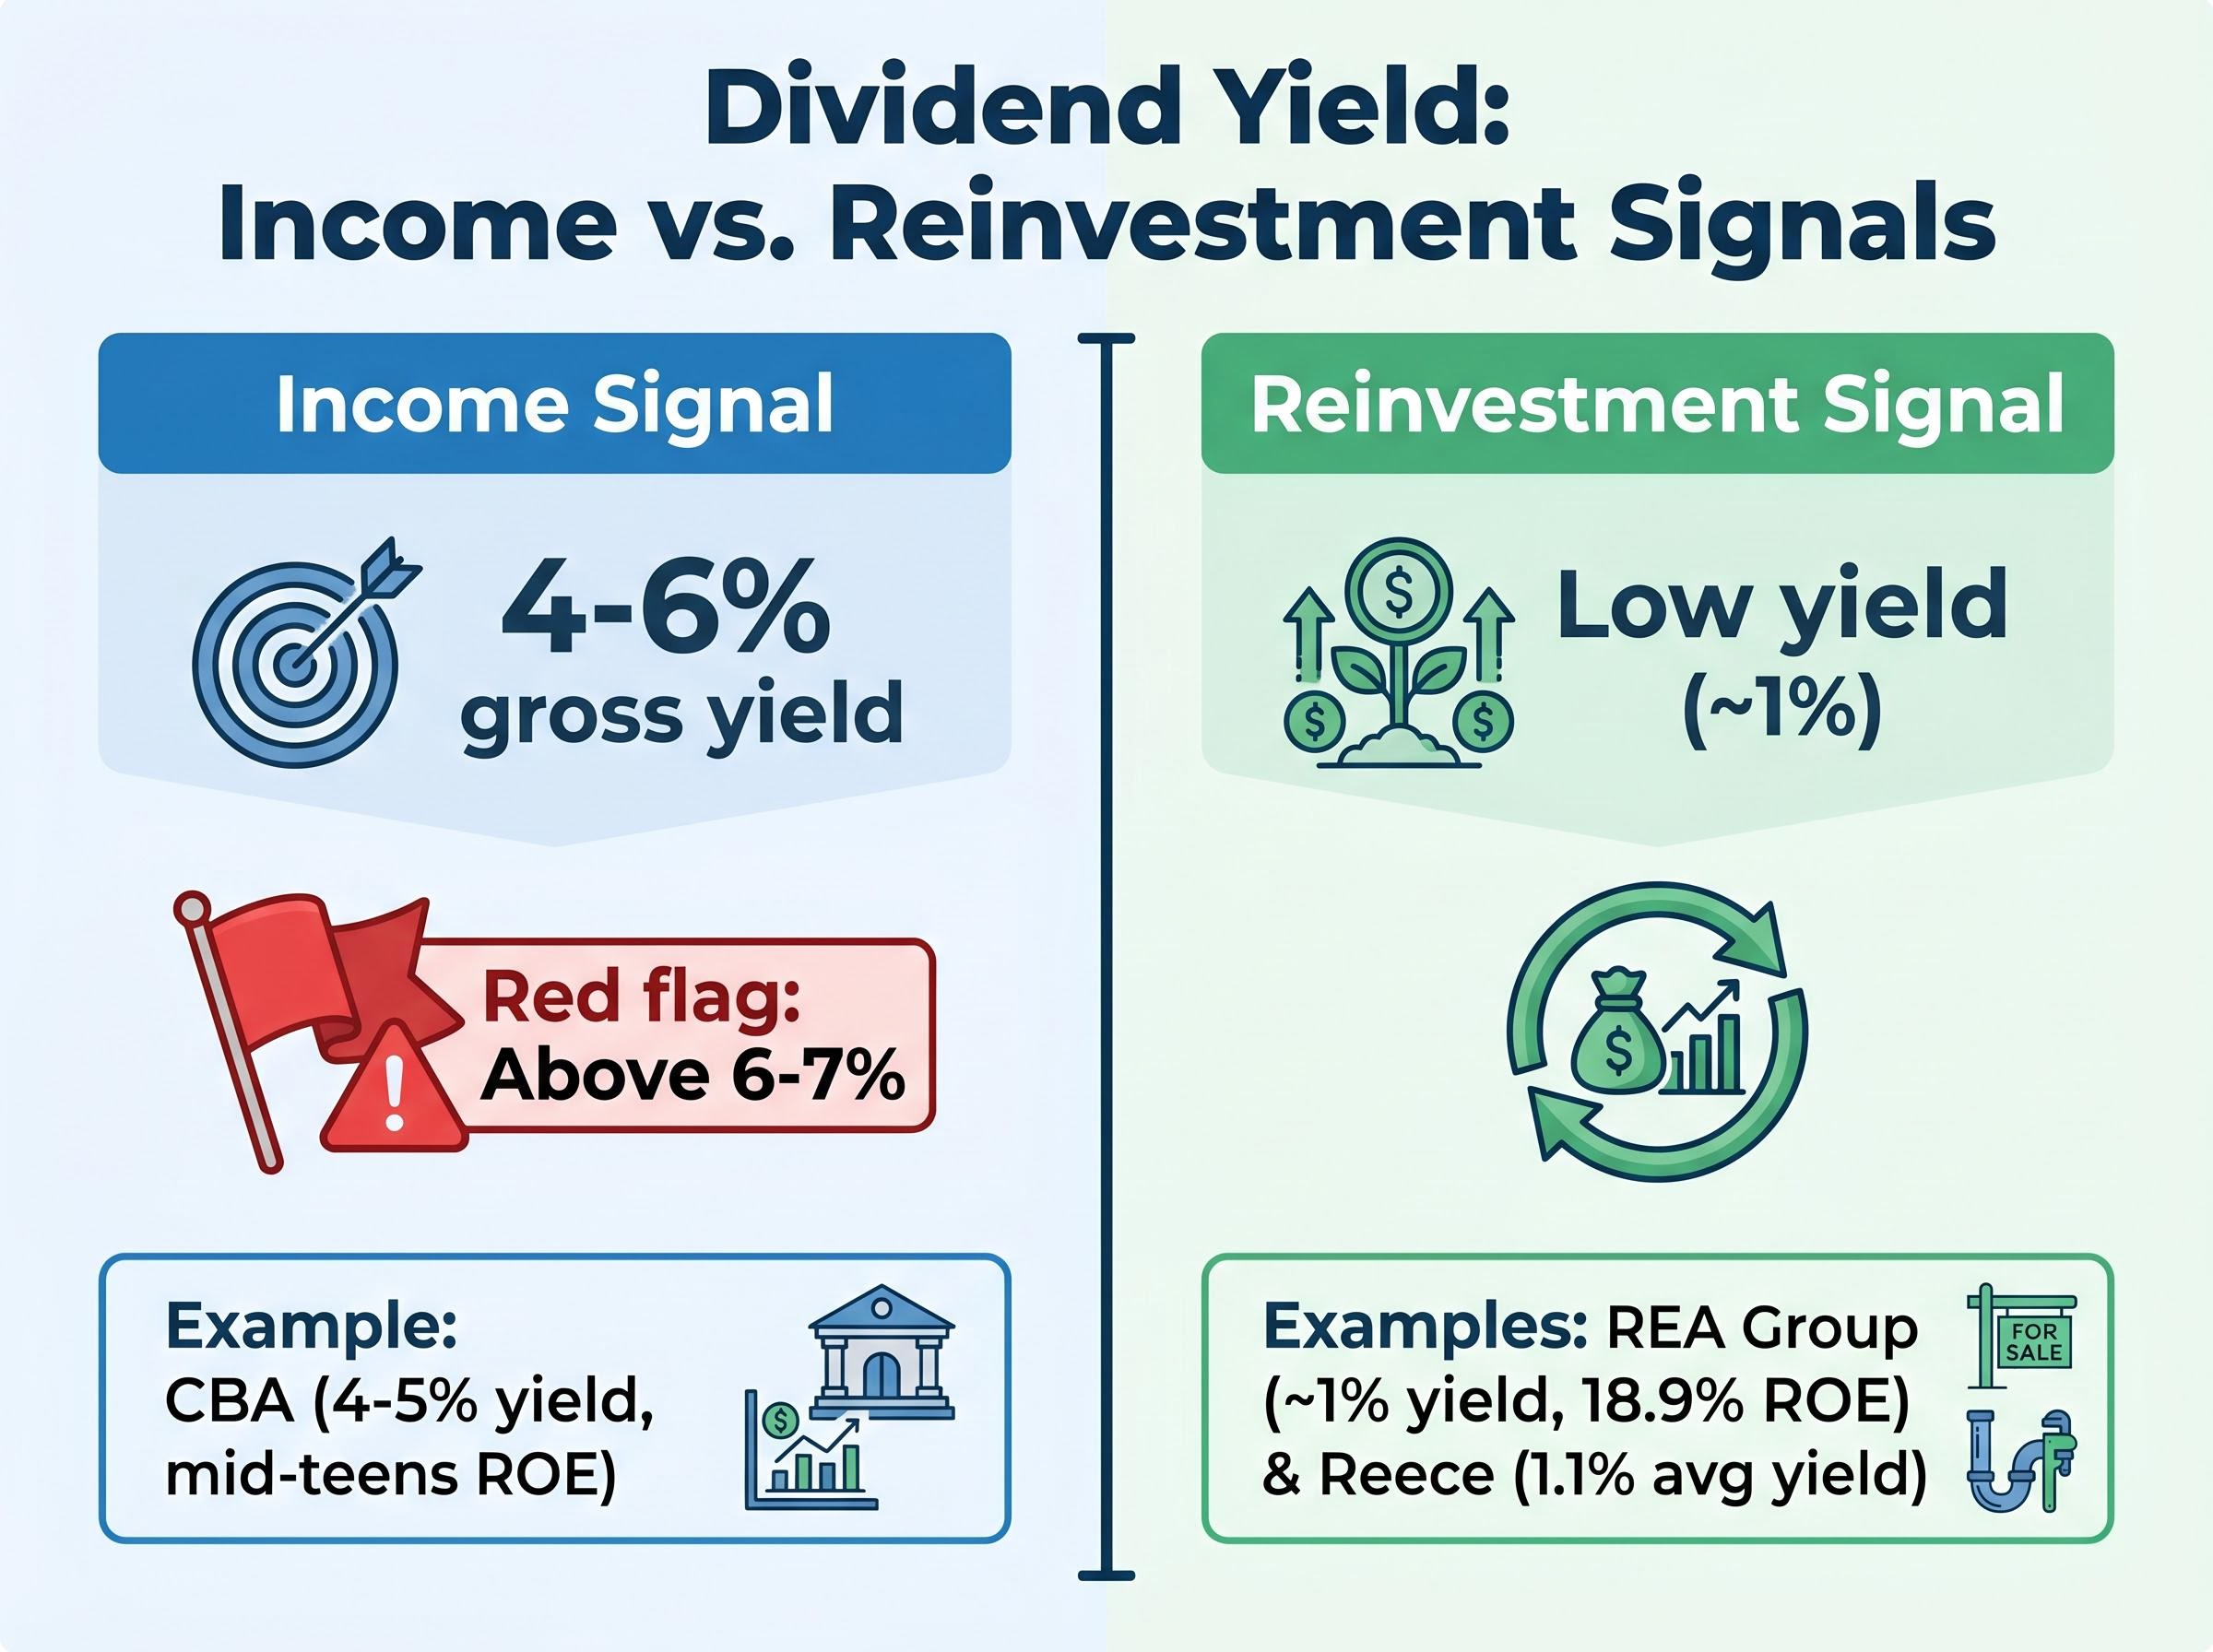
Rask characterises Reece as a “low-yield, reinvestment-focused compounder,” and Morgan Stanley highlighted the low dividend payout relative to free cash flow as consistent with a growth-led capital allocation strategy.
For Australian investors, the cash yield understates the actual income return on fully franked dividends. Franking credits represent tax already paid at the corporate level, and they effectively increase the dividend’s value to shareholders. To gross up a cash yield, divide it by 0.7 (for a 30% corporate tax rate). Reece’s fully franked dividends mean the effective income return is higher than the cash yield alone, even if still modest by income-stock standards.
Morningstar data (referenced in the AFR, May 2024) places the S&P/ASX 200 market gross yield at approximately 4%. Reece sits well below that figure, but in the context of its reinvestment-led strategy and above-threshold ROE, that positioning is a deliberate choice rather than a shortcoming.
The three metrics are more useful together than in isolation. Applied to Reece as a single scorecard, they produce a coherent profile.
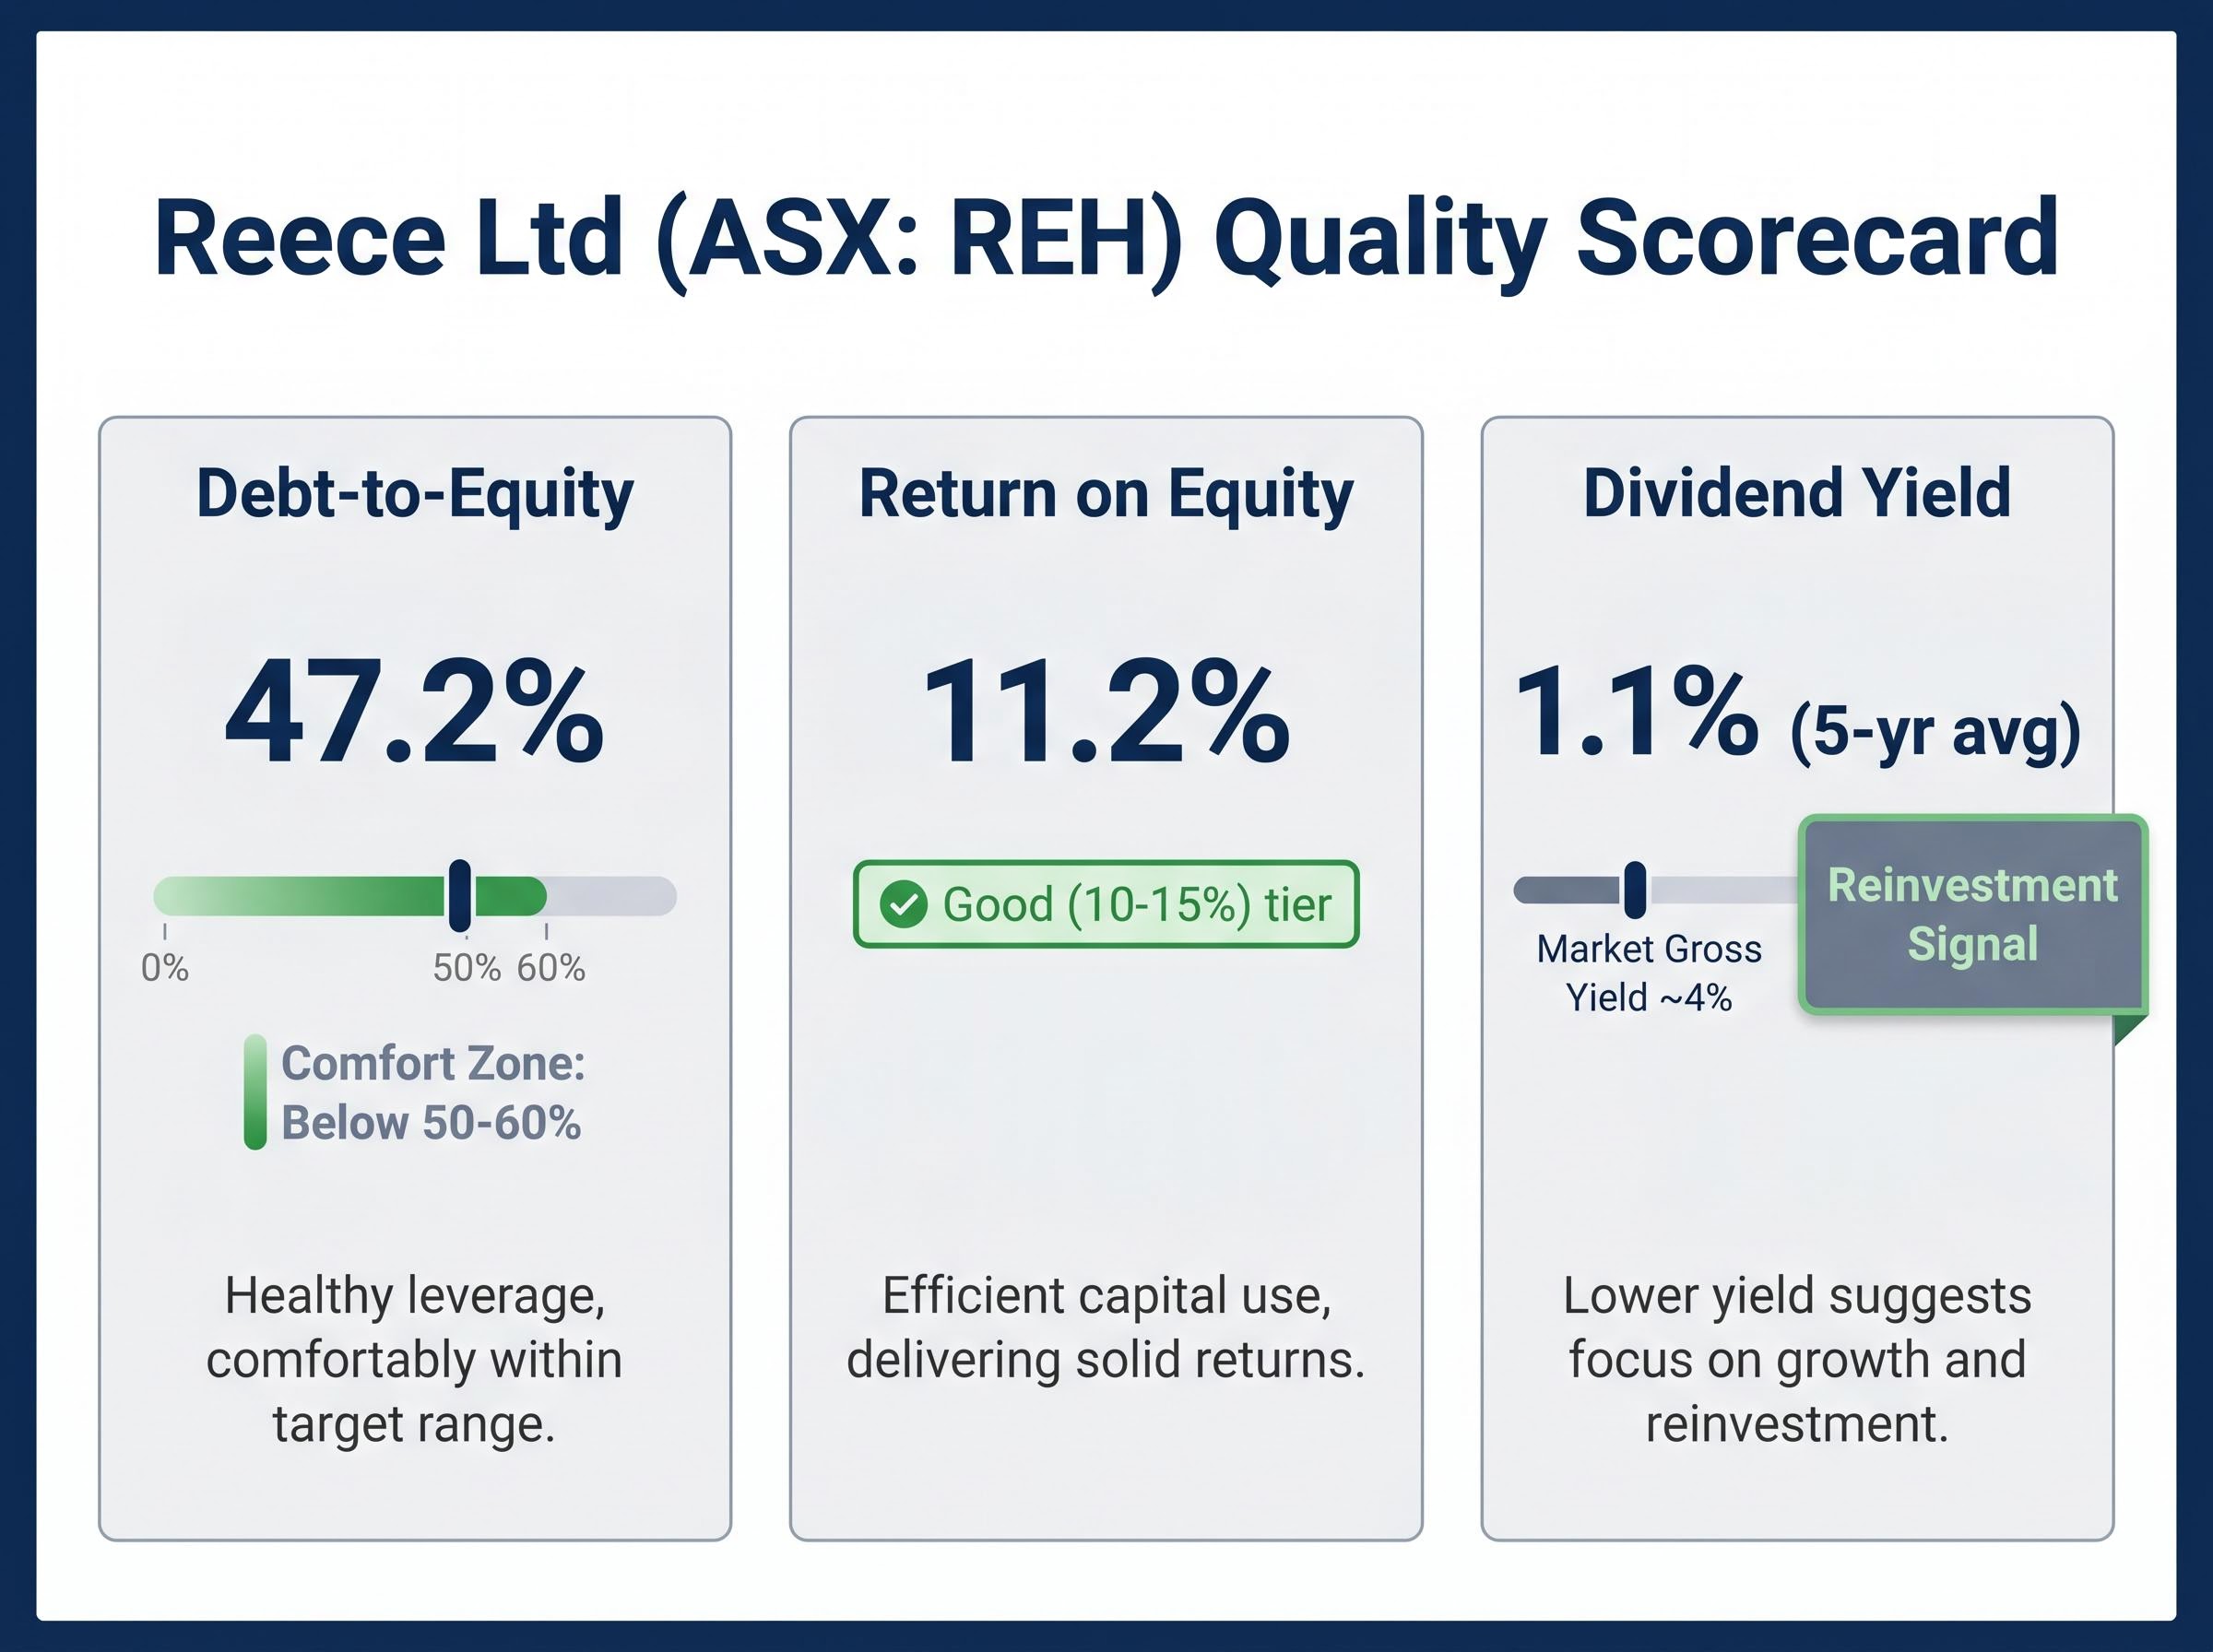
D/E of 47.2% sits within the benchmark comfort zone for a mature industrial, confirming conservative funding. Five-year average yield of 1.1% is low, but consistent with a reinvestment-led capital allocation strategy where retained earnings are deployed into network expansion and the North American business. ROE of 11.2% clears the 10% “good” threshold, confirming above-benchmark capital efficiency without relying on excessive leverage to inflate the figure.
The three metrics reinforce each other. A company could post high ROE partly through leverage, but Reece’s moderate D/E confirms the efficiency is genuine. The low yield is not a deficiency but a strategic posture supported by above-threshold ROE. When Rask Media describes Reece as a “low-yield, reinvestment-focused compounder,” that characterisation is visible in all three metrics simultaneously.
The same scorecard applied to different business types produces different but equally coherent profiles.
| Company | Yield Profile | ROE Profile | D/E Profile | Type |
|---|---|---|---|---|
| Reece | Low (~1%) | Good (11.2%) | Conservative (47.2%) | Reinvestment compounder |
| CSL | Low | High | Moderate | Growth compounder |
| REA Group | Low | High (18.9%) | Low | High-ROE compounder |
| Wesfarmers | Moderate | Solid | Moderate | Diversified industrial |
| CBA | High | Mid-teens | Higher (bank) | Income blue-chip |
Note: Yield, ROE, and D/E profiles for CSL, Wesfarmers, and CBA are presented directionally rather than as precise verified figures. Reece and REA Group figures are sourced from Rask Media (May 2026).
The power of the framework is that it produces a consistent, comparable profile across very different businesses. Once a reader can score Reece, they can score any mature ASX blue-chip using the same three questions.
The same three-question scorecard produces a coherent but distinctly different profile when applied to an insurance business: blue-chip analysis applied to QBE reveals a 27.0% D/E ratio paired with a 19.8% adjusted ROE, a combination that reflects the structural characteristics of global insurance underwriting rather than industrial distribution.
The entire guide condenses into three questions an investor can ask when reviewing any stock profile on the ASX:
“These metrics represent a starting point rather than a comprehensive valuation, with broader context required for thorough share assessment.” — Rask Media
That limitation is worth emphasising. These three metrics are a starting point, not a complete valuation. They surface financial quality and capital efficiency, but they do not tell an investor whether a stock is cheap or expensive at its current price. Reece’s ongoing North American expansion, reflected in both its FY25 results and HY26 update (February 2026), illustrates that even a mature blue-chip assessed on these metrics may carry growth optionality that the framework does not capture. ASIC Moneysmart’s general guidance encourages investors to check debt levels as part of a broader assessment, a reminder that these concepts are consistent with mainstream financial literacy, not specialised screening techniques.
The framework travels. Apply the same three questions to any mature industrial, retailer, or distributor on the ASX, using publicly available data from company results and platforms like Rask, Morningstar, and Motley Fool.
The right evaluation toolkit for a mature blue-chip surfaces quality signals that remain stable regardless of short-term earnings movements. Conservative gearing, disciplined capital allocation, and above-threshold ROE were all visible in Reece’s metrics before, during, and after its FY25 soft result. A single-year earnings decline of 24% in EPS did not change the D/E ratio, the long-run yield profile, or the underlying capital efficiency of the business.
That stability is the point. Investors who apply this three-metric framework to one ASX blue-chip they already hold, or are watching, will find it surfaces the same consistent signals: the quality profile is visible before the price question is asked. The framework does not tell investors when to buy. It tells them what kind of business they are looking at, and that distinction is where the best investment decisions begin.
For readers wanting to move from quality screening to price assessment, our dedicated guide to ASX share valuation methods walks through DCF, EV/EBITDA, price-to-sales, and the dividend discount model in sequence, explaining how each method produces a different intrinsic value estimate and why combining them reduces the risk of a single-metric conviction error.
This article is for informational purposes only and should not be considered financial advice. Investors should conduct their own research and consult with financial professionals before making investment decisions.
Return on equity (ROE) measures how many cents of profit a business generates for each dollar of shareholders' equity. For mature ASX blue chips, a ROE above 10% is considered good and above 15% is considered excellent, making it a key indicator of capital efficiency.
For mature non-financial ASX industrials and distributors, a debt-to-equity ratio below 50-60% is generally considered conservative and within the benchmark comfort zone, according to guidance from sources like Rask Education and Motley Fool Australia.
A low dividend yield on a high-ROE compounder typically signals a deliberate reinvestment strategy rather than a deficiency, while a high yield on a business with declining earnings can signal an unsustainable payout. Context around ROE and capital allocation strategy determines which interpretation applies.
Franking credits represent tax already paid at the corporate level, and to calculate the gross yield on a fully franked dividend you divide the cash yield by 0.7, which means the effective income return is higher than the stated cash yield alone.
The three most useful metrics for assessing mature ASX blue chips are the debt-to-equity ratio (to assess balance sheet conservatism), long-run average dividend yield (to assess capital allocation strategy), and return on equity (to assess how efficiently the business uses shareholders' capital).


