Is NAB’s Dividend Worth Buying at a 6.5% Grossed-Up Yield?
37 mins ago

Commonwealth Bank of Australia (CBA) is trading at approximately A$165 with a trailing price-to-earnings ratio of roughly 26-27x, yet applying two of the most common valuation frameworks to its current data produces fair value estimates that range from as low as $52 to as high as $238. That spread is wide enough to raise a legitimate question: are quantitative models telling investors anything useful about CBA’s share price, or has the stock moved beyond what conventional analysis can explain?
CBA is consistently characterised by analysts and fund managers as the most expensive of Australia’s big four banks on every conventional metric. For Australian investors currently holding or evaluating the stock, the dilemma is real. The premium price may reflect a franchise of genuinely superior quality, or it may reflect a valuation that has run ahead of the fundamentals that support it.
What follows works through two quantitative frameworks, the PE ratio method and the Dividend Discount Model (DDM), using verified May 2026 data to show what each method concludes, where they agree, and why the gap between model output and live share price is the most important number to understand.
As of 21-22 May 2026, CBA shares trade at approximately A$164-165 on the ASX. The trailing PE sits at roughly 26.4-26.8x, a figure that places the bank in rarefied territory among Australian financials.
Trailing PE: approximately 26.4-26.8x (verified via Yahoo Finance, ASX, GuruFocus, and Market Index as of 21-22 May 2026)
On a forward basis, the PE compresses modestly to approximately 23.3-24.2x, reflecting consensus expectations for earnings growth in FY25 and FY26. That compression is real, but it does not close the gap to peer multiples. Even on forward earnings, CBA remains the most expensive of the big four by a material margin.
The big four bank sector momentum in 2026 has pushed valuations higher across the group, but the gains have not been evenly distributed: CBA’s price appreciation has materially outpaced the other three banks, widening an already large premium on a sector that itself trades above its historical average on most metrics.
At 26-27x trailing earnings, the market is already building in a quality franchise with durable earnings, a strong deposit base, and a technology lead. Every valuation model applied to CBA must either justify that assumption or challenge it. There is no neutral ground at this multiple.
CBA trades at a PE and price-to-book premium that analyst commentary consistently describes as “a wide margin” above ANZ, NAB, and Westpac. The specific peer multiples sit materially lower, though exact figures vary by source and date.
The consequence of this premium flows directly into yield. CBA offers the lowest cash dividend yield among the big four, not because it pays a lower absolute dividend, but because its share price is substantially higher. Income-focused investors receive more income per dollar invested from NAB and Westpac than from CBA, even after adjusting for full franking credits.
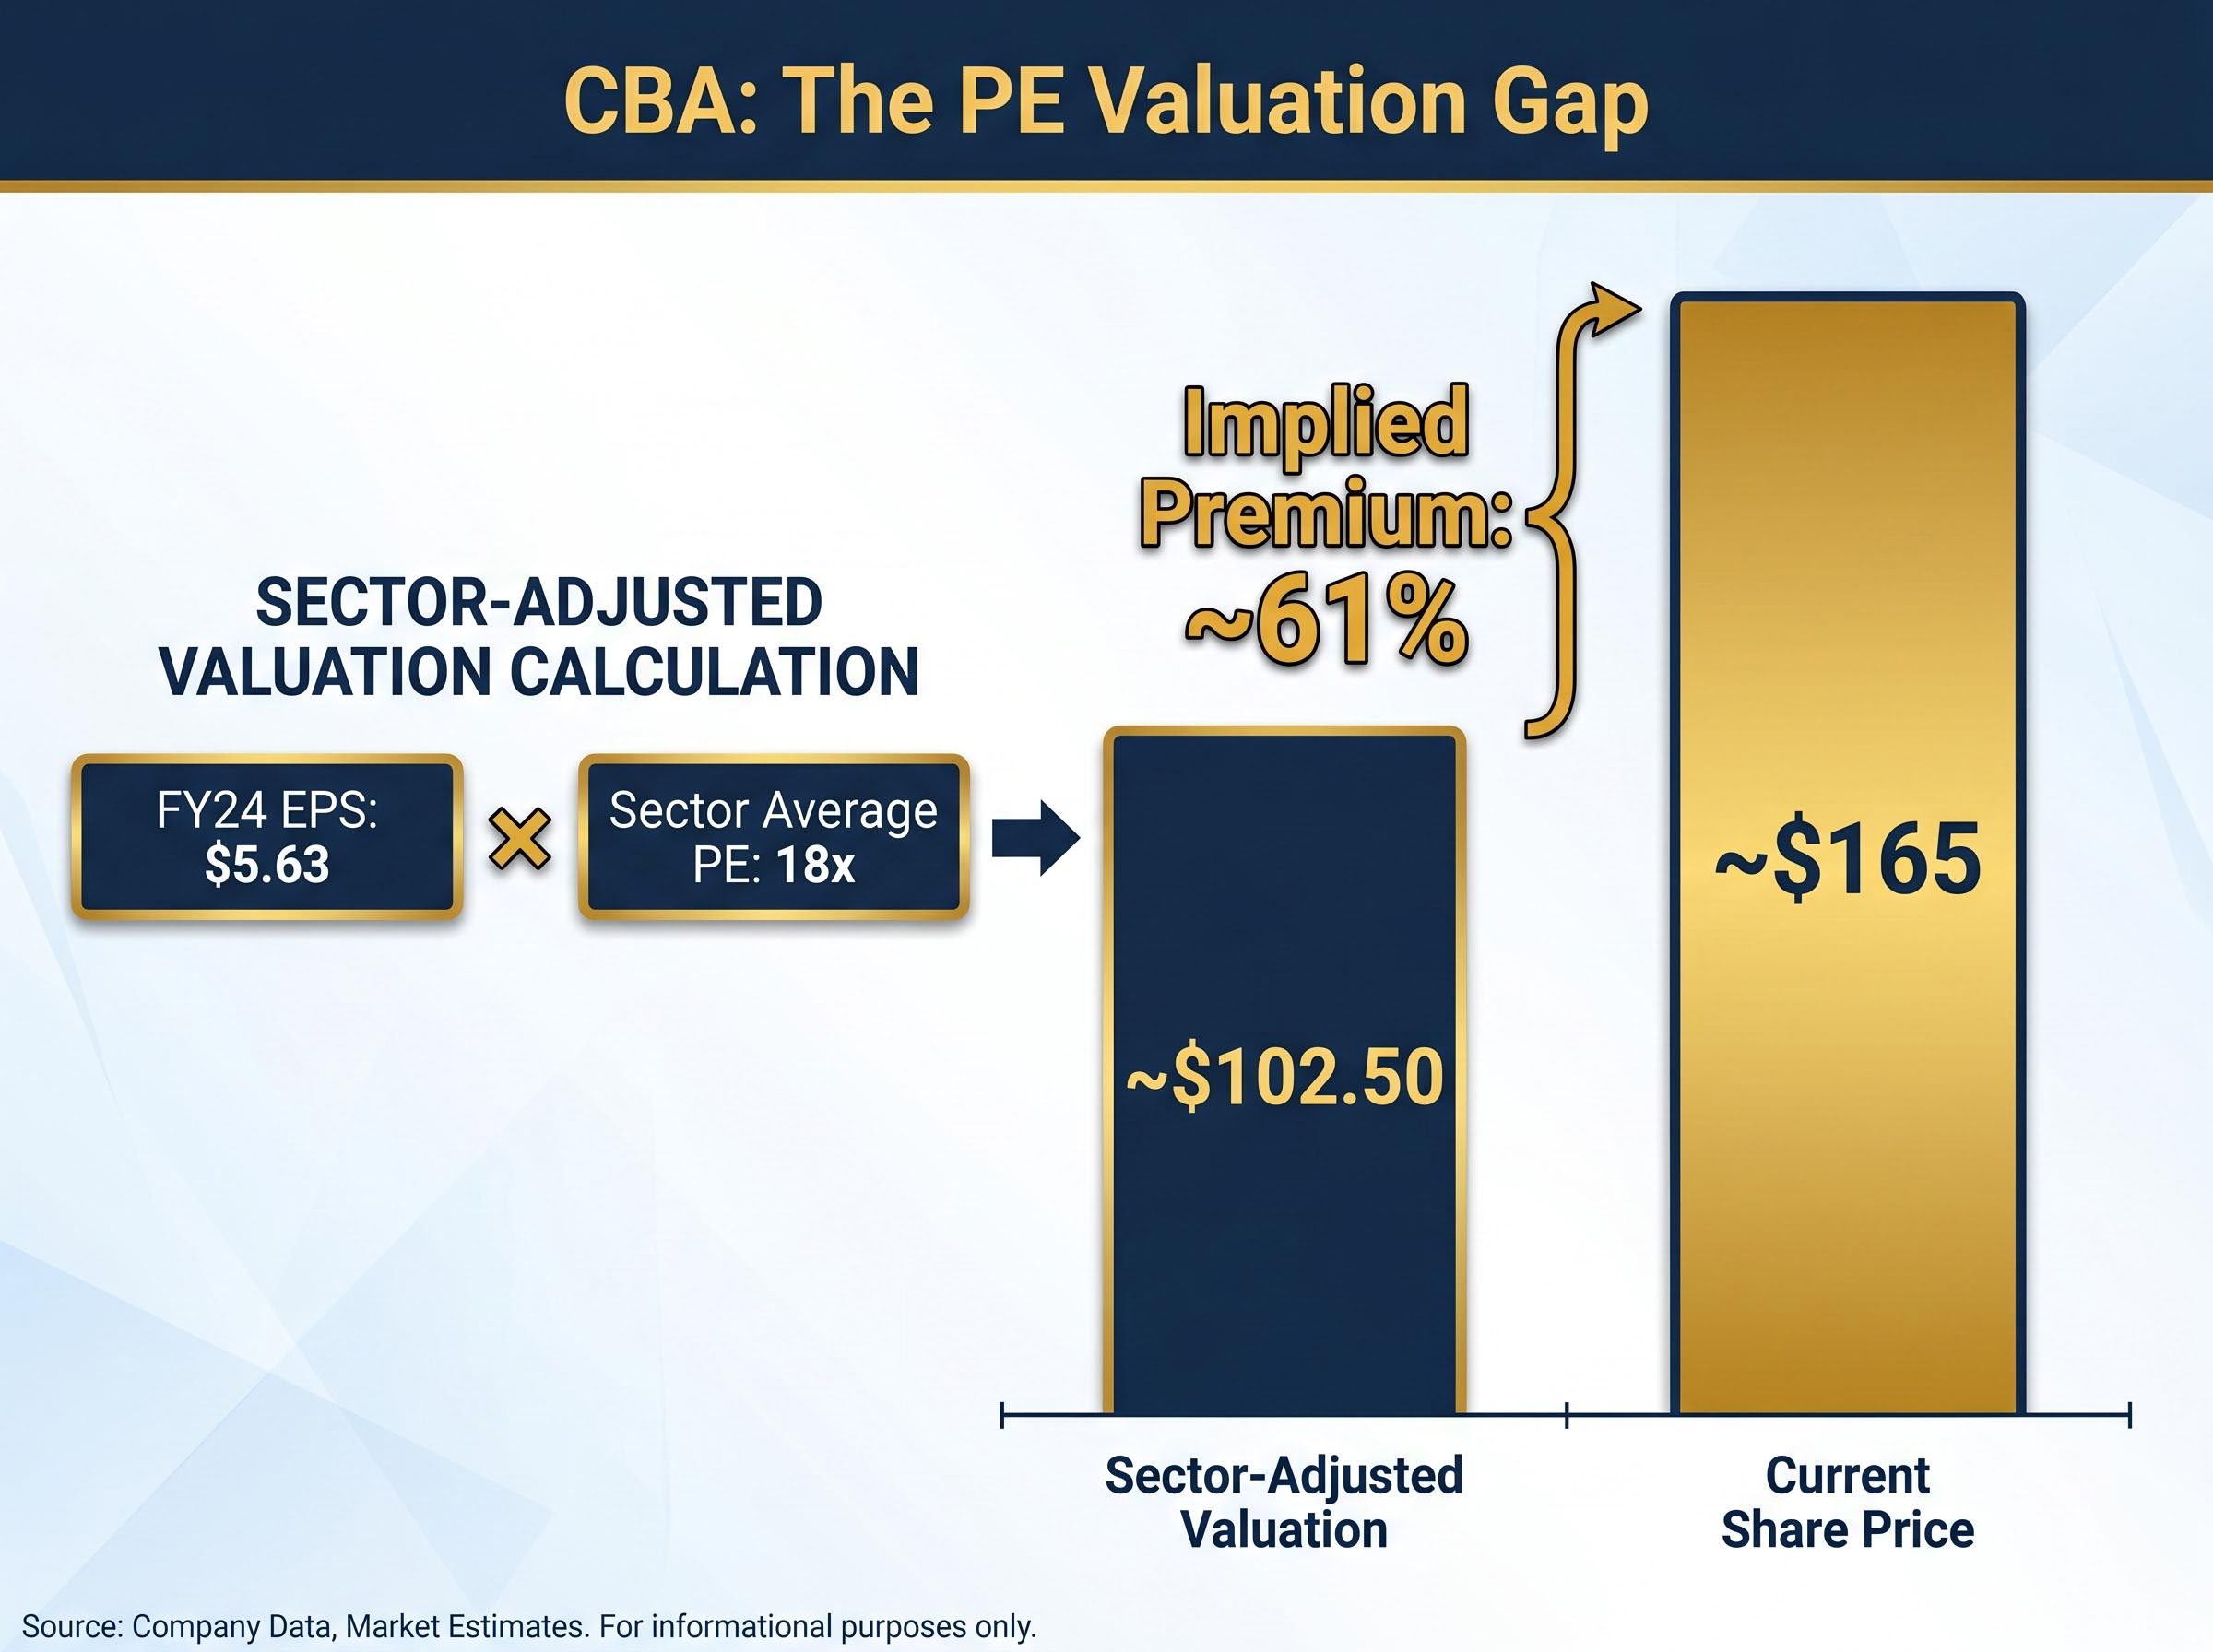
The PE ratio method asks a straightforward question: if CBA were valued at the same multiple as the average Australian bank, what would its shares be worth?
Using FY24 earnings per share of $5.63 and the Australian banking sector average PE of 18x, the calculation produces a sector-adjusted fair value of approximately $102.50.
That figure sits roughly 38% below the current share price.
| Input | Figure | Note |
|---|---|---|
| FY24 EPS | $5.63 | CBA reported cash EPS |
| Sector average PE | 18x | Australian banking sector benchmark |
| Sector-adjusted valuation | ~$102.50 | $5.63 x 18 |
| Current share price | ~$165 | As of 21-22 May 2026 |
| Implied premium | ~61% | Current price vs sector-adjusted value |
The immediate qualification is that 18x is a snapshot, not a fundamental anchor. CBA has consistently traded above the sector average, and analysts cite specific reasons for that:
Each of these factors supports some degree of premium. The question the PE method cannot answer is how much premium is enough.
The DDM values a stock based on the present value of its future dividends, discounted back to today. For a company like CBA, which has paid fully franked dividends consistently for decades, dividend forecasting is often more tractable than earnings forecasting, because banks tend to smooth dividends even when underlying profits fluctuate.
The model requires three inputs, applied in sequence:
For CBA, the base-case dividend is $4.65 per share (the most recent full-year figure used in the source research), with an adjusted figure of $4.76 reflecting minor revisions.
Franking credit gross-up: Because CBA dividends are fully franked, eligible Australian resident shareholders can gross up the dividend to include the tax credit value. For CBA, this lifts the effective dividend to approximately $6.80 per share, capturing the full economic value of the franking benefit. This adjustment raises the DDM’s valuation output materially.
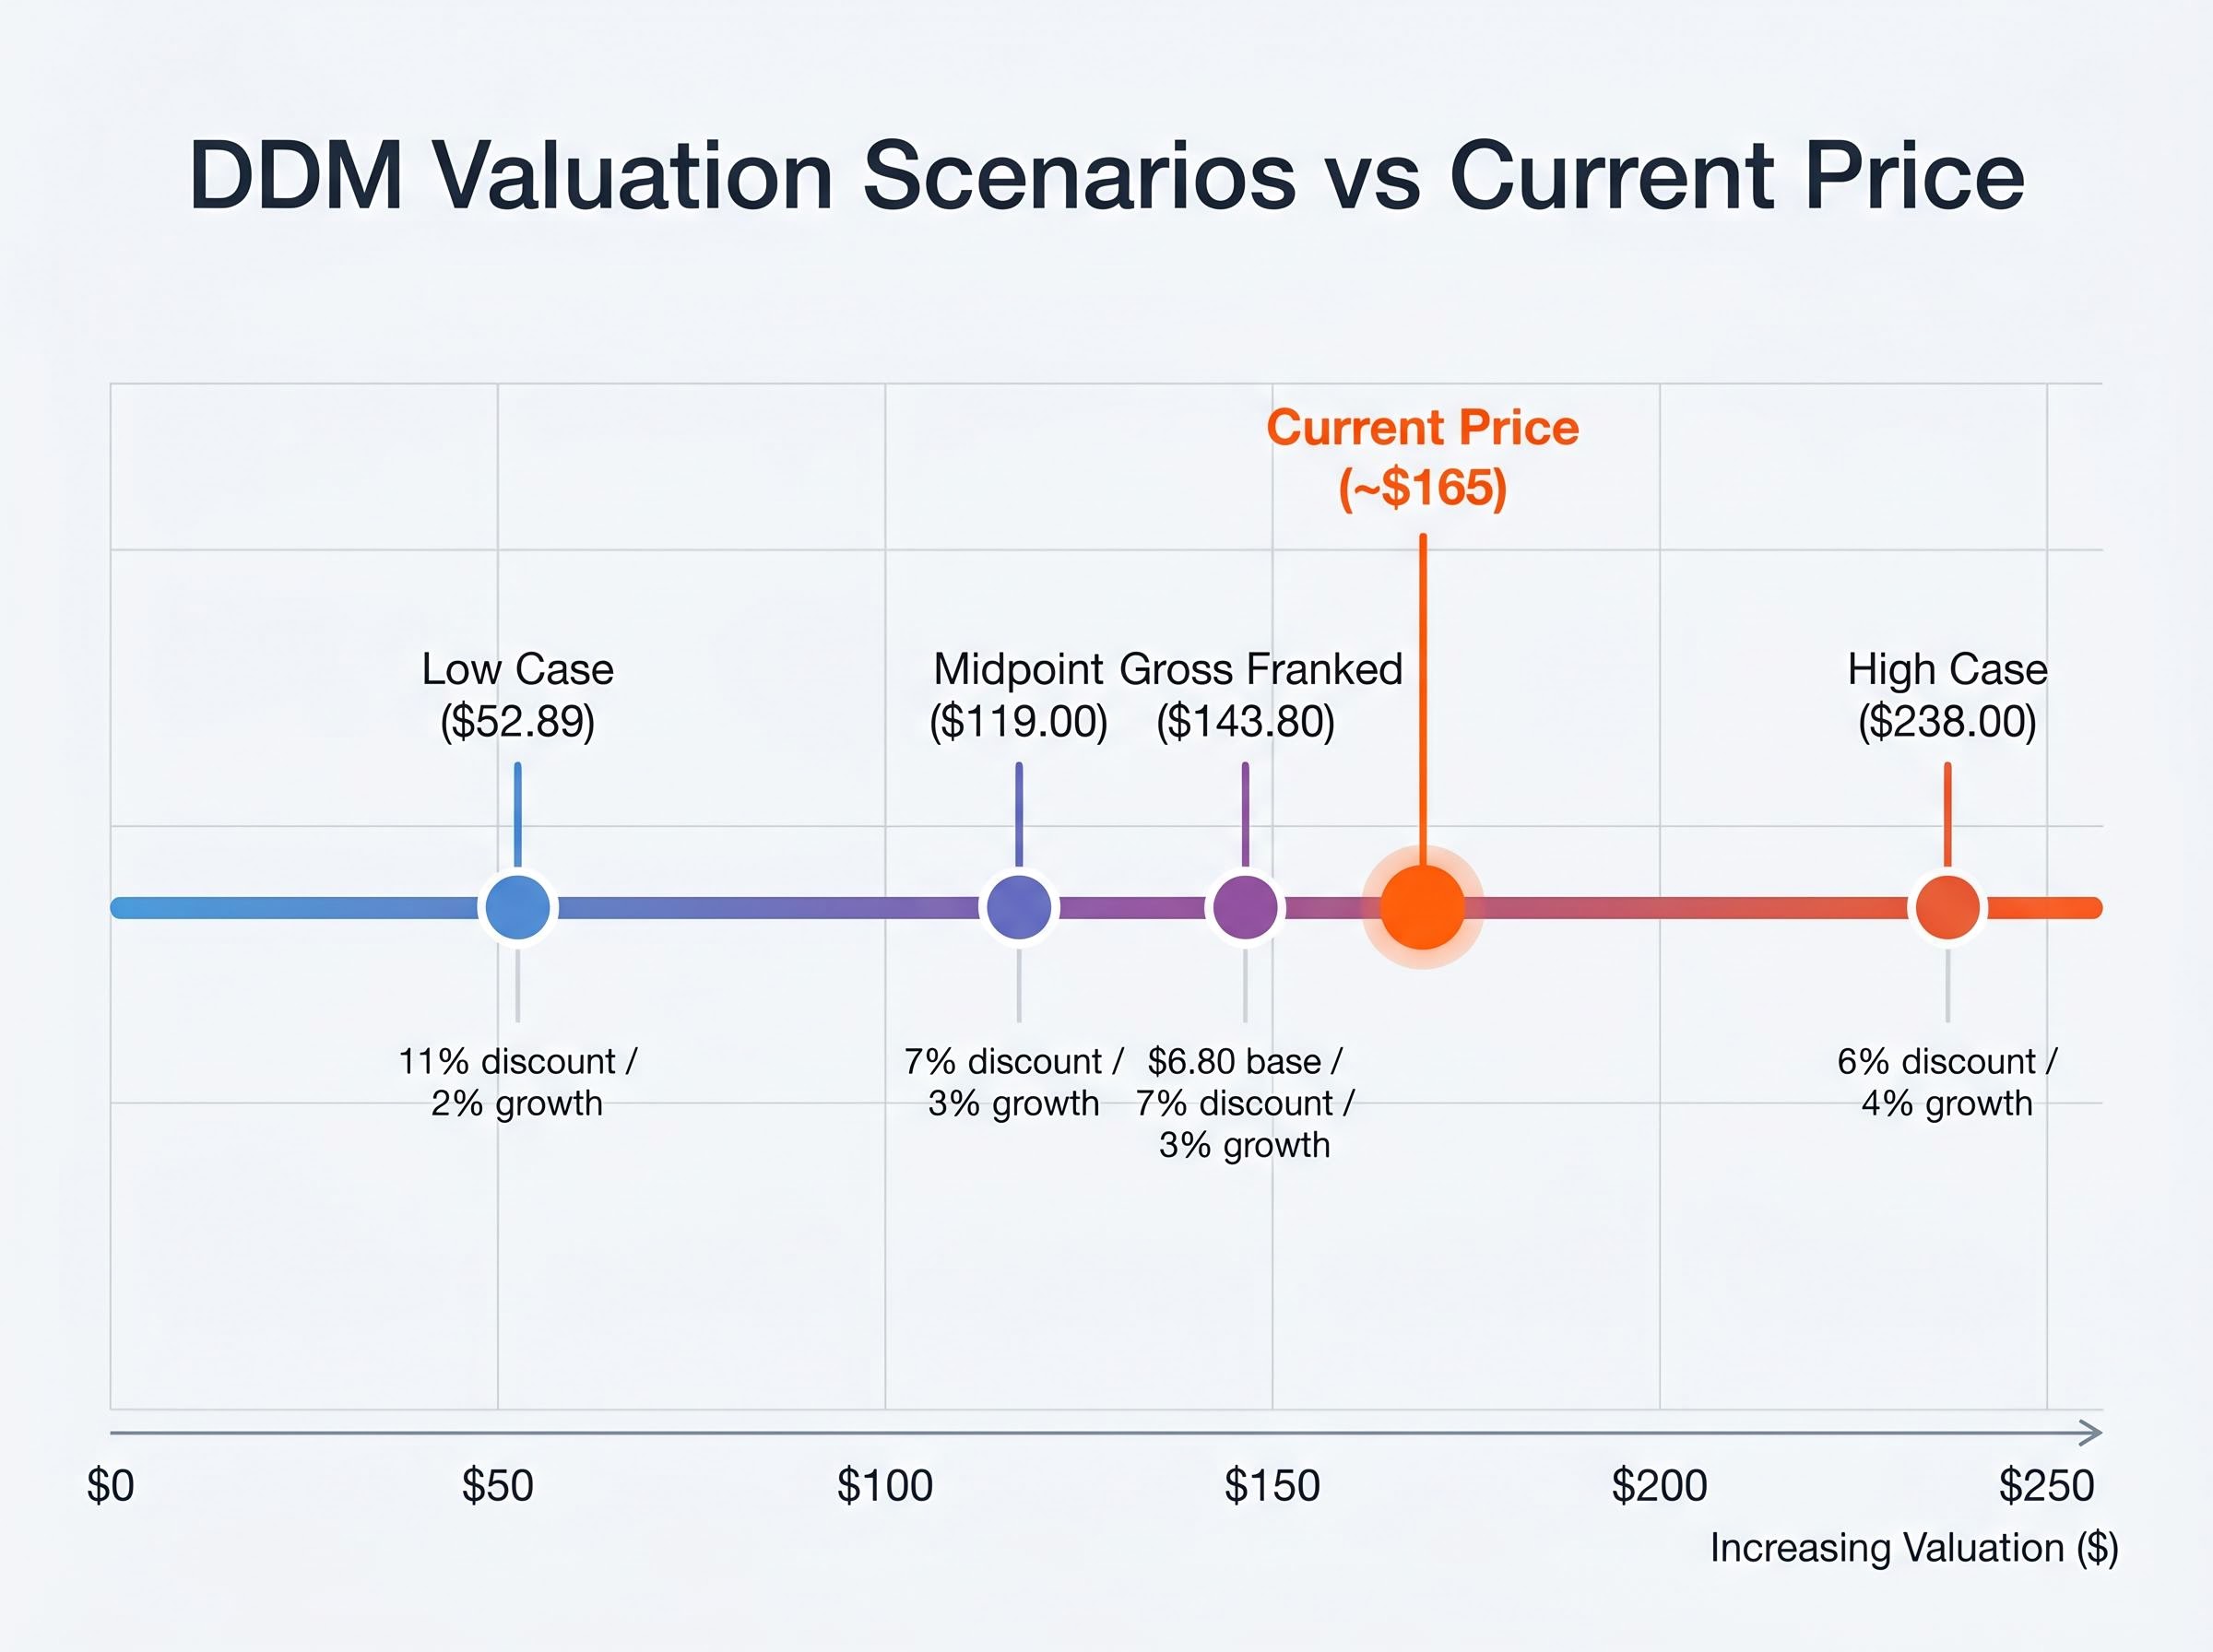
The sensitivity analysis uses discount rates ranging from 6% to 11% and dividend growth rates from 2% to 4%. The interaction between these two inputs produces the wide valuation range that follows.
The DDM’s strength is its honesty about uncertainty. Across the full range of plausible inputs, the model produces valuations from $52.89 (at an 11% discount rate and 2% growth) to $238.00 (at a 6% discount rate and 4% growth). The midpoint reference case, using a 7% discount rate and 3% growth, produces a valuation of $119.00.
| Dividend Input | Growth Rate | Discount Rate | Valuation Output |
|---|---|---|---|
| $4.65 (base) | 3% | 7% | $119.00 (midpoint) |
| $4.65 (base) | 2% | 11% | $52.89 (low case) |
| $4.65 (base) | 4% | 6% | $238.00 (high case) |
| $6.80 (gross, incl. franking) | 3% | 7% | $143.80 |
The dividend input itself moves the baseline materially. The $4.65 base case produces a midpoint valuation of $98.33. The adjusted $4.76 figure lifts that to $100.66. The gross dividend of $6.80, which includes the franking credit value, pushes the midpoint to $143.80.
For eligible Australian resident investors, the $143.80 gross dividend valuation represents the most relevant quantitative estimate, because it captures the full economic value of CBA’s fully franked payments. Even this most favourable scenario sits below the current share price of approximately $165.
The directional conclusion is clear. The majority of DDM scenarios place CBA’s intrinsic value below the current share price. Only the most optimistic input combinations, pairing a low discount rate with high growth and the gross dividend figure, produce valuations that approach or exceed $165.
Both the PE method and the DDM point in the same direction. At approximately $165, CBA trades above the PE-adjusted fair value of roughly $102.50 and above most DDM scenarios. The burden of proof sits with the bull case.
The arguments analysts make in support of the premium are substantive:
The arguments against the premium carry equal weight:
Analyst commentary captures the tension. Morningstar has characterised CBA as “a high-quality bank at a price that already reflects that quality.” Fund managers have cautioned that “quality does not immunise you from overpaying.” Neither side disputes CBA’s franchise strength; the disagreement is about whether today’s price leaves any margin of safety.
The analyst consensus on CBA as of April-May 2026 is unusually uniform: all 14 covering analysts hold sell ratings, with price targets clustered well below the current share price, a degree of negative consensus that is rare for a company whose franchise quality nobody disputes.
Analysts specifically cite CBA’s technology investment, AI capability, and digital platform as factors that warrant some PE premium but resist quantification in a DDM or PE framework. These are real competitive advantages, but they are priced on judgment rather than formula.
The macroeconomic context adds further variables that sit outside both models. The RBA’s rate path affects future net interest margins directly. APRA capital requirements influence sustainable ROE. Neither the PE method nor the DDM incorporates these dynamic inputs in a single-scenario calculation; both require the investor to make assumptions about where those variables are heading.
APRA quarterly ADI statistics publish entity-level capital ratios and aggregate performance data for authorised deposit-taking institutions, providing the regulatory capital context that shapes sustainable dividend capacity and return on equity benchmarks for Australian banks including CBA.
The two models converge on a directional finding. The PE method produces an implied fair value of approximately $102.50. Most DDM scenarios sit below $165, with the franking-adjusted gross case reaching $143.80 as the most favourable quantitative estimate for eligible Australian investors. The current share price trades above both.
The premium, then, is a function of qualitative confidence in CBA’s franchise, not quantitative model support.
The gap between model output and live share price is not a calculation error. It is the market’s judgment that CBA’s quality justifies a premium the models cannot generate on standard inputs.
For investors, the implications differ by position:
A peer valuation comparison across the big four shows that the sell-ratings pressure is not unique to CBA, though CBA carries the most extreme downside implied by consensus targets: ANZ is the only bank where buy ratings outnumber sells, a divergence that creates a meaningful income-versus-value trade-off for investors deciding how to allocate within the sector.
The forward PE of approximately 23-24x offers modest compression from the trailing figure but remains above peer averages directionally. Earnings growth would need to accelerate, or the share price would need to stall, for the gap to narrow meaningfully on fundamentals alone.
Both the PE method and the DDM, applied to CBA’s current data, produce fair value estimates below the live share price across most scenarios. That is a consistent signal, and it is worth taking seriously.
It is also not the final word. The DDM’s range of $52 to $238 is itself a statement about the limits of precision. The PE method’s reliance on a sector-average benchmark of 18x assumes that average is a meaningful anchor for a bank that has not traded at it for years. Both models require investor judgment to interpret, which is precisely why quantitative analysis is a starting point rather than a verdict.
The most favourable quantitative estimate available to an eligible Australian investor, the DDM gross case of $143.80, still sits below the current share price. Everything above that figure is premium.
Investors who find the quality argument compelling have one practical discipline available to them: stress-test the discount rate and growth assumptions until they can construct a DDM scenario above $165. If the required inputs feel plausible, the premium may be defensible. If they feel stretched, the model is doing its job.
For investors wanting to layer macro data and qualitative analysis on top of the quantitative outputs discussed here, our comprehensive walkthrough of ASX bank valuation beyond quantitative models covers how RBA rate path data, CoreLogic property trends, APRA arrears statistics, and each bank’s strategic execution track record combine to form a conviction view that the PE and DDM alone cannot generate.
This article is for informational purposes only and should not be considered financial advice. Investors should conduct their own research and consult with financial professionals before making investment decisions. Past performance does not guarantee future results. Financial projections are subject to market conditions and various risk factors.
The Dividend Discount Model values a stock by calculating the present value of its future dividends, discounted back to today using a required rate of return. For CBA, applying this model with a base dividend of $4.65, a 7% discount rate, and 3% growth produces a midpoint valuation of approximately $119.00, rising to $143.80 when franking credits are included.
CBA commands a premium PE ratio of roughly 26-27x trailing earnings because the market prices in its higher and more stable return on equity, a stronger retail deposit franchise, lower earnings volatility across credit cycles, and a digital platform lead that peers have not closed.
Because CBA pays fully franked dividends, eligible Australian resident shareholders can gross up the dividend to include the tax credit value, lifting the effective dividend from $4.65 to approximately $6.80 per share. This adjustment raises the DDM midpoint valuation from $119.00 to $143.80, making the franking-adjusted figure the most relevant quantitative estimate for Australian investors.
As of April-May 2026, all 14 analysts covering CBA hold sell ratings with price targets clustered well below the current share price of approximately $165, an unusually uniform level of negative consensus for a company whose franchise quality is widely acknowledged.
CBA offers the lowest cash dividend yield among the big four banks, not because it pays a lower absolute dividend, but because its share price is substantially higher, meaning income-focused investors receive more income per dollar invested from NAB and Westpac than from CBA, even after accounting for full franking credits.