VAS vs VHY: Why the Lower-Yield ETF Wins in Retirement
1 hr ago
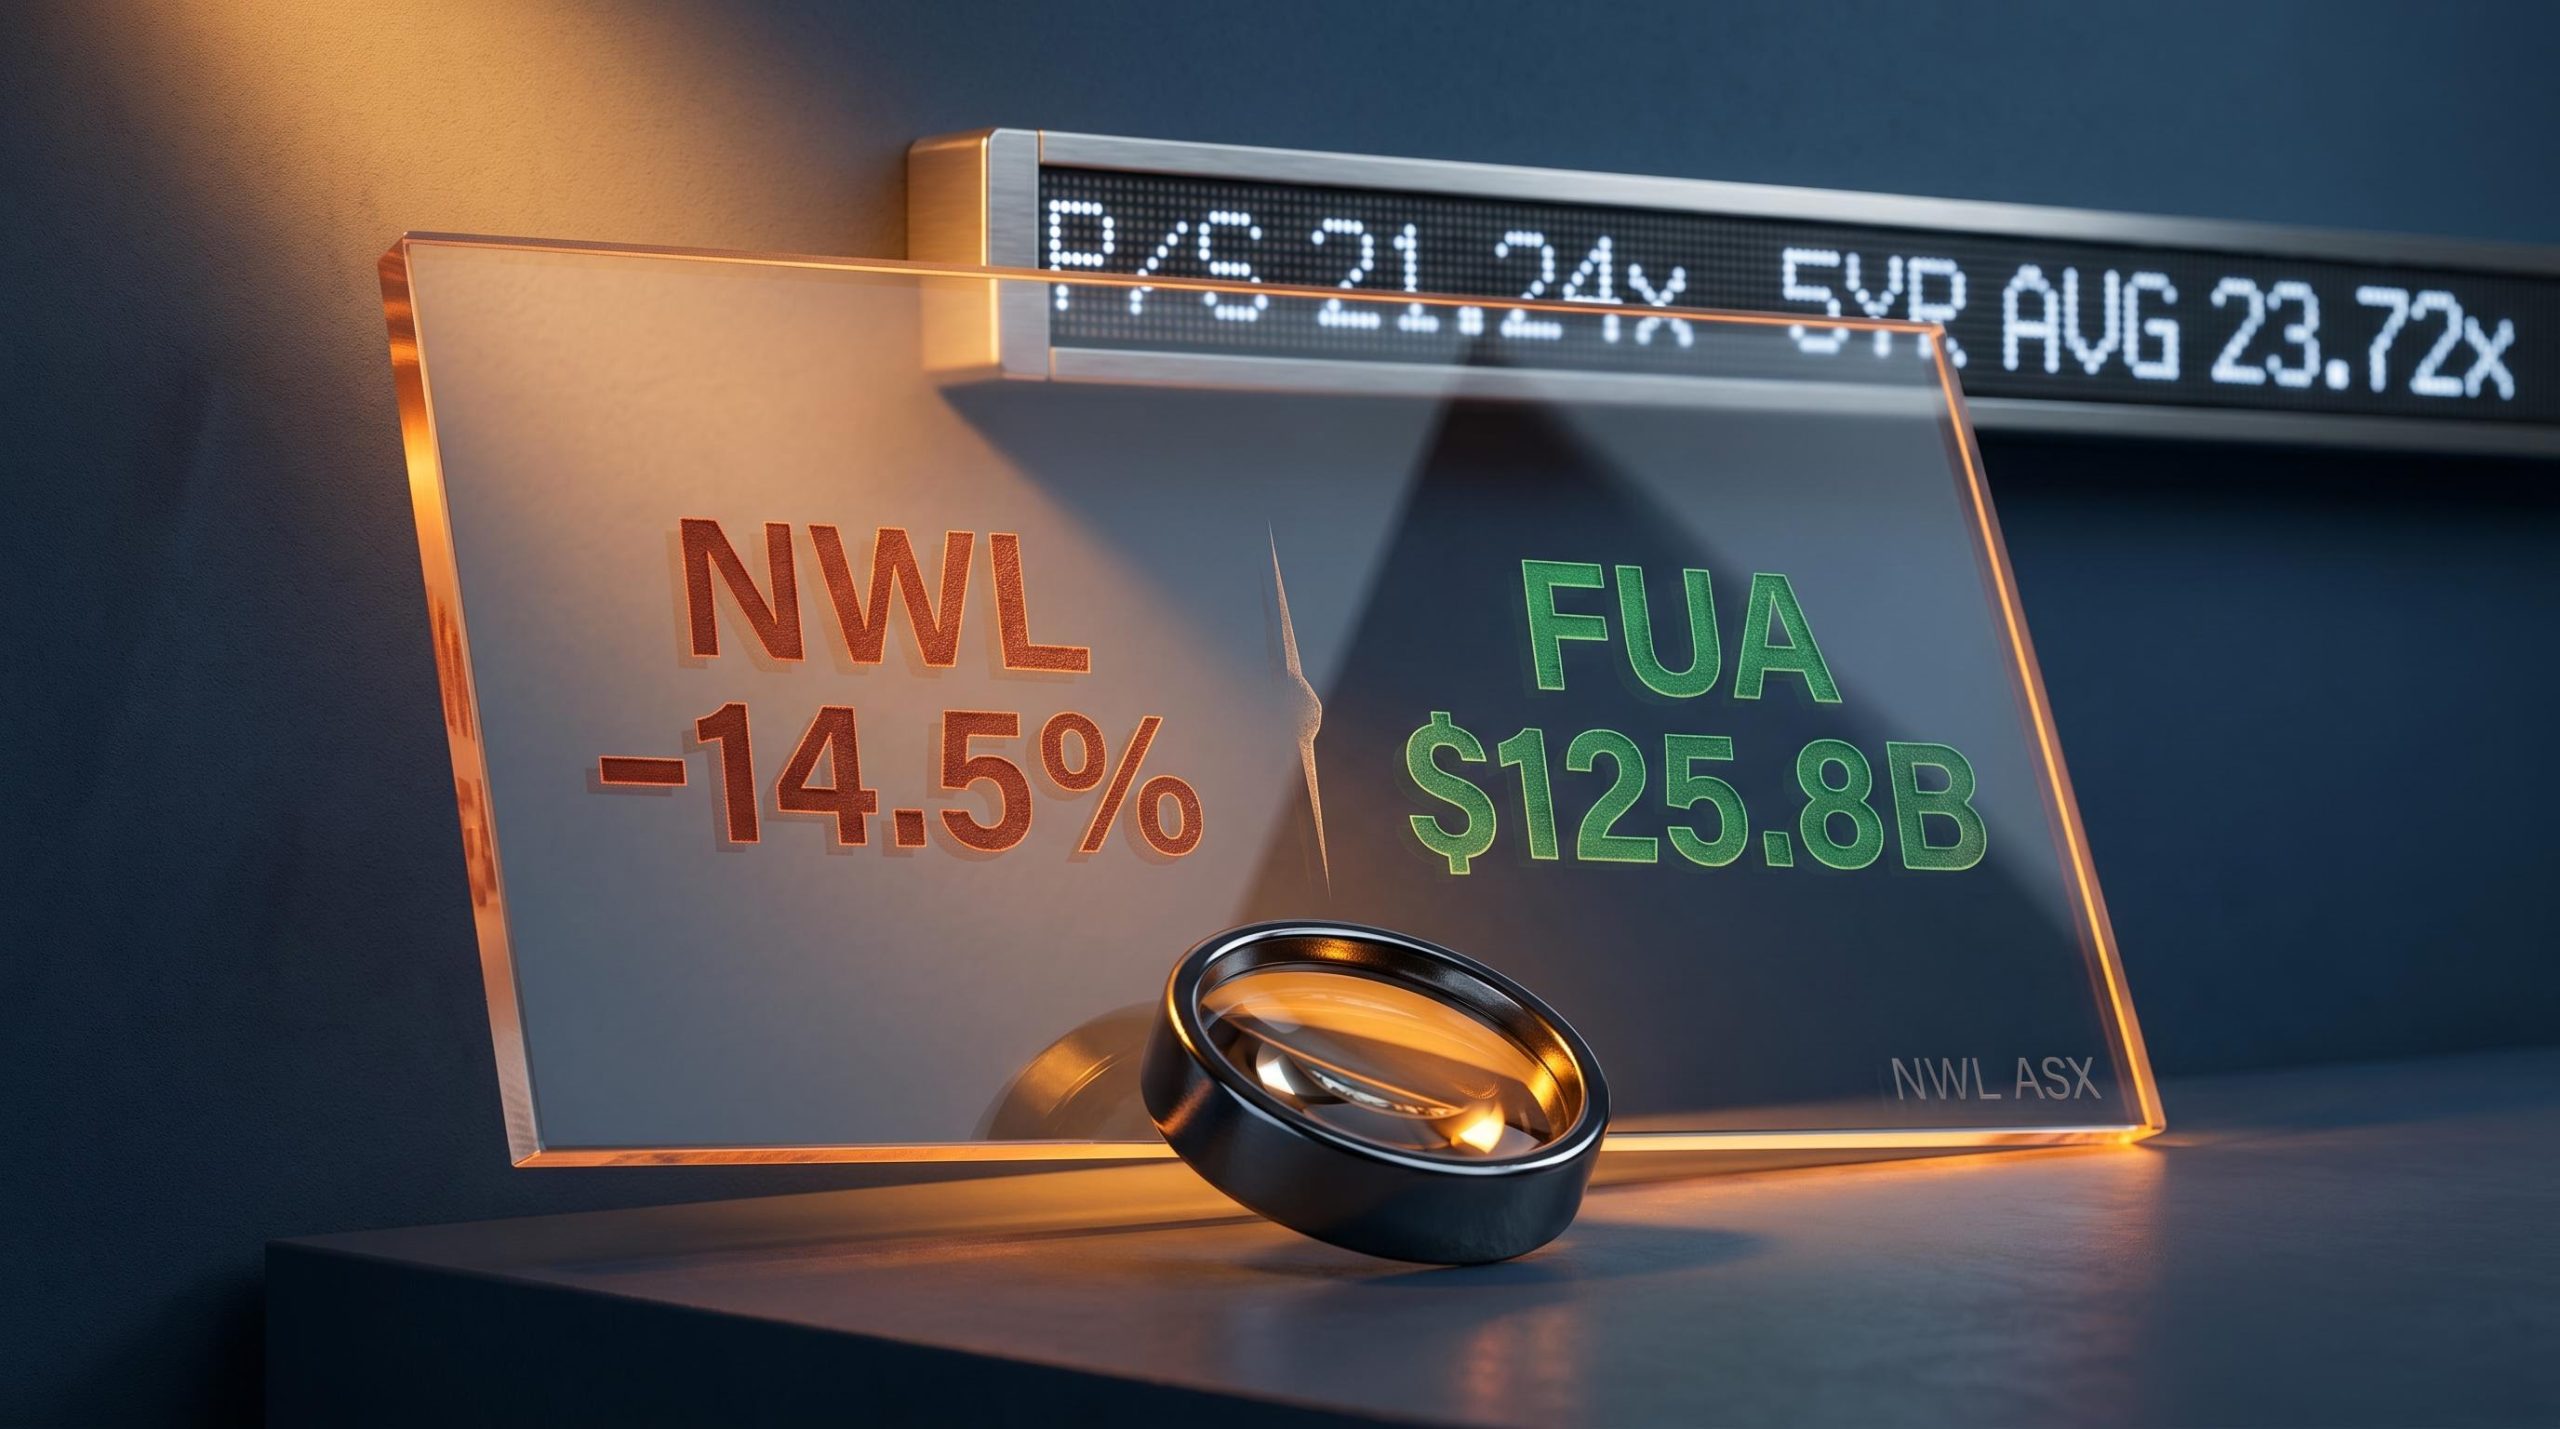
Netwealth shares have fallen roughly 14.5% since the start of 2025, yet the platform underneath that declining price has grown funds under administration (FUA) from approximately $89 billion to $125.8 billion in less than two years. That tension, a falling share price layered on top of a rising business, is what brings most investors to the search bar. The current price-to-sales (P/S) multiple of 21.24x sits below Netwealth’s five-year average of 23.72x, lending surface-level weight to the idea that the stock is cheaper than usual. This article examines what that ratio genuinely reveals about NWL’s valuation, grounds it in the platform’s business fundamentals and competitive position, and catalogues the dimensions the ratio cannot capture, so that any investor considering a position starts from an informed baseline rather than a single data point.
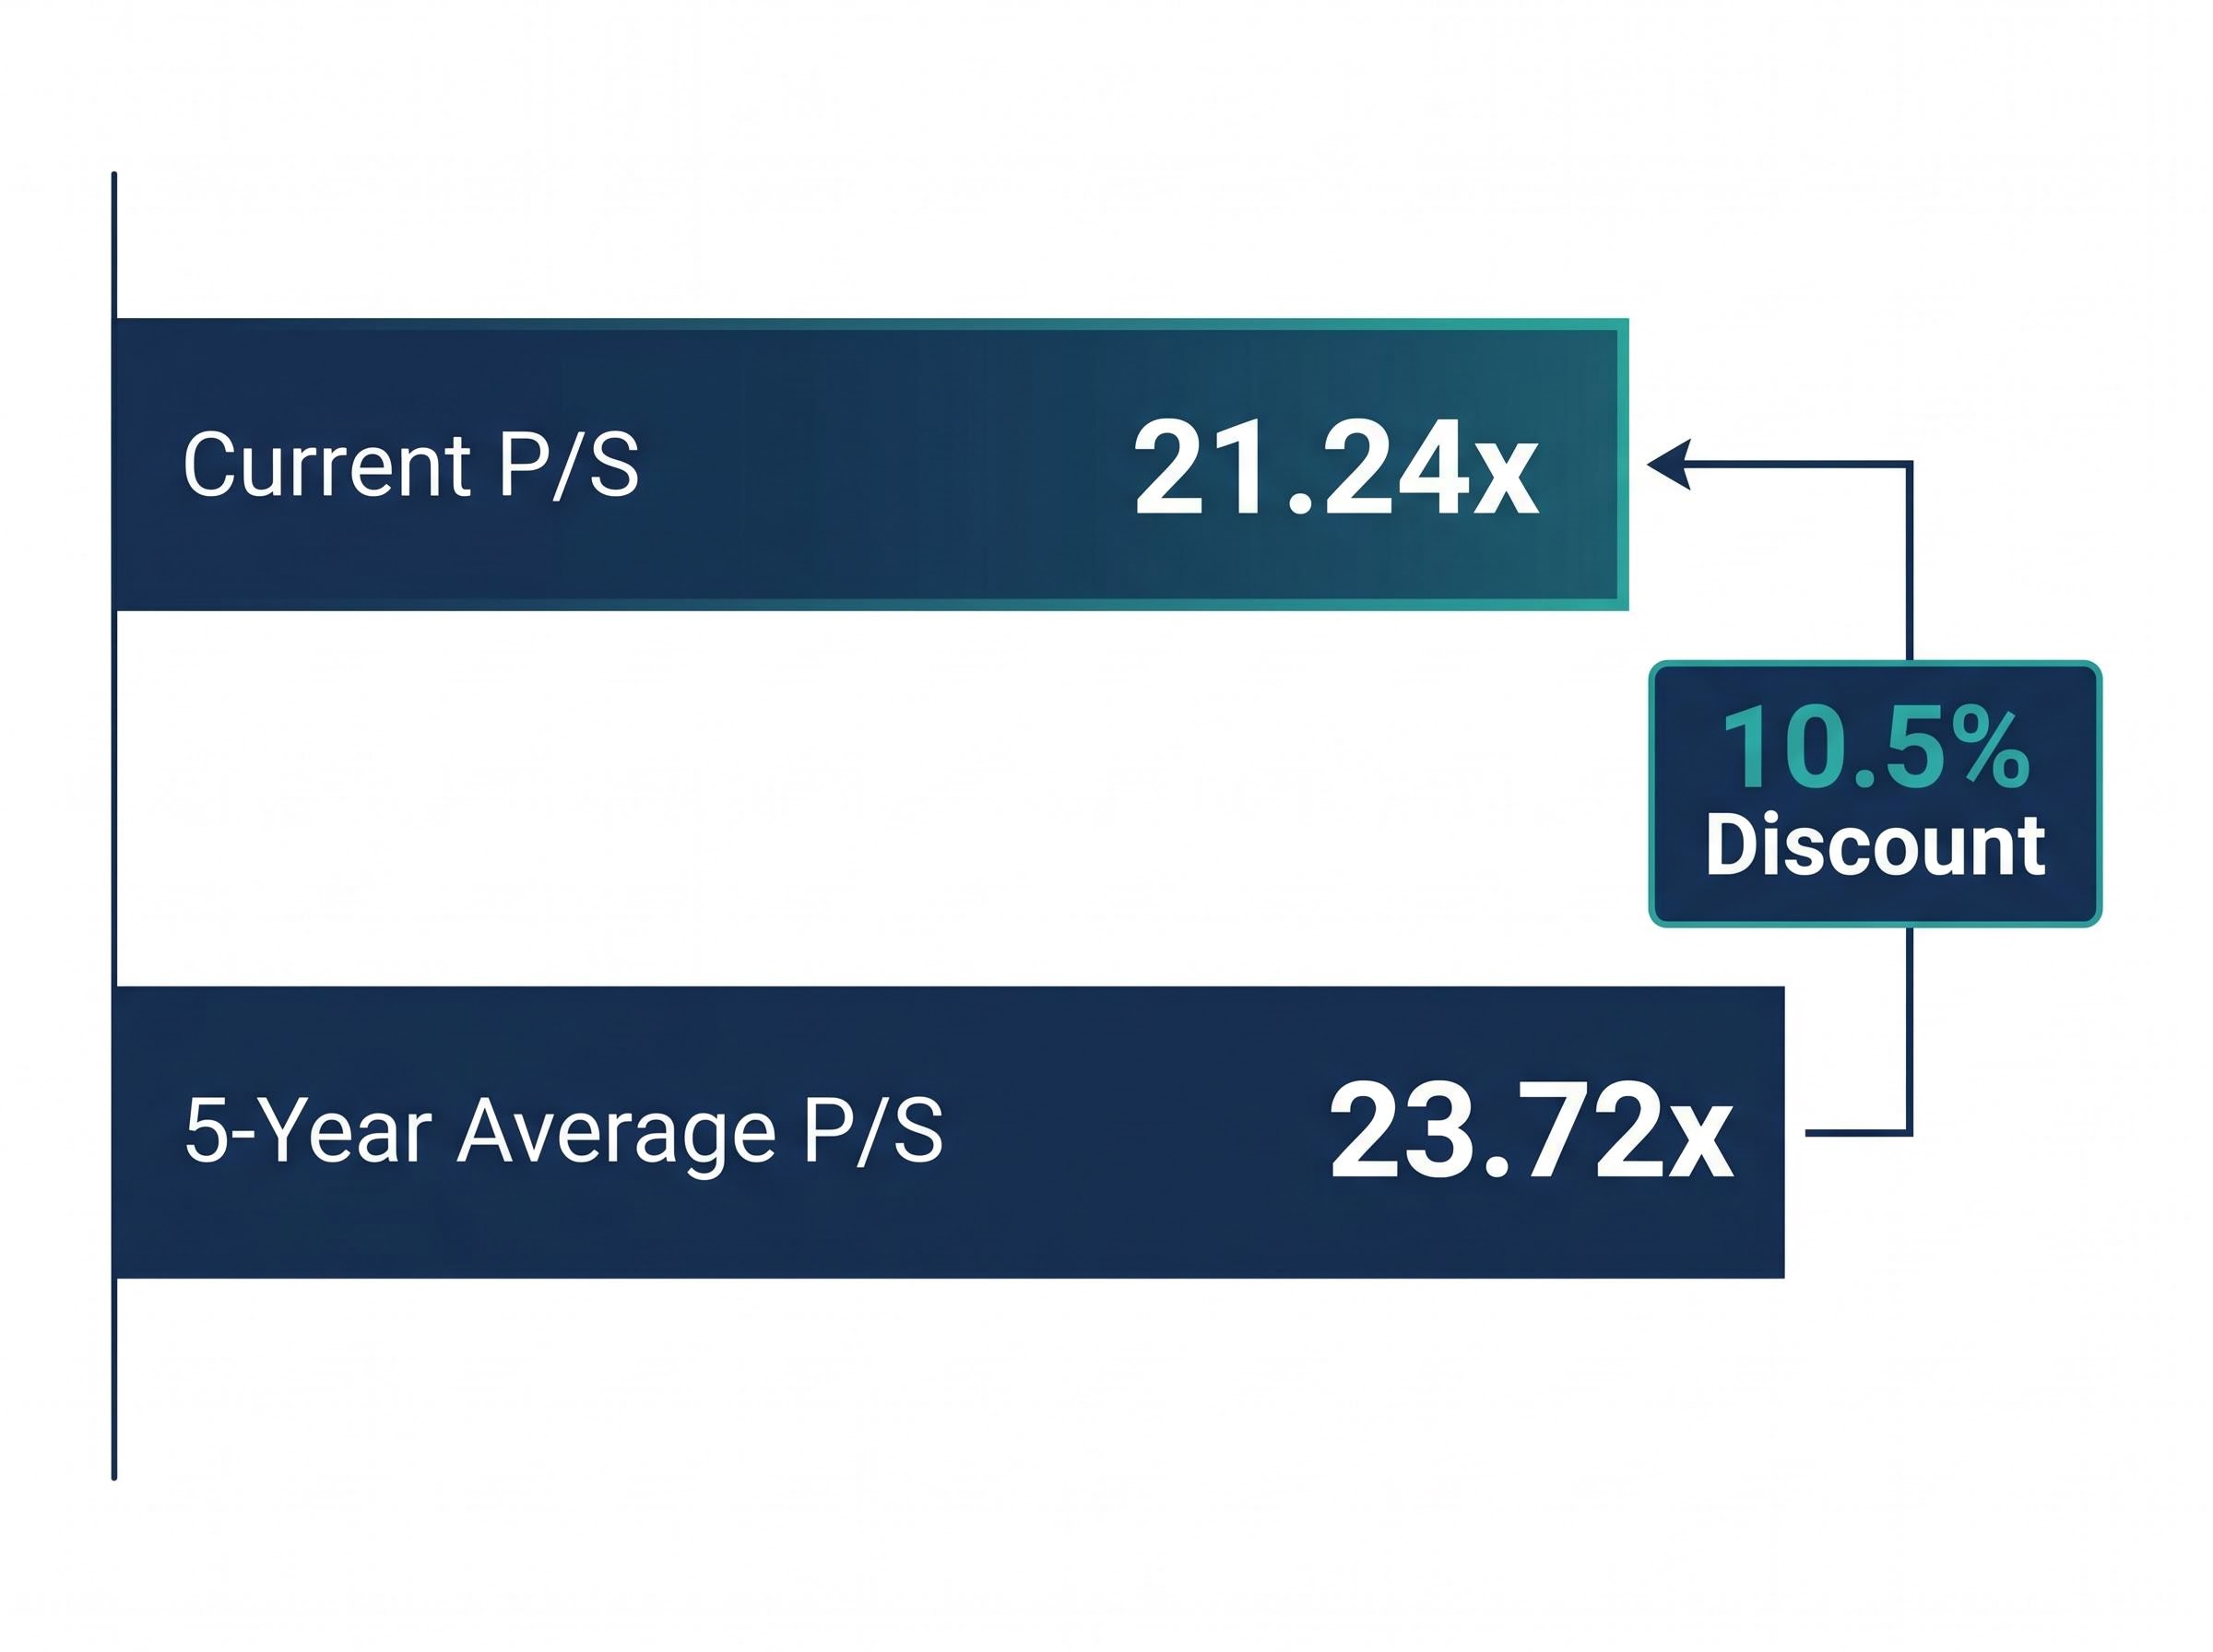
At approximately A$22.39-A$22.45 as at 19 May 2026, Netwealth trades on a P/S multiple of 21.24x, modestly below its five-year historical average of 23.72x. That gap is real, and it is worth investigating. It is not, however, a conclusion.
Valuation signal: Netwealth’s current P/S of 21.24x sits below the five-year average of 23.72x, a discount of roughly 10.5% to its own history.
A P/S multiple can fall below its average for three distinct reasons, and each carries very different implications:
In Netwealth’s case, the third scenario applies. The share price is down roughly 14.5% from its January 2025 levels while FUA, the engine of platform revenue, has continued growing at double-digit rates. That combination means the ratio compression reflects both market-driven repricing and business-driven revenue expansion. Distinguishing between those two forces is where the real analysis begins.
The P/S ratio is one of the simplest valuation tools available, which makes it both useful and easy to misapply. The calculation involves three steps:
The resulting figure tells an investor how much the market is willing to pay for every dollar of revenue the company generates. For Netwealth, a P/S of 21.24x means investors are currently paying approximately $21.24 for each dollar of trailing revenue.
P/S sidesteps the noise that can distort earnings-based ratios. For high-growth companies reinvesting heavily in technology and platform development, reported earnings often understate the business’s underlying momentum. Revenue, by contrast, captures the demand signal more cleanly. This is why P/S serves as a useful initial screen for platform businesses, where margins are expanding over time but can fluctuate with investment cycles. Netwealth’s forward price-to-earnings ratio has ranged from approximately 35-45x across 2024-2025, and its price-to-book ratio sits substantially above 10x, consistent with an asset-light model where book value captures only a fraction of the business’s worth.
The price-to-sales ratio for ASX growth stocks operates differently from its application in cyclical or capital-intensive sectors, because the revenue base it divides into market capitalisation is structurally recurring and tied to an expanding asset pool rather than lumpy, project-based income streams.
P/S is most reliable when revenue quality is high, meaning recurring, predictable, and linked to a growing base rather than one-off transactions. Netwealth’s fee-on-FUA model fits that description well: revenue scales with both market appreciation and net inflows, and adviser switching costs make the revenue base sticky.
The ratio becomes misleading when a company grows revenue through low-margin channels or at the cost of operating leverage. A platform could theoretically expand revenue by cutting fees to win market share, compressing margins while the P/S ratio looks attractively low. This is a scenario worth monitoring as technology spending cycles continue across the Australian platform sector.
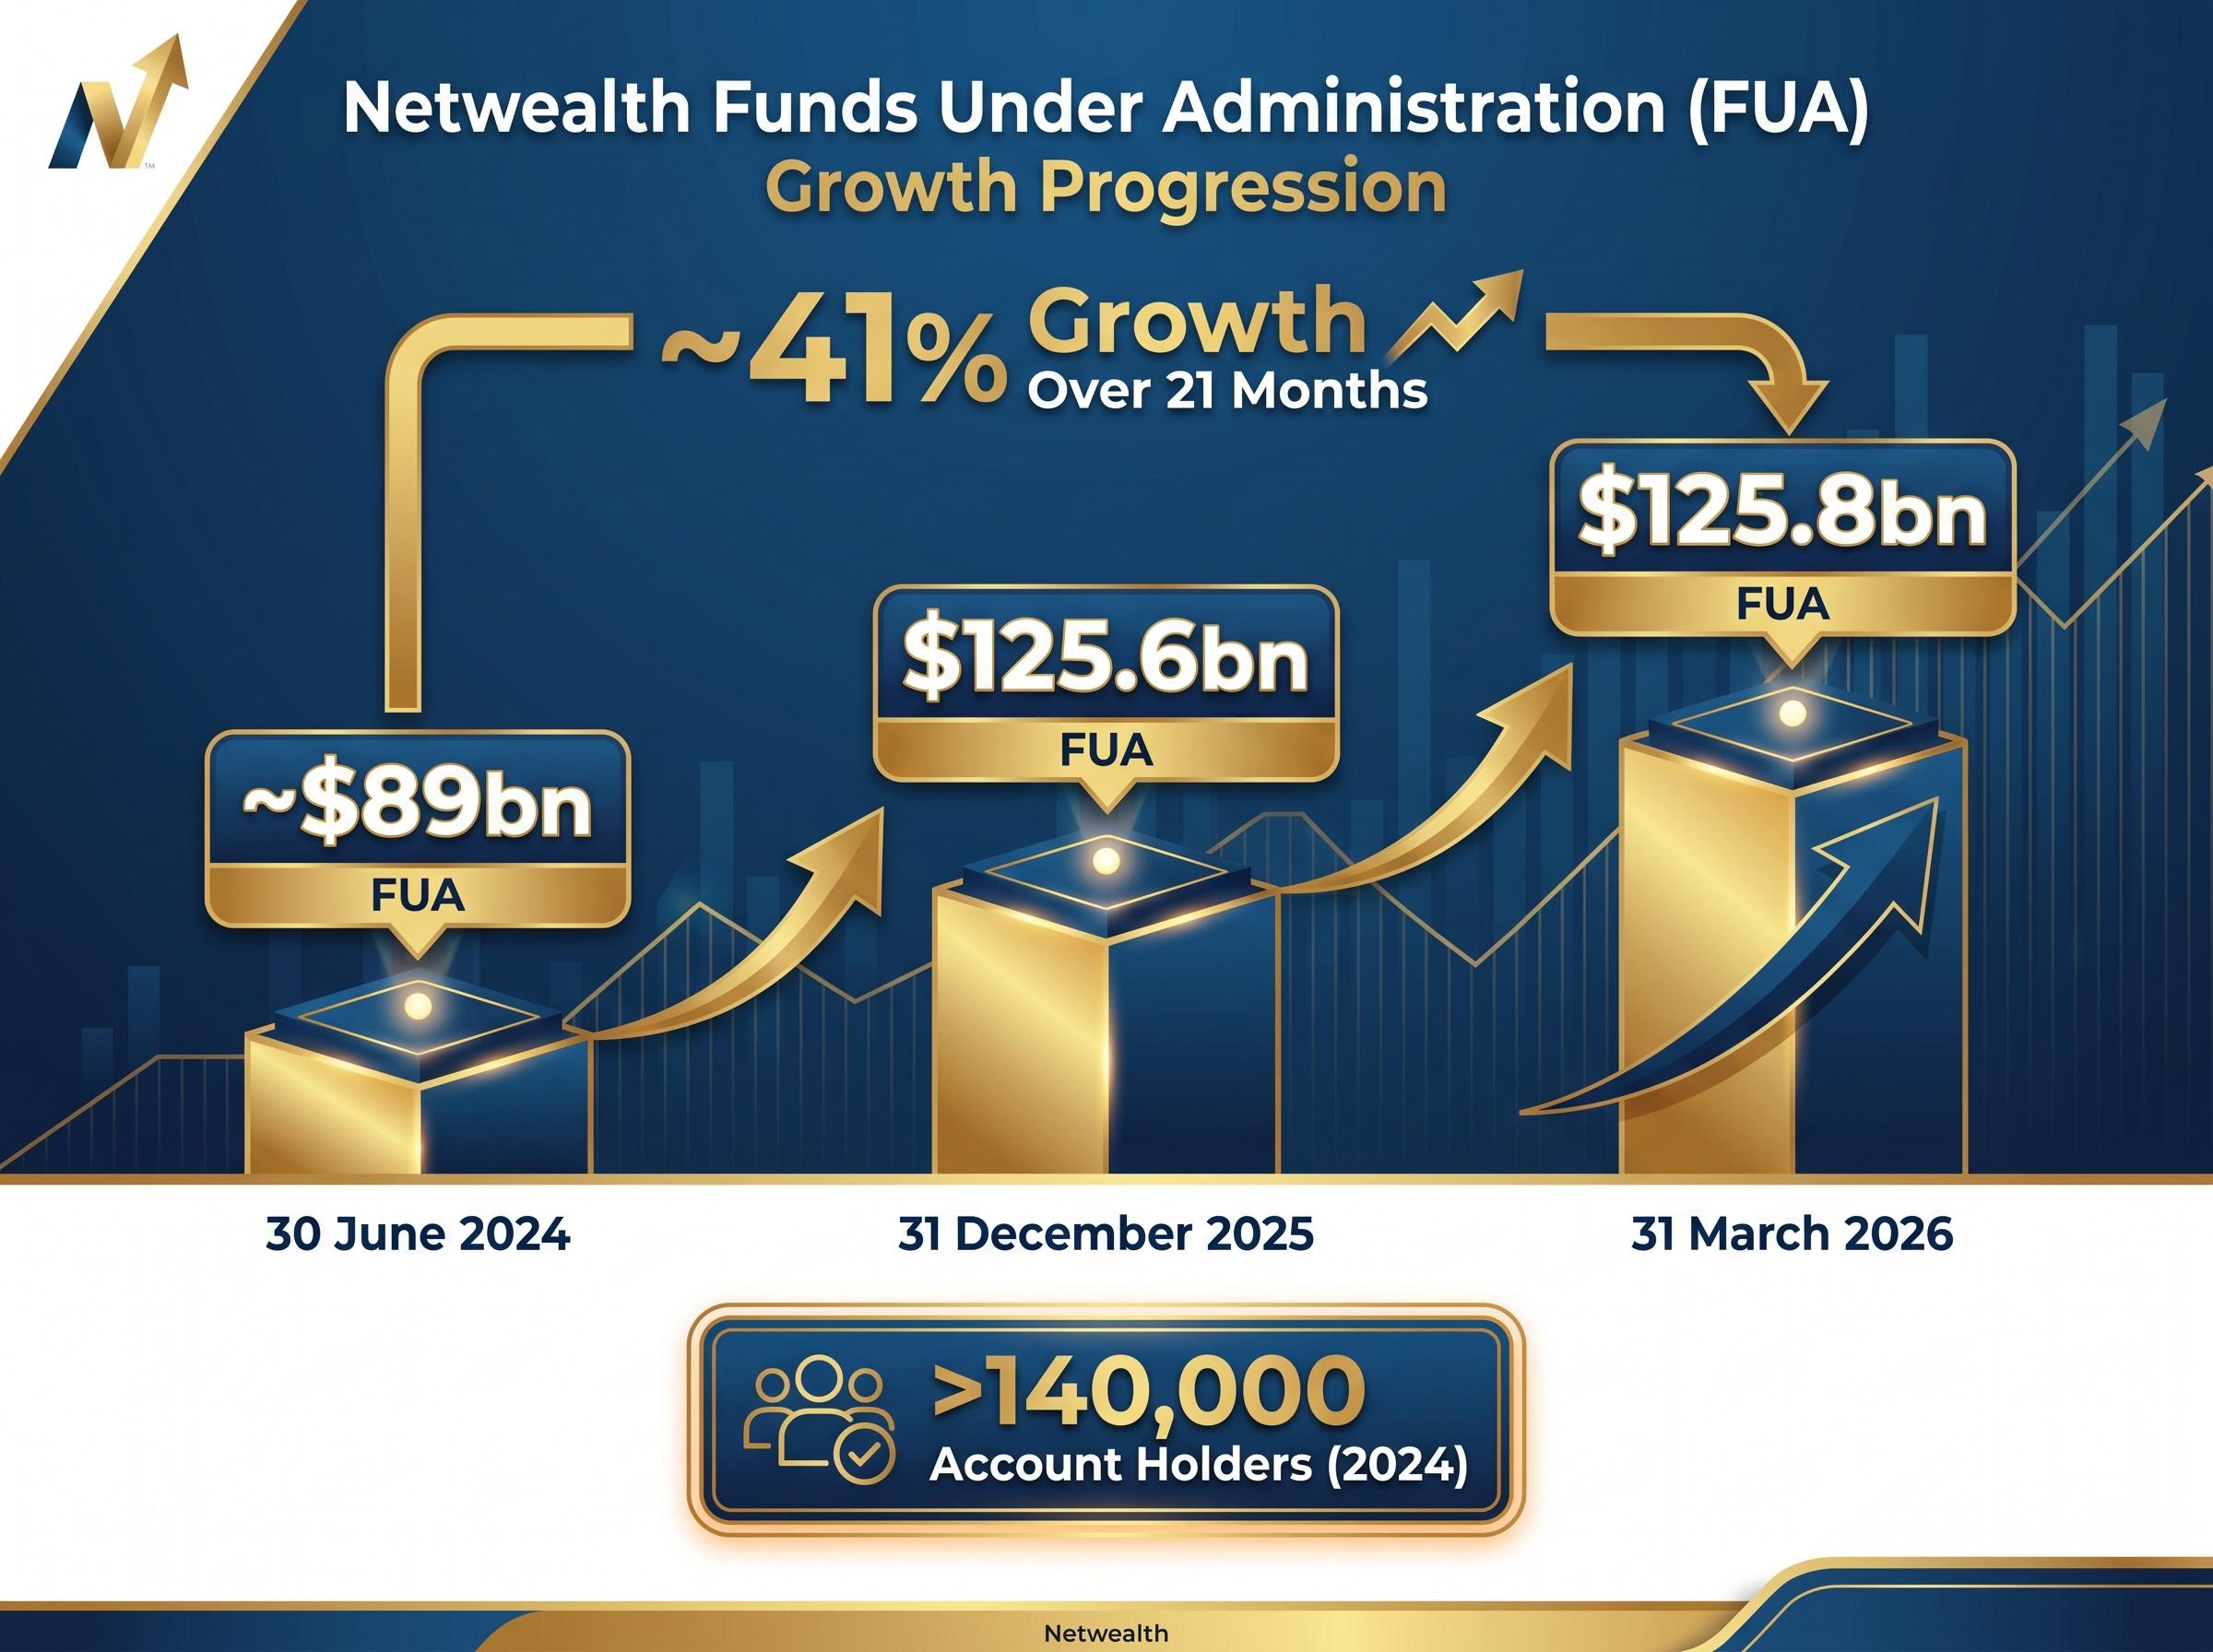
Netwealth operates as a B2B2C wealth administration platform. Financial advisers use the platform to manage client portfolios, and Netwealth earns revenue on a fee-on-FUA basis, meaning the platform generates income proportional to the total assets it administers. More than 140,000 account holders were using the platform as of 2024.
This model produces three characteristics that support premium valuation multiples:
The growth trajectory has been material. FUA has expanded from approximately $89 billion at 30 June 2024 to $125.8 billion at 31 March 2026, representing roughly 41% growth over 21 months. The most recent quarterly business update, released on 16 April 2026, reported year-on-year FUA growth of 20.9% and net flows of $4.0 billion for Q3 FY26.
| Date | FUA | YoY Growth Note |
|---|---|---|
| 30 June 2024 | ~$89bn | FY24 baseline |
| 31 December 2025 | $125.6bn | 1H FY26; ~41% growth from Jun 2024 |
| 31 March 2026 | $125.8bn | 20.9% year-on-year |
Understanding this business model transforms the P/S ratio from an abstract figure into a statement about whether the market is paying a fair price for a specific, recurring, and scaling revenue stream.
The P/S multiple reflects not just what Netwealth earns today but the market’s assessment of where it sits competitively. That position is strengthening.
A structural shift is underway in Australian wealth management. Advisers are migrating from legacy institutional platforms operated by AMP, Insignia Financial, and BT toward independent, technology-first alternatives. Netwealth and HUB24 are the primary beneficiaries of this migration, consistently capturing a disproportionate share of net inflows relative to their share of total industry FUA. Three forces are pulling advisers toward independent platforms:
The Quality of Advice Review Final Report, published by the Australian Treasury, identified scalable and compliant platform infrastructure as central to expanding financial advice accessibility, a finding that directly supports the structural tailwind thesis for independent operators like Netwealth.
The comparison between Netwealth and HUB24 deserves honest treatment. HUB24 has at times demonstrated higher organic net flow growth rates, while Netwealth is generally recognised for a stronger margin profile. That margin advantage partly justifies NWL’s premium multiples.
HUB24’s FUA and revenue trajectory provide a useful comparative anchor for assessing Netwealth’s own premium: HUB24’s total group FUA reached $151.7 billion at 31 March 2026 alongside 44.4% annualised revenue growth from 2021 to FY24, yet the market assigns it a lower forward multiple, a gap that reflects differing margin profiles rather than a simple disagreement about growth rates.
| Platform | Forward P/E (Mid-2025) | Margin Profile | Net Flow Momentum |
|---|---|---|---|
| Netwealth (NWL) | ~40x | Generally stronger; higher operating leverage | Consistently positive; high absolute levels |
| HUB24 (HUB) | ~32x | Expanding but typically below NWL | At times higher organic growth rate |
The competitive context matters because a valuation multiple only makes sense relative to the earnings power and industry dynamics generating it. Netwealth’s premium over both legacy platforms and HUB24 reflects a market judgment about margin quality and platform stickiness. Whether that premium is justified or stretched depends on whether the structural migration continues at pace.
A P/S ratio of 21.24x captures one dimension of Netwealth’s valuation. It is structurally blind to several others that matter for a complete investment assessment. Specifically, P/S does not account for:
The picture changes materially when the lens shifts from revenue to earnings: trailing PE and margin compression tell a sharper story, with Netwealth’s net profit margin falling from 35.4% to 15.71% even as revenue grew 12.6%, a dynamic that explains why different valuation methods produce such divergent implied values for the same stock.
Comprehensive valuation approaches such as discounted cash flow (DCF) or dividend discount models (DDM) require explicit assumptions about future cash flows, growth rates, and discount rates. For a high-growth platform like Netwealth, small changes in those assumptions produce large swings in implied value. This is precisely why no single ratio can substitute for a full valuation framework.
The broker consensus picture reinforces this caution. A Morgans price target of approximately A$19-20 was cited in 2025 coverage, but that figure is now stale and sits below the current trading price of approximately A$22.39-A$22.45. Updated 2026 consensus targets are not publicly available and would need to be sourced from broker platforms or services such as Intelligent Investor before informing a decision.
The analytical path through this article leads to a measured conclusion. Netwealth’s current P/S of 21.24x, sitting below the five-year average of 23.72x, is a legitimate reason to examine the stock more closely. FUA growth of approximately 41% from June 2024 to March 2026, consistent net inflows, competitive momentum against legacy platforms, and a recurring fee-on-FUA revenue model all support the case for premium valuation. The discount to historical multiples is modest, not a dramatic dislocation, and it reflects both a lower share price and an expanded revenue base.
That signal is a starting point, not a destination. Three specific next steps would constitute responsible follow-through:
Investment decisions should integrate multiple perspectives, including personal financial circumstances, risk tolerance, and professional advice where appropriate.
For investors who want to move beyond a single ratio and build a structured multi-method framework, our dedicated guide to share valuation methods for ASX stocks walks through the full sequence: P/S screening, EV/EBITDA benchmarking, DCF modelling, and DDM where applicable, with worked examples that show how each method catches blind spots the others miss.
This article is for informational purposes only and should not be considered financial advice. Investors should conduct their own research and consult with financial professionals before making investment decisions. Past performance does not guarantee future results. Financial projections are subject to market conditions and various risk factors.
The price-to-sales ratio divides a company's market capitalisation by its trailing twelve-month revenue, showing how much investors pay per dollar of revenue. For Netwealth, a P/S of 21.24x means the market is currently paying approximately $21.24 for every dollar of revenue the platform generates.
Netwealth shares have declined roughly 14.5% since the start of 2025, while funds under administration have grown from approximately $89 billion to $125.8 billion over the same period. The share price decline reflects market-driven repricing, while the business itself has continued to expand through net inflows and market appreciation.
Netwealth trades at a forward P/E of approximately 40x compared to HUB24's approximately 32x, with the premium reflecting Netwealth's generally stronger margin profile and higher operating leverage rather than a simple difference in growth rates.
The P/S ratio does not capture profitability trajectory, dividend income, technology cost cycle risk, or the sensitivity of fee revenue to equity market downturns. A complete valuation of Netwealth should also incorporate earnings-based ratios and a discounted cash flow analysis with explicit assumptions about FUA growth and margins.
Investors should verify current dividend data at Netwealth's investor centre or via ASX filings, obtain updated broker consensus price targets from a research service, and review or commission a DCF model that makes explicit assumptions about FUA growth rates and margin trajectory before reaching a valuation conclusion.