VAE Review: 2,100 Asian Stocks, One Chipmaker at 13.6%
48 mins ago

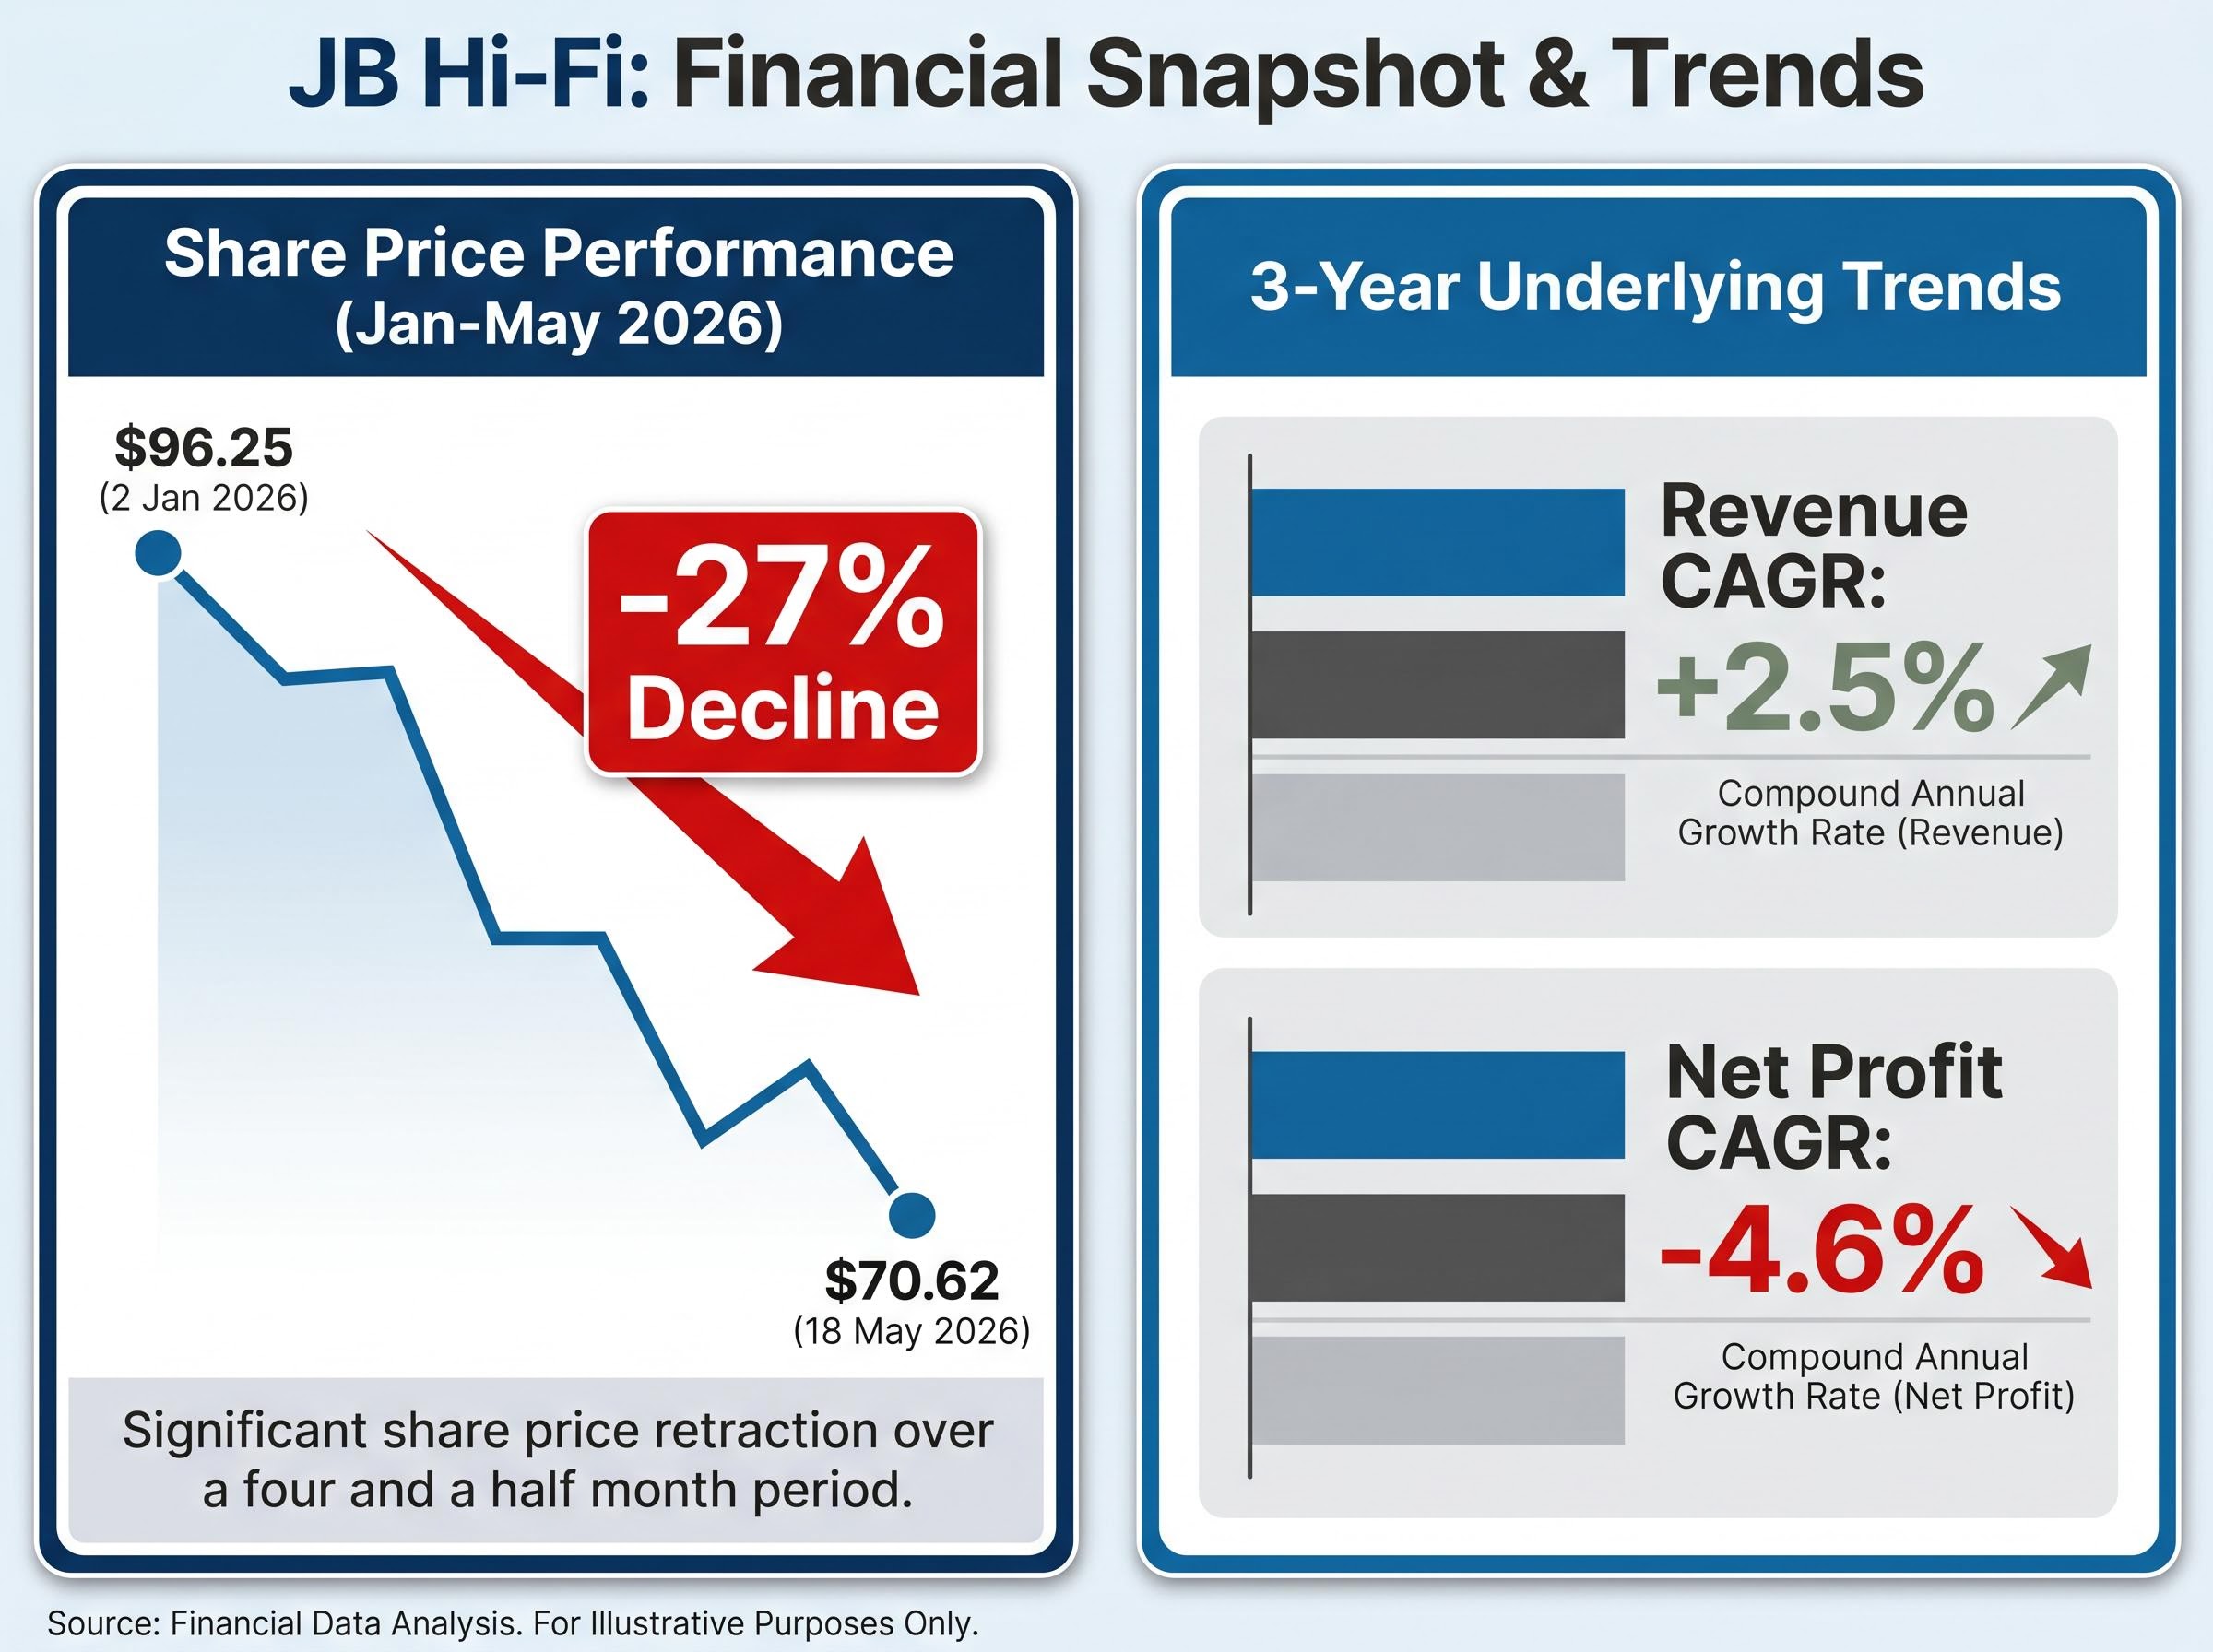
JB Hi-Fi shares have fallen roughly 27% since the start of 2026, dropping from approximately $96.25 to $70.62. A decline of that magnitude in one of the ASX’s most widely held retailers forces a straightforward question: is this a business in genuine trouble, or a quality operator caught in a cyclical downdraft that the share price is now overcorrecting for?
The drop has not arrived without explanation. Slowing comparable sales, declining net profit, and management’s own language about “heightened value consciousness” and a “competitive and promotional retail environment” all point to real earnings pressure. These are not vague macro excuses. They are showing up in the reported numbers.
What follows is a structured walk through six financial metrics drawn from JB Hi-Fi’s most recent results: revenue trajectory, gross margin, net profit trend, net debt position, debt-to-equity ratio, and return on equity. Together, they offer retail investors an evidence-grounded basis for forming a view on the selloff rather than reacting to price movement alone.
The arithmetic is blunt. From approximately $96.25 on 2 January 2026 to $70.62 on 18 May 2026, JB Hi-Fi shares have shed roughly 26.6-27.3% of their value. That is the kind of drawdown that typically accompanies either a material deterioration in business quality or a sharp repricing of future earnings expectations.
Both narratives have supporters. One camp sees a well-run retailer whose fundamentals are deteriorating in line with the price; the other sees a quality franchise being de-rated by cyclical pessimism that will eventually reverse. The Q3 FY26 sales update, released on 6 May 2026, offered ammunition for both sides: nine-month group sales growth of +2.3% versus the prior corresponding period is not collapse, but it is not the kind of momentum that justifies a premium multiple either.
“Heightened value consciousness” and a “competitive and promotional retail environment” — JB Hi-Fi Q3 FY26 trading update, 6 May 2026
The decline has not occurred in isolation. Sector commentary throughout early 2026 has grouped JB Hi-Fi alongside Harvey Norman as retailers bearing the brunt of subdued household goods spending and post-pandemic demand normalisation. Before examining the six metrics, investors need to determine what kind of decline they are evaluating: a health check or a crisis audit. The answer shapes how every number that follows should be read.
ASX market breadth deteriorated sharply in the week ending 1 May 2026, with Consumer Discretionary contributing seven new 52-week lows, the most of any sector, and the Westpac-Melbourne Institute Consumer Sentiment Index collapsing to 80.1, its steepest single-month fall since COVID-19; these signals confirm that JB Hi-Fi’s price action is not an isolated de-rating but part of a measurable, sector-wide repricing.
The RBA Statement on Monetary Policy confirms that elevated interest rates continue to weigh on interest-sensitive components of private demand, including household consumption, providing the macroeconomic backdrop against which JB Hi-Fi’s subdued comparable sales figures must be read.
JB Hi-Fi’s most recently reported annual revenue of $9,592 million and a three-year revenue compound annual growth rate (CAGR) of 2.5% tell a story that is underwhelming but not alarming in isolation. Low-single-digit top-line growth in a mature consumer electronics retailer is not a distress signal.
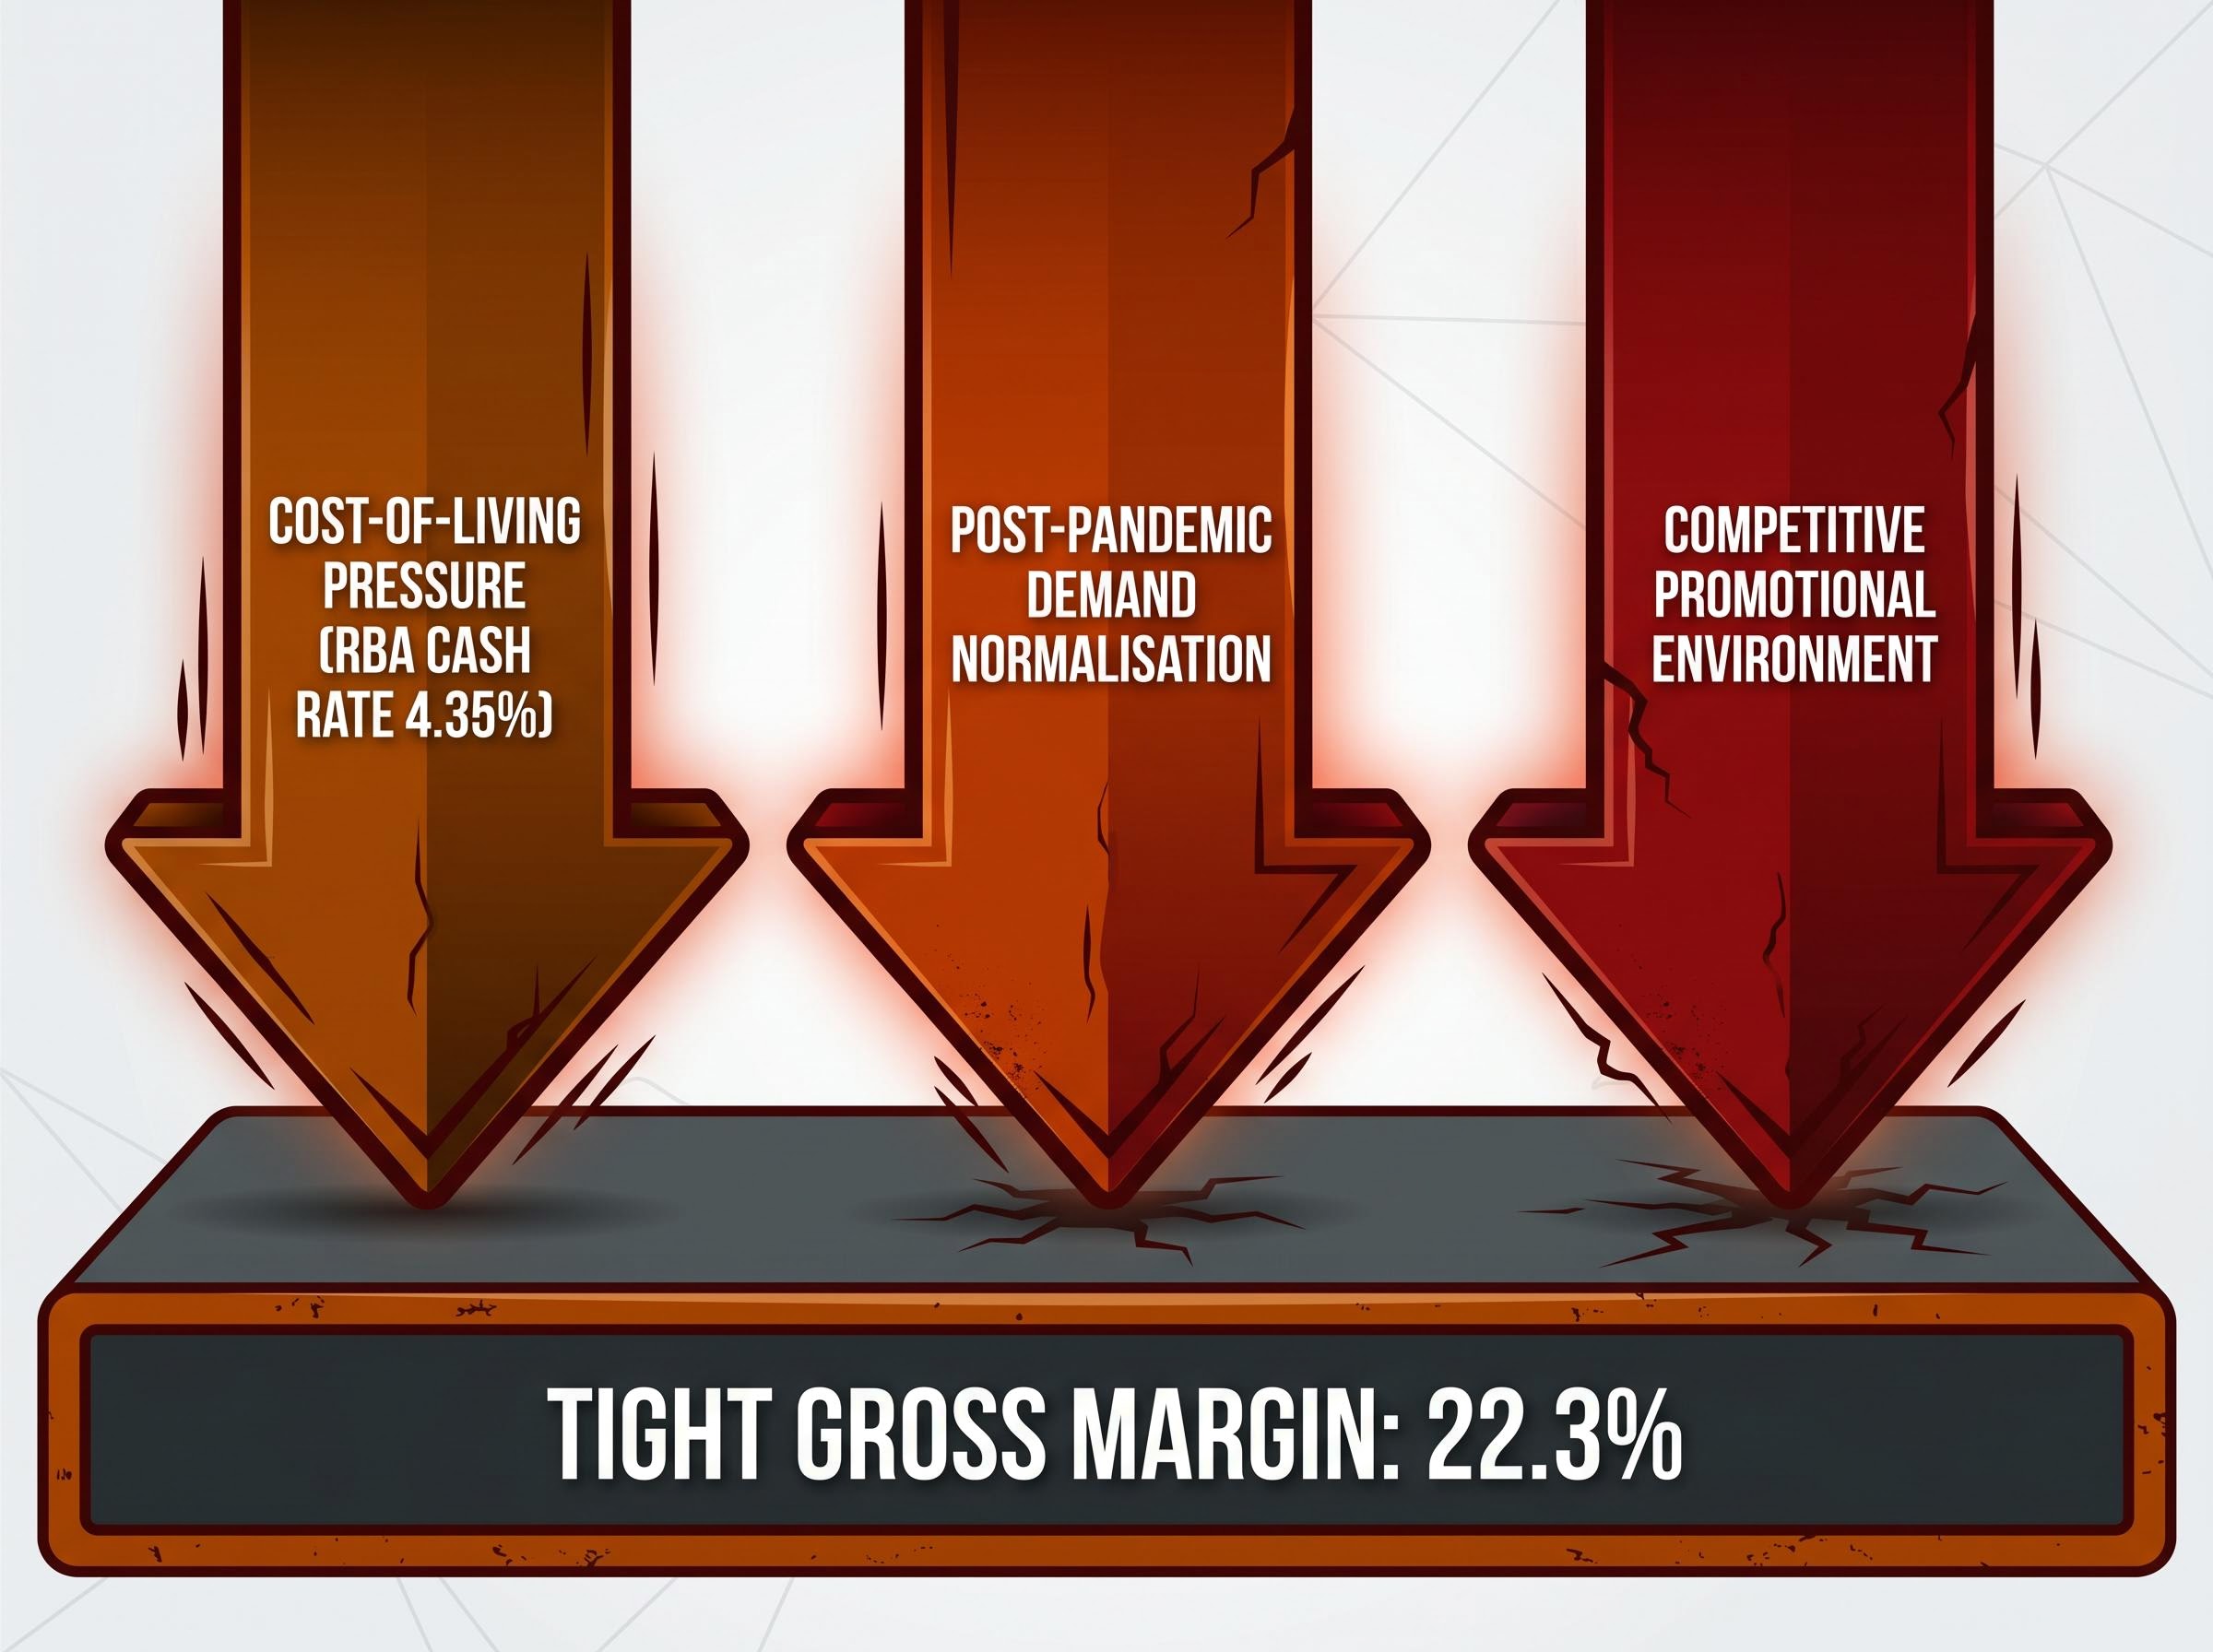
The margin underneath it is where the concern sharpens. A gross margin of 22.3%, the most recently disclosed figure, is a product of JB Hi-Fi’s deliberate price-leadership model. That model compresses gross margin by design in exchange for volume and market share. The problem is that further compression from this already tight base has disproportionate consequences for profitability.
The HY26 results, released on 15 February 2026, flagged the specific forces pushing the margin lower:
Divisional performance in the Q3 FY26 update reinforced the picture. JB Hi-Fi Australia posted comparable sales of +0.8% for the nine months to 31 March 2026. The Good Guys reported marginally negative comparable sales over the same period.
| Metric | Most recent reporting period | Three-year trend |
|---|---|---|
| Annual revenue | $9,592 million | CAGR of 2.5% |
| Gross margin | 22.3% | Under downward pressure |
Revenue growth at 2.5% per year is sustainable if margin holds. The margin is not holding. That combination is what shifts the earnings pressure from purely cyclical to potentially structural.
These two metrics are often cited together, but they measure different things. Understanding the distinction is the difference between reading JB Hi-Fi’s financials at the surface and reading them with depth.
The calculation logic works in two steps:
Applied to JB Hi-Fi, the numbers tell a pointed story. A gross margin of 22.3% is a structural feature of the price-leadership retail model; it has always been tight. The more telling metric is the net profit trajectory: from $506 million three years ago to $439 million most recently, a three-year net profit CAGR of negative 4.6%. Operating costs are growing faster than revenue.
Long-term context: JB Hi-Fi’s earnings per share CAGR since listing stands at 17.9%, as cited in the 2025 AGM presentation on 28 October 2025. The current negative profit trajectory represents a sharp departure from the company’s own long-term compounding record.
Many retail investors track revenue without understanding that margin is where the value story lives. A company can grow the top line and still destroy shareholder value if its margins are compressing. This framework applies well beyond JB Hi-Fi to any retailer an investor chooses to analyse.
The six metrics examined here, revenue, gross margin, net profit, net debt, debt-to-equity, and return on equity, map directly onto the fundamental analysis metrics that form the core framework for reading any listed company’s financial health; the distinction between gross margin and net profit margin, in particular, is the lens that separates surface-level revenue tracking from a genuine understanding of where value is created or lost.
The income statement is where the bad news has concentrated. The balance sheet tells a more complicated story, and ultimately a more important one for assessing whether JB Hi-Fi can absorb this cyclical pressure without lasting damage.
Net debt of $340 million and a debt-to-equity ratio of 42.2% are moderate figures. Equity exceeds debt obligations, which provides a meaningful structural buffer in an environment where costs are rising and earnings are declining. This is not a leveraged retailer approaching covenant pressure. It is a conservatively financed business with room to manoeuvre through a downturn.
Return on equity (ROE), the measure of how much profit a company generates relative to the capital shareholders have invested, stood at 29.5% in FY24. An ROE above 20% typically signals efficient capital deployment, and this metric has historically been part of the justification for brokers accepting a price-to-earnings (P/E) ratio of approximately 17-18x for JB Hi-Fi, according to an IG Bank analysis.
The 2025 AGM presentation, released on 28 October 2025, emphasised “cost discipline and operational productivity” as ongoing management priorities.
| Metric | Value | Interpretation |
|---|---|---|
| Net debt | $340 million | Moderate; equity exceeds debt |
| Debt-to-equity ratio | 42.2% | Conservative for a retailer |
| Return on equity (FY24) | 29.5% | Strong, but trailing indicator |
One qualification matters here. The 29.5% ROE is an FY24 figure. If net profit continues declining through FY25 and FY26, ROE will follow. Investors should treat it as a trailing indicator of historical capital efficiency rather than a guarantee of current performance. The balance sheet metrics separate a cyclically stressed retailer from a structurally impaired one. JB Hi-Fi looks like the former, but only if the profit decline stabilises.
Before attributing the selloff entirely to company-specific weakness, investors should consider three structural headwinds operating simultaneously across the sector:
These are not abstract macro observations. They show up directly in JB Hi-Fi’s own reported language and numbers. The Q3 FY26 update disclosed group sales growth of just +2.3% for the nine months to 31 March 2026, with JB Hi-Fi Australia posting comparable sales of +0.8% and The Good Guys recording marginally negative comparable sales.
“Cost-of-living pressures”, “heightened value consciousness”, and a “competitive and promotional retail environment” — JB Hi-Fi Q3 FY26 trading update, 6 May 2026
The RBA’s prior rate hiking cycle, which took the cash rate to 4.35%, left mortgage repayments elevated and disposable incomes compressed. Electronics and home appliance retailers, JB Hi-Fi and Harvey Norman in particular, have been consistently cited in sector commentary as among the most sensitive to this dynamic. Wire service and press coverage throughout early 2026 has grouped these names together under the theme of “subdued household goods spending” and “waning demand for TVs, computers and appliances.”
Australia’s headline GDP of 2.6% in Q4 2025 obscures a per capita recession, with real household consumption compressed by elevated mortgage repayments and a Westpac-Melbourne Institute consumer confidence reading of 80.1 in April 2026, its weakest since 1973, conditions that directly explain why management language about ‘heightened value consciousness’ is not corporate spin but an accurate description of the spending environment.
The HY26 results, released on 15 February 2026, confirmed that net profit after tax declined versus the prior half, with management citing “increased promotional activity” as a direct margin headwind. This is not a company in denial about its operating environment. The question is whether the environment itself is close to a trough or still deteriorating.
The six metrics examined in this analysis, consolidated into a single view, paint a picture that is neither crisis nor clean bill of health.
| Metric | Value | Signal |
|---|---|---|
| Annual revenue | $9,592 million | Stable base |
| Revenue CAGR (3-year) | 2.5% | Soft but positive |
| Gross margin | 22.3% | Under pressure; watch closely |
| Net profit (most recent annual) | $439 million | Declining; primary concern |
| Net debt | $340 million | Manageable |
| Debt-to-equity ratio | 42.2% | Moderate |
| Return on equity (FY24) | 29.5% | Strong, but trailing |
The balance sheet and historical ROE suggest structural resilience. The profit trajectory, with a three-year CAGR of negative 4.6%, is the clearest concern. The central question the data leaves unresolved is whether the profit decline represents a cyclical trough that JB Hi-Fi’s operational quality allows it to absorb, or the beginning of a structural reset driven by permanent changes in consumer electronics demand patterns.
Qualitative broker positioning, as reflected in accessible 2026 commentary, sits at cautious-neutral. Some analysts have noted the stock appears “more reasonably valued” following the de-rating but remains exposed to cyclical earnings risk if the consumer downturn deepens. The historical P/E baseline of approximately 17-18x provides a reference point for whether current pricing reflects fair value or overcorrection.
For investors looking to go further, the next steps sit beyond this analysis:
The six metrics examined here collectively support a reading of a well-run business under cyclical pressure, not a distressed business in structural decline. The balance sheet is conservative. The historical return on equity is strong. The long-term earnings compounding record, at 17.9% EPS CAGR since listing, speaks to operational quality that predates this downturn.
The counterweight is real and present. Net profit is declining. Gross margins are compressing in a model that already runs tight. Management is openly describing an environment of heightened promotional intensity and value-conscious consumers. This reading holds only if the consumer downturn does not deepen materially from here.
Investors forming a view should examine the full results PDFs directly from JB Hi-Fi’s investor relations portal, compare current valuation multiples against the 17-18x historical P/E baseline via CommSec or Morningstar, and weigh peer positioning against Harvey Norman and Nick Scali before reaching a conclusion.
For investors who want a structured framework for making that determination across any stock, not just JB Hi-Fi, our dedicated guide to classifying stock market selloffs walks through a three-category test covering irrational overreaction, temporary setback, and structural disruption, with worked examples from Netflix, Texas Roadhouse, and Kodak that illustrate how the classification changes both the investment thesis and the appropriate position-sizing response.
This article is for informational purposes only and should not be considered financial advice. Investors should conduct their own research and consult with financial professionals before making investment decisions. Past performance does not guarantee future results.
JB Hi-Fi shares have dropped roughly 27% from approximately $96.25 in January 2026 to $70.62 by mid-May 2026, driven by slowing comparable sales, declining net profit, compressed gross margins, and broader sector headwinds including cost-of-living pressure and post-pandemic demand normalisation across consumer electronics.
Return on equity (ROE) measures how much profit a company generates relative to the capital shareholders have invested; JB Hi-Fi recorded an ROE of 29.5% in FY24, a figure that typically signals efficient capital deployment, though investors should note this is a trailing indicator that will decline if net profit continues falling.
Gross margin measures income remaining after subtracting the cost of goods sold from revenue, while net profit margin is what remains after all operating costs, depreciation, interest, and tax are also deducted; for JB Hi-Fi, gross margin sits at 22.3% but net profit has declined from $506 million to $439 million over three years, indicating operating costs are growing faster than revenue.
JB Hi-Fi holds net debt of $340 million and a debt-to-equity ratio of 42.2%, figures considered moderate and conservative for a retailer, meaning equity exceeds debt obligations and the company retains a meaningful structural buffer even as earnings decline.
Three key headwinds are weighing on JB Hi-Fi: cost-of-living pressure compressing household budgets, post-pandemic normalisation lengthening replacement cycles for electronics and appliances, and a competitive promotional environment that forces heavy discounting to maintain volume, all of which are reflected directly in the company's own Q3 FY26 trading update language.