
While public equity investors spent the early months of 2025 debating rate-cut timelines and geopolitical risk, two of the world’s most closely watched alternative asset managers delivered results that told a different story. KKR reported fee-related earnings of $823 million in Q1 2025, up approximately 23% year-on-year on $664 billion in assets under management. Macquarie Group posted a 49% profit surge to A$7.22 billion for its financial year ending 31 March 2025, its second-largest annual profit on record. These are not isolated data points. They arrived as global alternatives AUM crossed $16.3 trillion and as a structural shift in how capital flows into private markets gained momentum. What follows is an analysis of what drove these results, how the fee-based earnings model scales, what structural forces support it, and what the combined picture means for investors assessing the alternatives sector.
KKR’s quarter in numbers: earnings growth that outpaced AUM growth
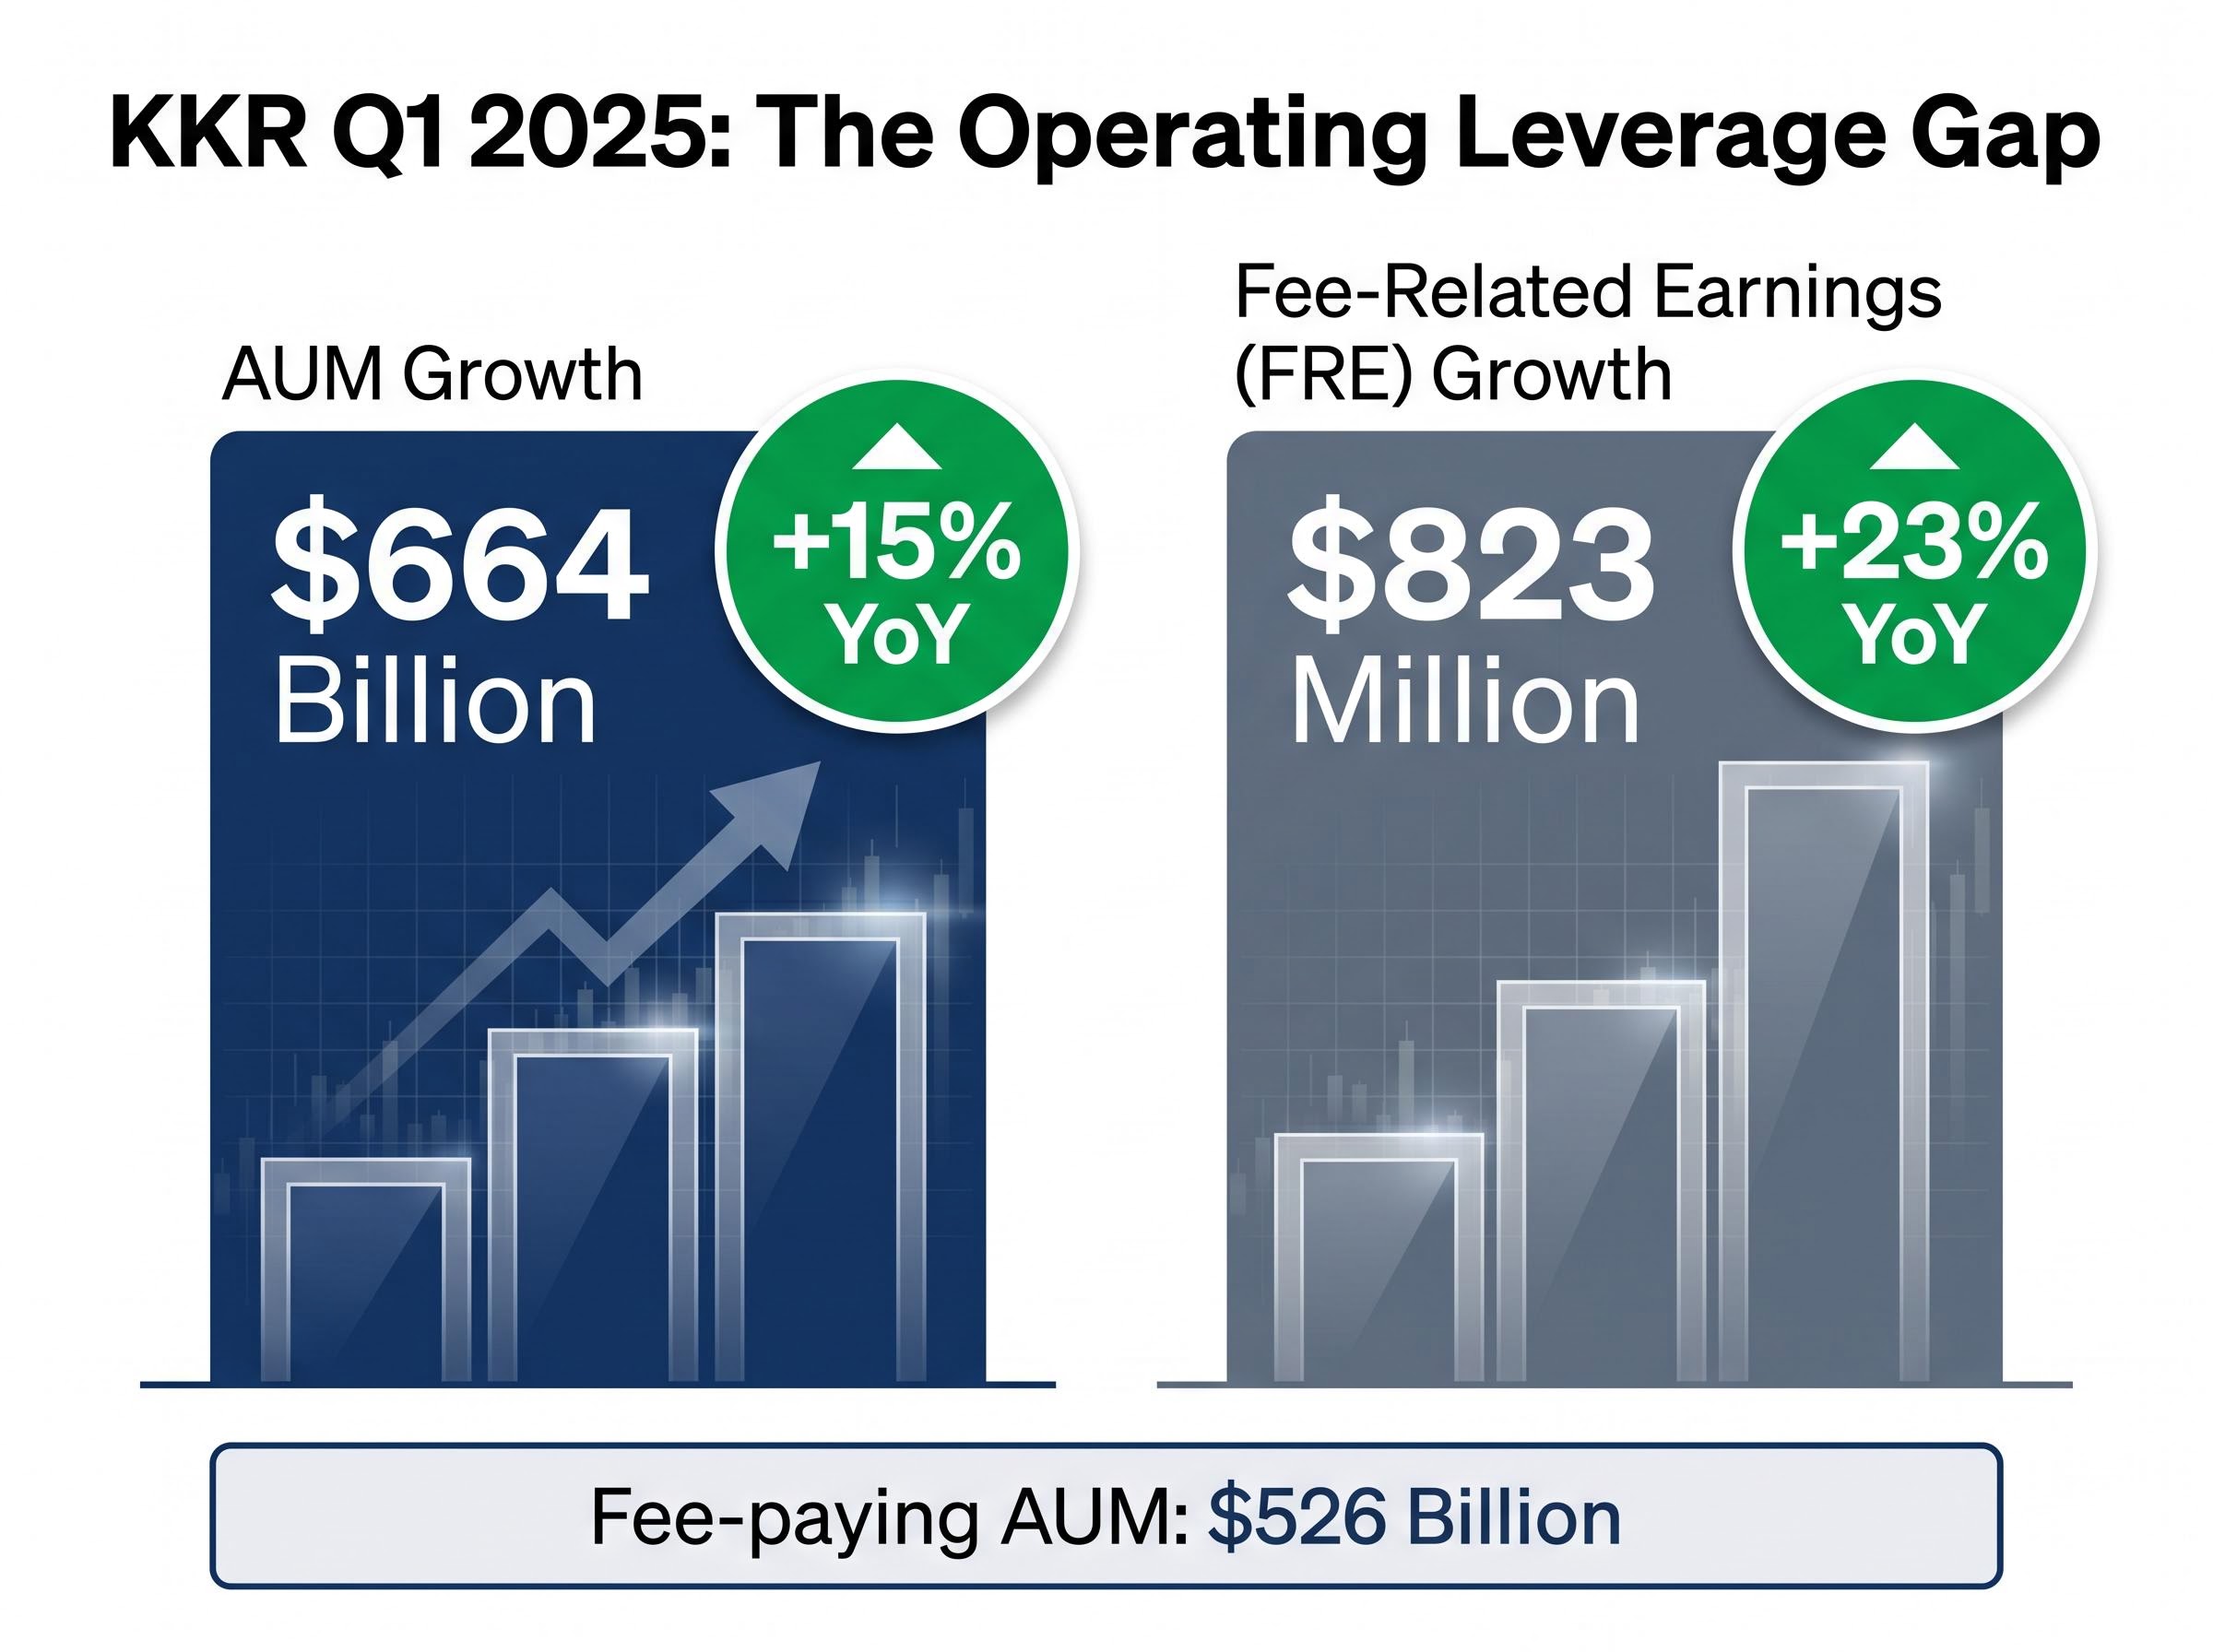
The headline metrics from KKR’s Q1 2025 tell one story. The ratio between them tells a more interesting one.
- Fee-related earnings (FRE): $823 million, up approximately 23% YoY
- AUM: $664 billion, up 15% YoY; fee-paying AUM at $526 billion
- New capital raised in Q1 2025: approximately $31 billion
- Uncalled commitments (dry powder): approximately $116 billion
Management fees rose approximately 30% year-on-year. The full-year 2024 baseline, after-tax distributable earnings of $3.77 billion (a record), had already set a high bar. Q1 2025 cleared it.
Fee-related earnings grew at 23% against AUM growth of 15%. That gap is not noise. It is operating leverage becoming visible in the numbers: incremental AUM generating fee revenue at a rate that outpaces the growth of the asset base itself.
The gap between fee-related earnings growth and AUM growth that KKR reported in Q1 2025 is exactly the kind of signal that headline earnings report analysis tends to miss; a seven-step framework covering revenue quality, GAAP versus non-GAAP gaps, free cash flow alignment, and margin direction provides a more reliable basis for distinguishing genuine operating leverage from flattering optics.
The $31 billion raised in a single quarter, combined with $116 billion in dry powder, signals more than current-period strength. It points to deployment capacity across infrastructure, private credit, and real estate in the quarters ahead. For investors, the forward indicators in KKR’s report may matter as much as the earnings line.
When big ASX news breaks, our subscribers know first
Inside Macquarie’s FY2025: how all four divisions moved in the same direction
Macquarie’s FY2025 result was striking not only for its size but for where the growth came from. All four divisions posted profit increases simultaneously, an uncommon outcome for a diversified financial group and itself a signal worth examining.
The Macquarie Group’s FY25 result announcement confirmed net profit after tax attributable to ordinary shareholders of A$3,715 million for the year ended 31 March 2025, with the group-level figure rising to A$7.22 billion when measured on a broader profit basis that captured performance across all four operating divisions.
| Division | FY2025 NPAT Growth | Characterisation |
|---|---|---|
| Commodities & Global Markets (CGM) | +66% | Cyclical |
| Macquarie Asset Management (MAM) | +39% | Structural |
| Macquarie Capital | +40% | Mixed |
| Banking & Financial Services (BFS) | +18% | Structural |
The debate among analysts centres on how to weight these divisions in a forward view. UBS maintained a Buy rating with a target of A$245. Morgan Stanley reiterated Overweight at A$250. JPMorgan lifted its target to A$255, citing diversified earnings and the infrastructure pipeline. The bulls point to MAM’s structural fee growth and BFS lending expansion as durable earnings foundations.
The sceptic case rests on CGM.
Citi, which maintained a Neutral rating with a target of A$220, characterised FY2025 CGM earnings as “cyclical peak-like,” warning of normalisation over the next two to three years.
Understanding which parts of Macquarie’s earnings are structurally supported, and which are likely to mean-revert, is the analytical question the divisional breakdown is designed to answer. Institutional commentary has framed the group as “a structural beneficiary of decarbonisation and private markets growth,” but the CGM contribution remains the variable that separates bullish from cautious positioning.
The economics of funds management: fixed costs, rising revenue, and widening margins
The KKR and Macquarie results share a feature that is easy to overlook in headline profit figures: fee-based earnings grew faster than the asset bases generating them. That pattern is not accidental. It reflects a structural characteristic of funds management businesses that operates differently from most other industries.
- The fixed-cost base: An investment team, compliance infrastructure, technology platform, and distribution network represent substantial upfront costs. These costs do not double when AUM doubles.
- Incremental AUM on top: Each additional dollar of assets under management generates management fee revenue with minimal additional cost. The team, the systems, and the regulatory infrastructure are already in place.
The shift from carry to fee-related earnings and why it changes the valuation story
Public markets have historically applied a discount to carry-dependent earnings, the performance fees that alternative managers collect when they sell assets at a profit. Carry is lumpy, hard to forecast, and tied to exit market conditions that no manager fully controls.
The shift underway at firms like KKR is deliberate. Q1 2025 FRE of $823 million reflects years of building a business model oriented toward recurring, AUM-based management fees rather than episodic performance fees. Macquarie’s MAM division, with NPAT up 39% in a growing AUM environment, illustrates the same principle from the Australian side of the market.
McKinsey’s Global Private Markets Review noted that private markets AUM grew at approximately 12% annually from 2018 to 2023, with high-single-digit annual growth projected through the late 2020s. For managers whose cost structures are largely fixed, that growth rate compounds into fee earnings growth that consistently outpaces the asset base.
McKinsey’s Global Private Markets Review documented that private markets AUM grew at approximately 12% annually from 2018 to 2023, with the fee revenue that large managers extract from that base expanding faster still, a pattern consistent with the operating leverage dynamic visible in both KKR’s and Macquarie’s reported numbers.
Investors who understand this dynamic are better positioned to assess whether a large alternative manager appears expensive or cheap relative to its forward earnings trajectory. The price-to-earnings multiple alone does not capture it; the fee-related earnings growth rate relative to AUM growth is the more informative metric.
The structural forces that make this growth durable
KKR and Macquarie operate at the intersection of several industry-wide tailwinds. These are not management-specific advantages; they are structural forces reshaping how capital is intermediated globally.
Retailisation as the next wave of AUM growth
The alternatives industry was built on institutional capital: pension funds, sovereign wealth funds, endowments. The next growth wave is retail. McKinsey’s 2025 review projects that retail capital could account for up to half of new alternatives inflows over the next decade.
Firms including KKR, Blackstone, and Apollo have launched semi-liquid products (interval funds, non-traded REITs, private credit vehicles) aimed at high-net-worth and mass affluent investors. These products open a capital pool that was previously inaccessible. They also carry product-design risks, particularly around liquidity mismatch, that regulators and analysts have flagged.
The four primary structural growth drivers, each anchored in industry data:
- Retailisation: McKinsey projects retail investors could supply up to 50% of new alternatives inflows over the coming decade
- Private credit expansion: AUM reached approximately $1.8 trillion in 2024 and is projected by Preqin to exceed $2.5 trillion by 2028, driven by bank disintermediation
- Infrastructure and energy transition: Infrastructure AUM reached $1.2 trillion in 2024, with approximately $160 billion in global fundraising skewing toward energy transition and digital infrastructure
- Insurance and permanent capital: Large managers continue acquiring or partnering with insurers, expanding permanent capital bases that generate stable, long-duration fee streams
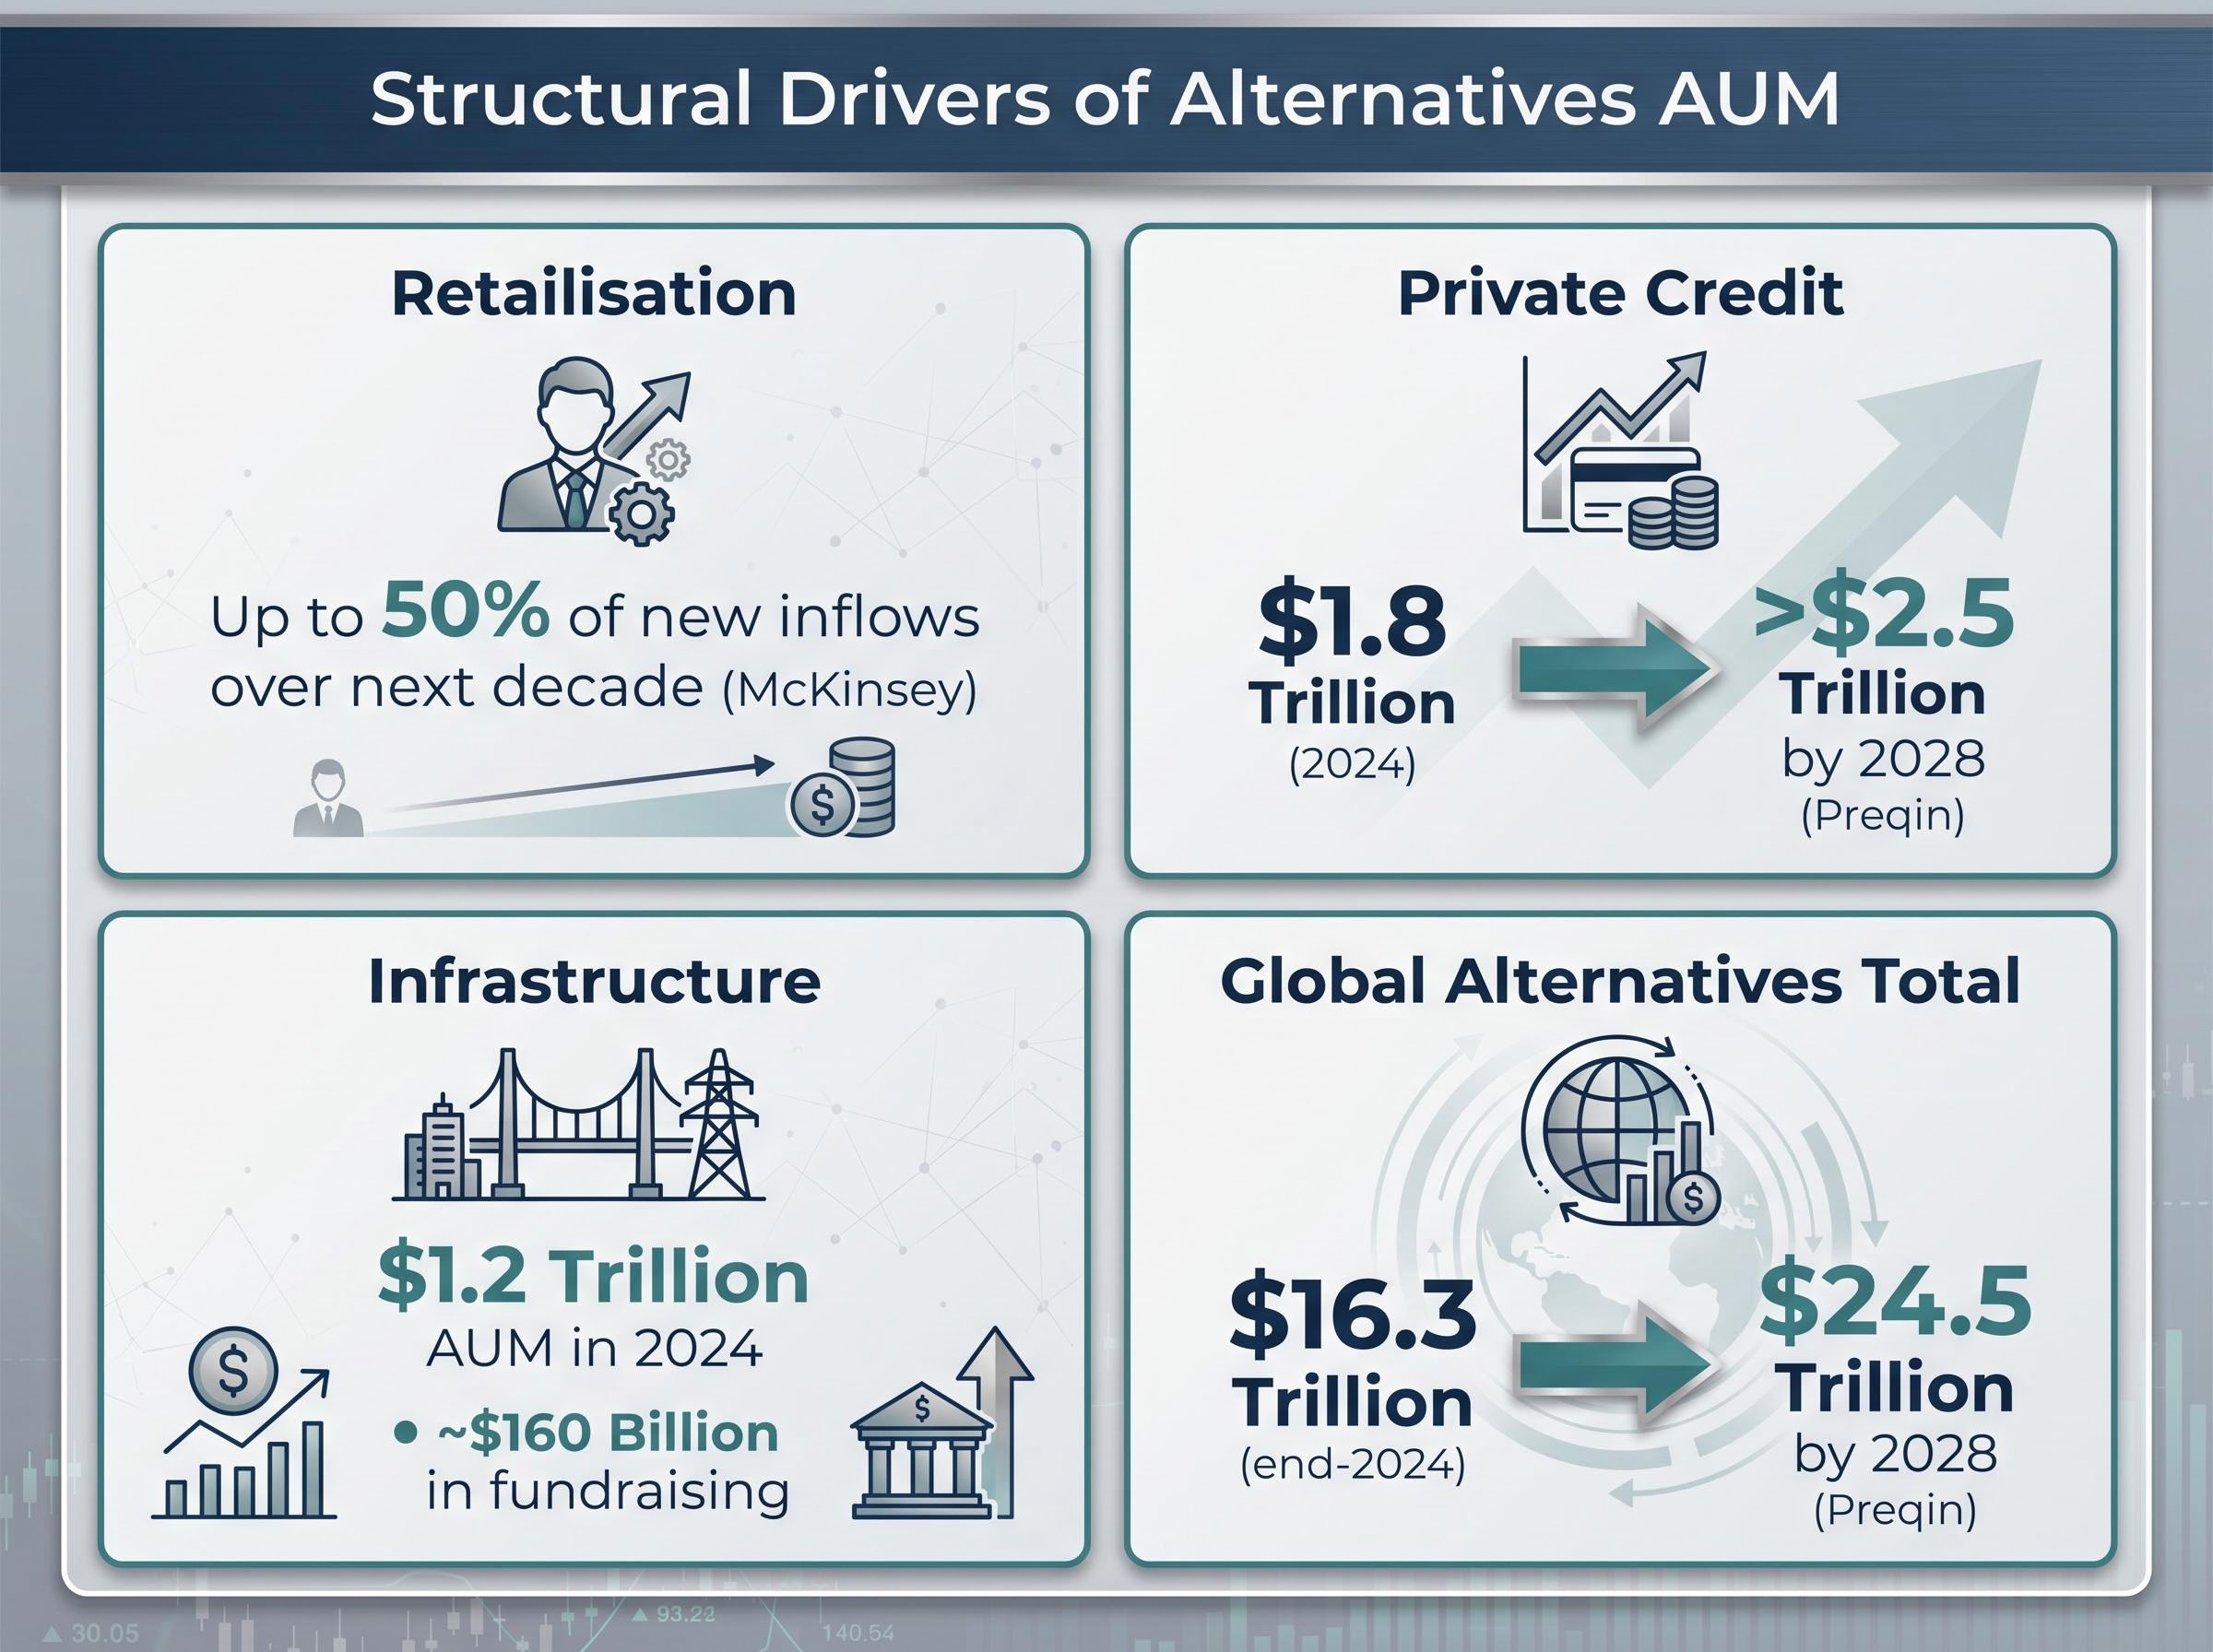
KKR’s $116 billion in dry powder signals deployment capacity across several of these themes. The total global alternatives AUM figure, $16.3 trillion at end-2024, is projected by Preqin to reach $24.5 trillion by 2028.
The private capital quality drain visible in small-cap public indices is one consequence of the same structural force driving AUM growth at managers like KKR and Macquarie: the best-growth companies increasingly remain private for longer, deepening the pool of assets available to private market managers while simultaneously reducing the quality available to passive public equity investors.
Headwinds that strong results cannot wish away
Three sections of evidence supporting a structural growth thesis require a corresponding examination of the constraints that could slow or interrupt it. These are not theoretical concerns. Each is visible in current data.
- Rate-driven valuation pressure on exits: Elevated base rates and tighter financing conditions are compressing deal leverage and pressuring exit valuations, particularly for growth-oriented portfolio companies. Slower realisations and lower carried interest remain a near-term headwind as exit markets stay subdued.
- LP liquidity constraints: McKinsey’s 2025 review noted that net distributions to investors have been negative for many private equity funds across 2023-2024, constraining limited partners’ capacity to re-commit. This “denominator effect” reduces the reinvestment pool.
- Regulatory and political scrutiny: Increased US and European scrutiny of private equity ownership in healthcare, housing, and infrastructure has intensified, with proposals including enhanced reporting requirements and potential limits on certain fee structures.
- Product-design risk in semi-liquid vehicles: Vehicles such as Blackstone’s BREIT have faced redemption pressure events, exposing the liquidity mismatch between daily or monthly redemption terms and underlying illiquid assets.
Credit market deterioration in leveraged loans adds texture to the LP liquidity constraint picture: with Fitch projecting leveraged loan default rates of 4.5% to 5.0% for 2026 and the Proskauer Private Credit Default Index at 2.73% for Q1 2026, the exit market conditions that produce carried interest are under pressure from both sides of the capital structure.
For Macquarie specifically, CGM cyclicality adds a fifth dimension.
Citi’s characterisation of FY2025 CGM earnings as “cyclical peak-like” reflects a broader consensus view: normalisation of commodities trading revenues over the next two to three years is among the most frequently cited risk factors in analyst coverage of the group.
One asymmetry is worth noting. Large, diversified platforms with growing permanent capital bases and high shares of fee-related earnings carry lower exposure to these risks than smaller, carry-dependent managers who remain more sensitive to exit cycles and fundraising volatility. The risks are real for the sector as a whole, but they are not distributed evenly.
How to read the alternatives sector re-rating as an investor
The combined picture from KKR and Macquarie reflects something broader than two strong reporting periods. Public markets are re-rating large alternative managers, moving away from pricing them as cyclical, carry-dependent businesses and toward treating them as compounding fee platforms with structural growth characteristics.
The evidence supports this re-rating narrative. The S&P Listed Private Equity index outperformed broader financials in Q1 2025 following earnings beats from KKR, Blackstone, and Apollo. Net inflows into listed private equity and alternative credit ETFs (including products from Global X and Invesco) continued through Q1 2025 despite broader market volatility.
For investors wanting to position around this shift, our full explainer on the listed private equity re-rating examines how megacap concentration in public equity benchmarks is driving capital toward listed alternatives vehicles, including the ETF inflow patterns from Global X and Invesco products that accelerated through Q1 2025, and what structural limitations constrain active managers trying to replicate these exposures through traditional equity mandates.
| Dimension | Large Diversified Platforms | Smaller Carry-Dependent Players |
|---|---|---|
| Earnings stability | High FRE share; recurring management fees | Carry-dependent; lumpy, exit-cycle sensitive |
| Fundraising position | Strong capital-raising; permanent capital growing | More exposed to fundraising volatility |
| Current valuation trend | Premium re-rating; steady ETF inflows | Less premium; greater discount to NAV |
The practical implication is that not all alternative manager exposure is equivalent. Three questions help differentiate:
- What share of earnings is fee-related versus carry-dependent? A higher FRE share signals more predictable revenue.
- How large is the dry powder relative to AUM? KKR’s $116 billion in uncalled commitments against $664 billion in AUM indicates deployment runway without requiring new fundraising.
- How diversified is the business across asset classes and geographies? Firms spanning private equity, credit, infrastructure, and real estate carry less concentration risk than single-strategy managers.
Strong quarters do not last forever, but the structural shift behind them might
KKR’s Q1 2025 and Macquarie’s FY2025 results are best understood as evidence of a broader shift in how capital is being intermediated, not merely as strong single-period earnings. The fee-based model scales. The structural drivers, from retailisation to infrastructure to private credit, are supported by industry data from McKinsey, Bain, and Preqin.
Genuine uncertainty remains. CGM cyclicality, LP liquidity constraints, and subdued exit markets mean the near-term earnings path is unlikely to be linear. These risks are live and visible in the current data.
What the results clarify for investors is less about the next quarter and more about the type of business the alternatives sector is becoming. Those seeking to understand their exposure should start by identifying whether the managers in their portfolio are building durable fee-related earnings or remain heavily dependent on the pace of asset monetisation and exit markets. The distinction carries material consequences for both risk and return.
This article is for informational purposes only and should not be considered financial advice. Investors should conduct their own research and consult with financial professionals before making investment decisions. Past performance does not guarantee future results. Financial projections cited in this article are subject to market conditions and various risk factors.
—