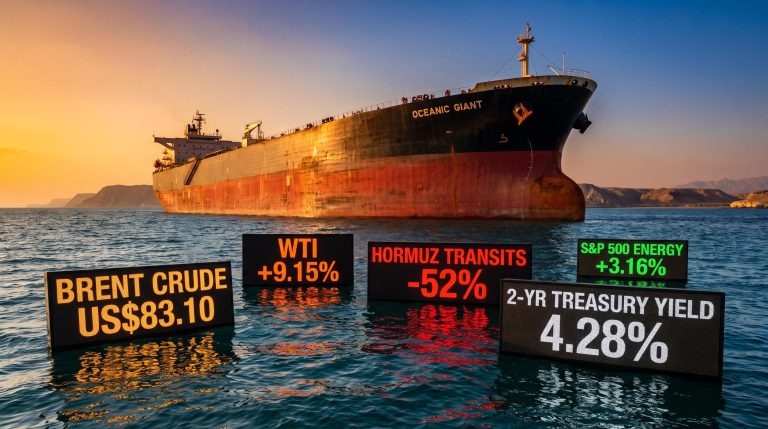
Hormuz Shipping Collapses 52% as US-Iran Clash Sends Oil Surging
5 hrs ago

At $108.66 per barrel on 19 May 2026, WTI crude posted its sharpest single-session gain in weeks, driven not by a supply disruption that finally happened but by one that was narrowly avoided and another that is quietly deepening. A planned US military strike on Iran was cancelled hours before execution after diplomatic appeals from Qatar, Saudi Arabia, and the UAE reached President Trump. In the same session, 23 tankers sat idle near Kharg Island, Iran’s primary crude export hub, and according to the International Energy Agency’s (IEA) latest data, global oil inventories were draining at 8.5 million barrels per day in Q2 2026, a pace with almost no historical precedent.
Three overlapping forces are shaping the crude oil price right now: the geopolitical hair-trigger that has persisted since February 2026, Iran’s formalised control regime over the Strait of Hormuz, and the structural supply deficit the IEA is tracking in real time. What follows maps each force and explains what it means for investors with energy exposure or those considering it.
Before the strike cancellation moved markets on 19 May, the supply picture was already extreme. The IEA’s April 2026 Oil Market Report documented a global inventory drawdown rate of 8.5 million barrels per day during Q2 2026, a figure that reflects involuntary tightening rather than healthy demand-pull consumption.
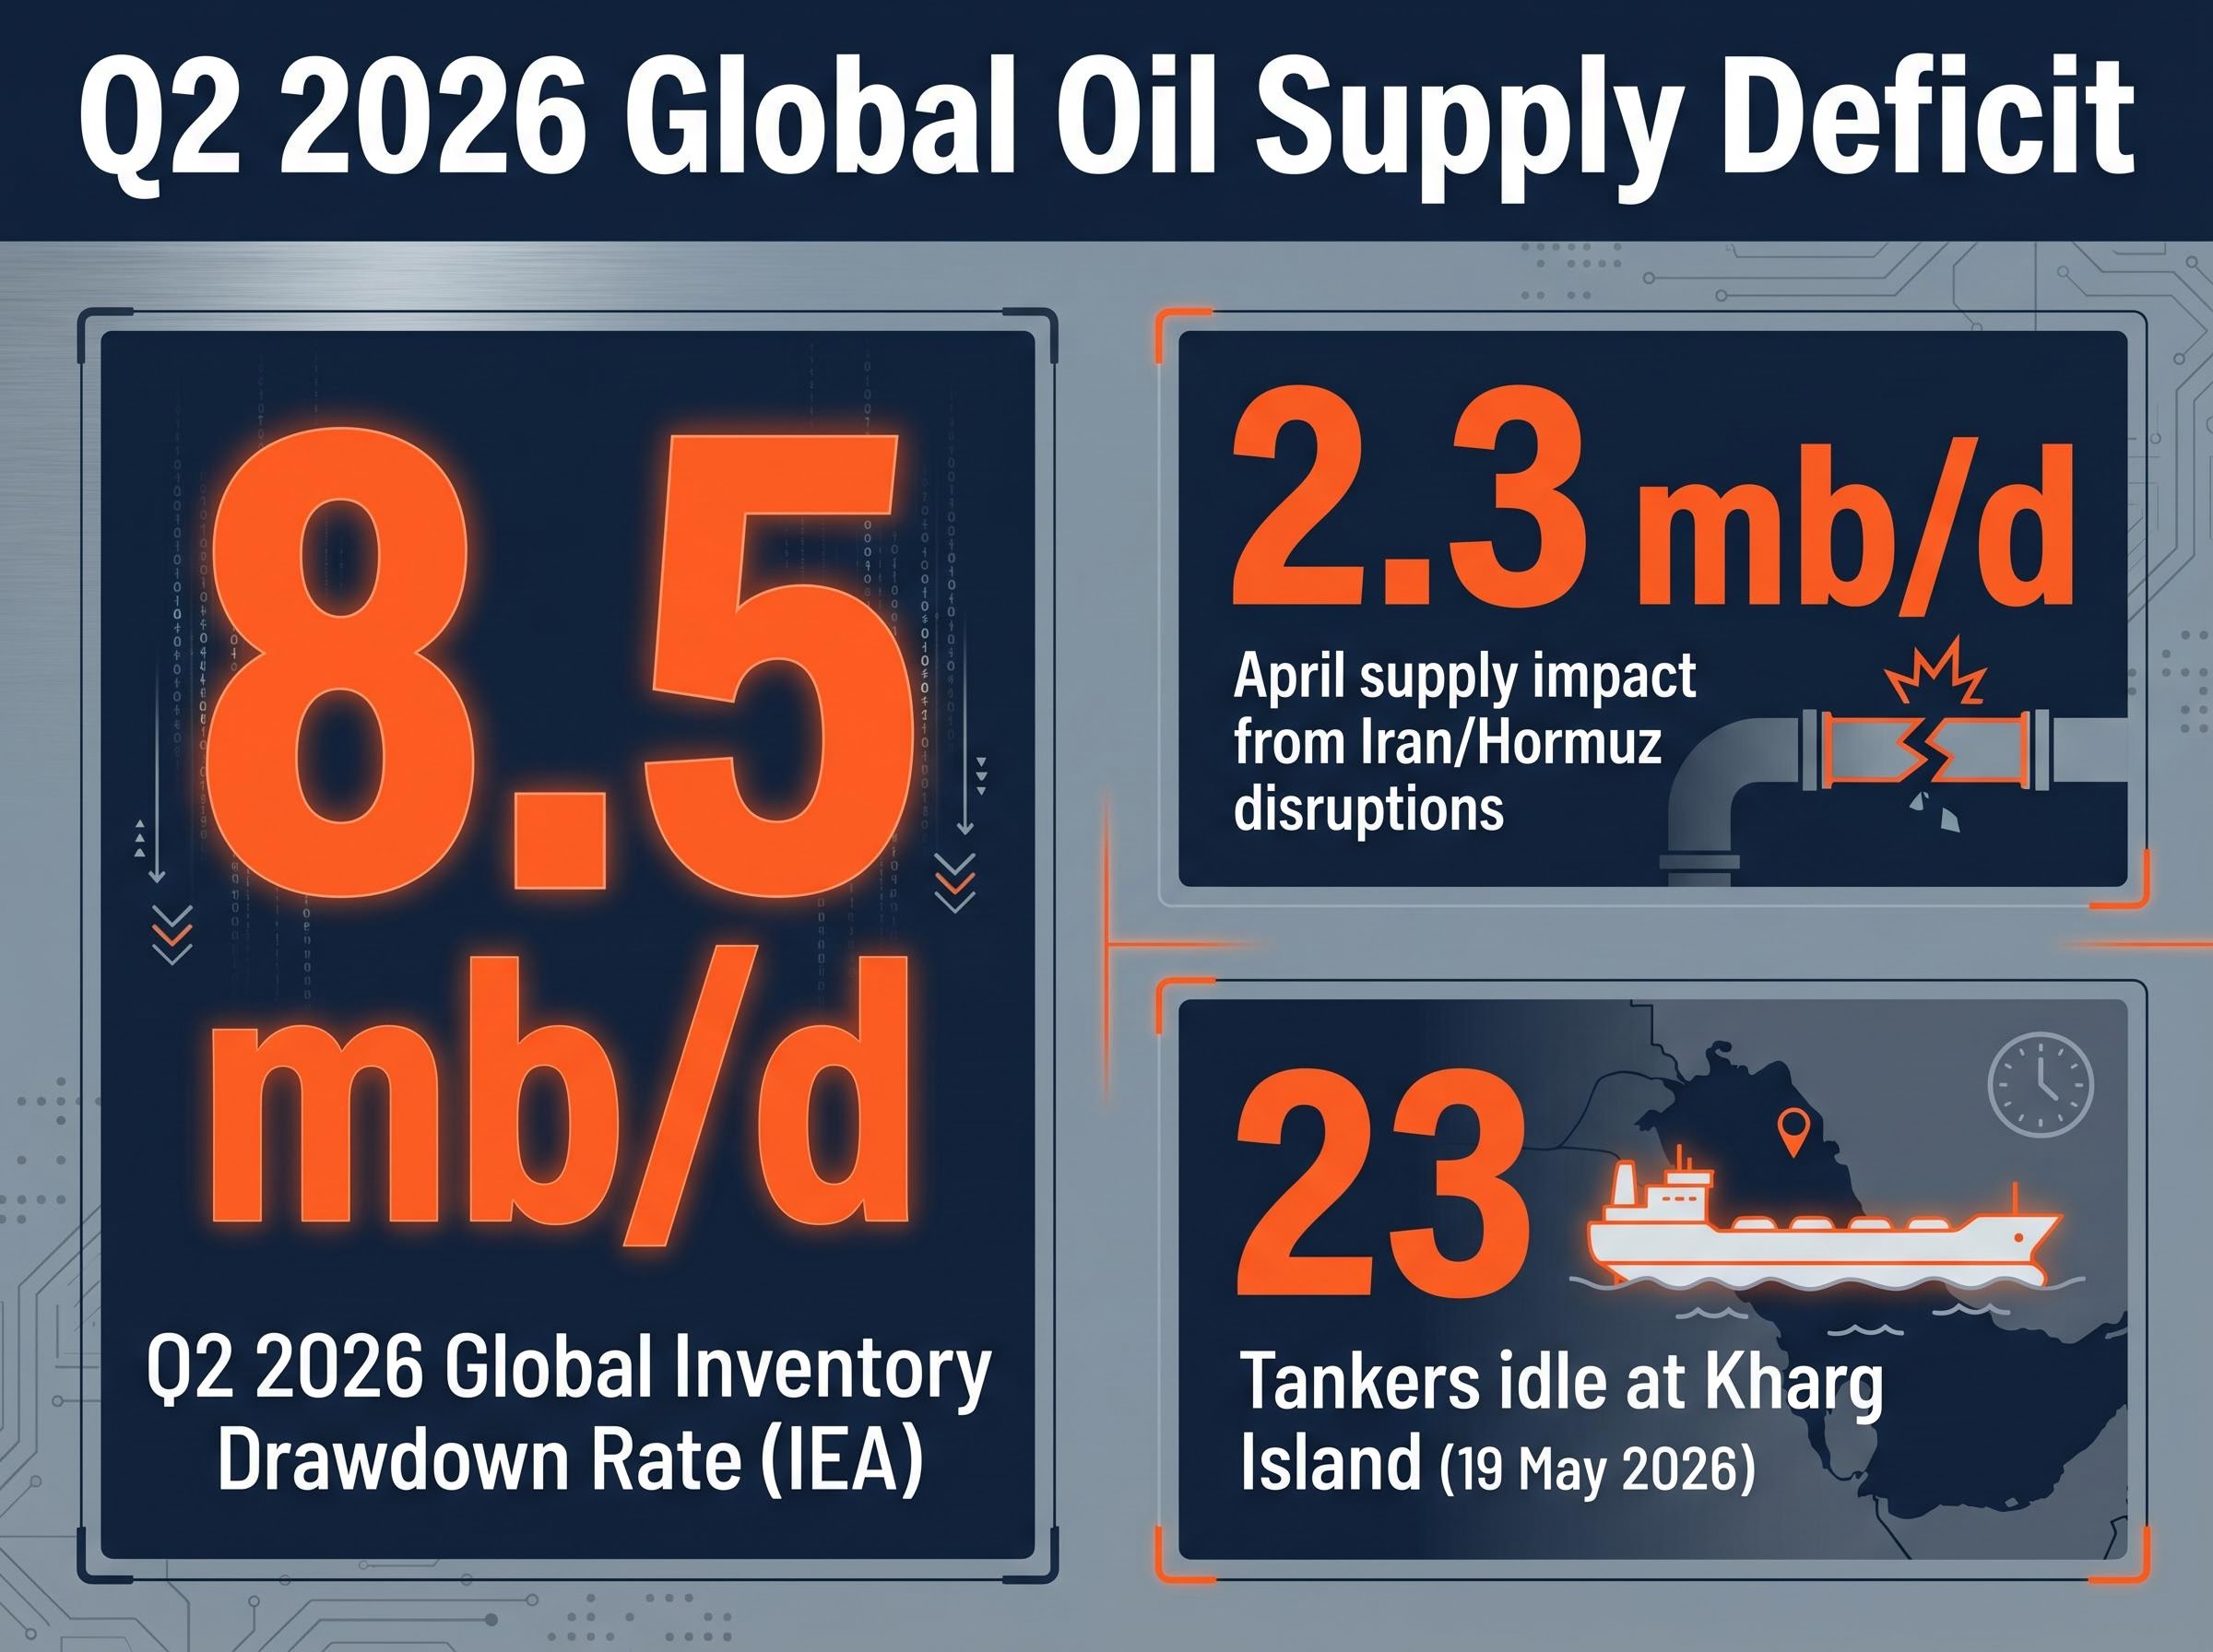
IEA April 2026 Oil Market Report: Global oil inventories are drawing down at an estimated 8.5 million barrels per day in Q2 2026, with the Iran conflict and Hormuz disruptions contributing a supply impact of approximately 2.3 mb/d in April alone.
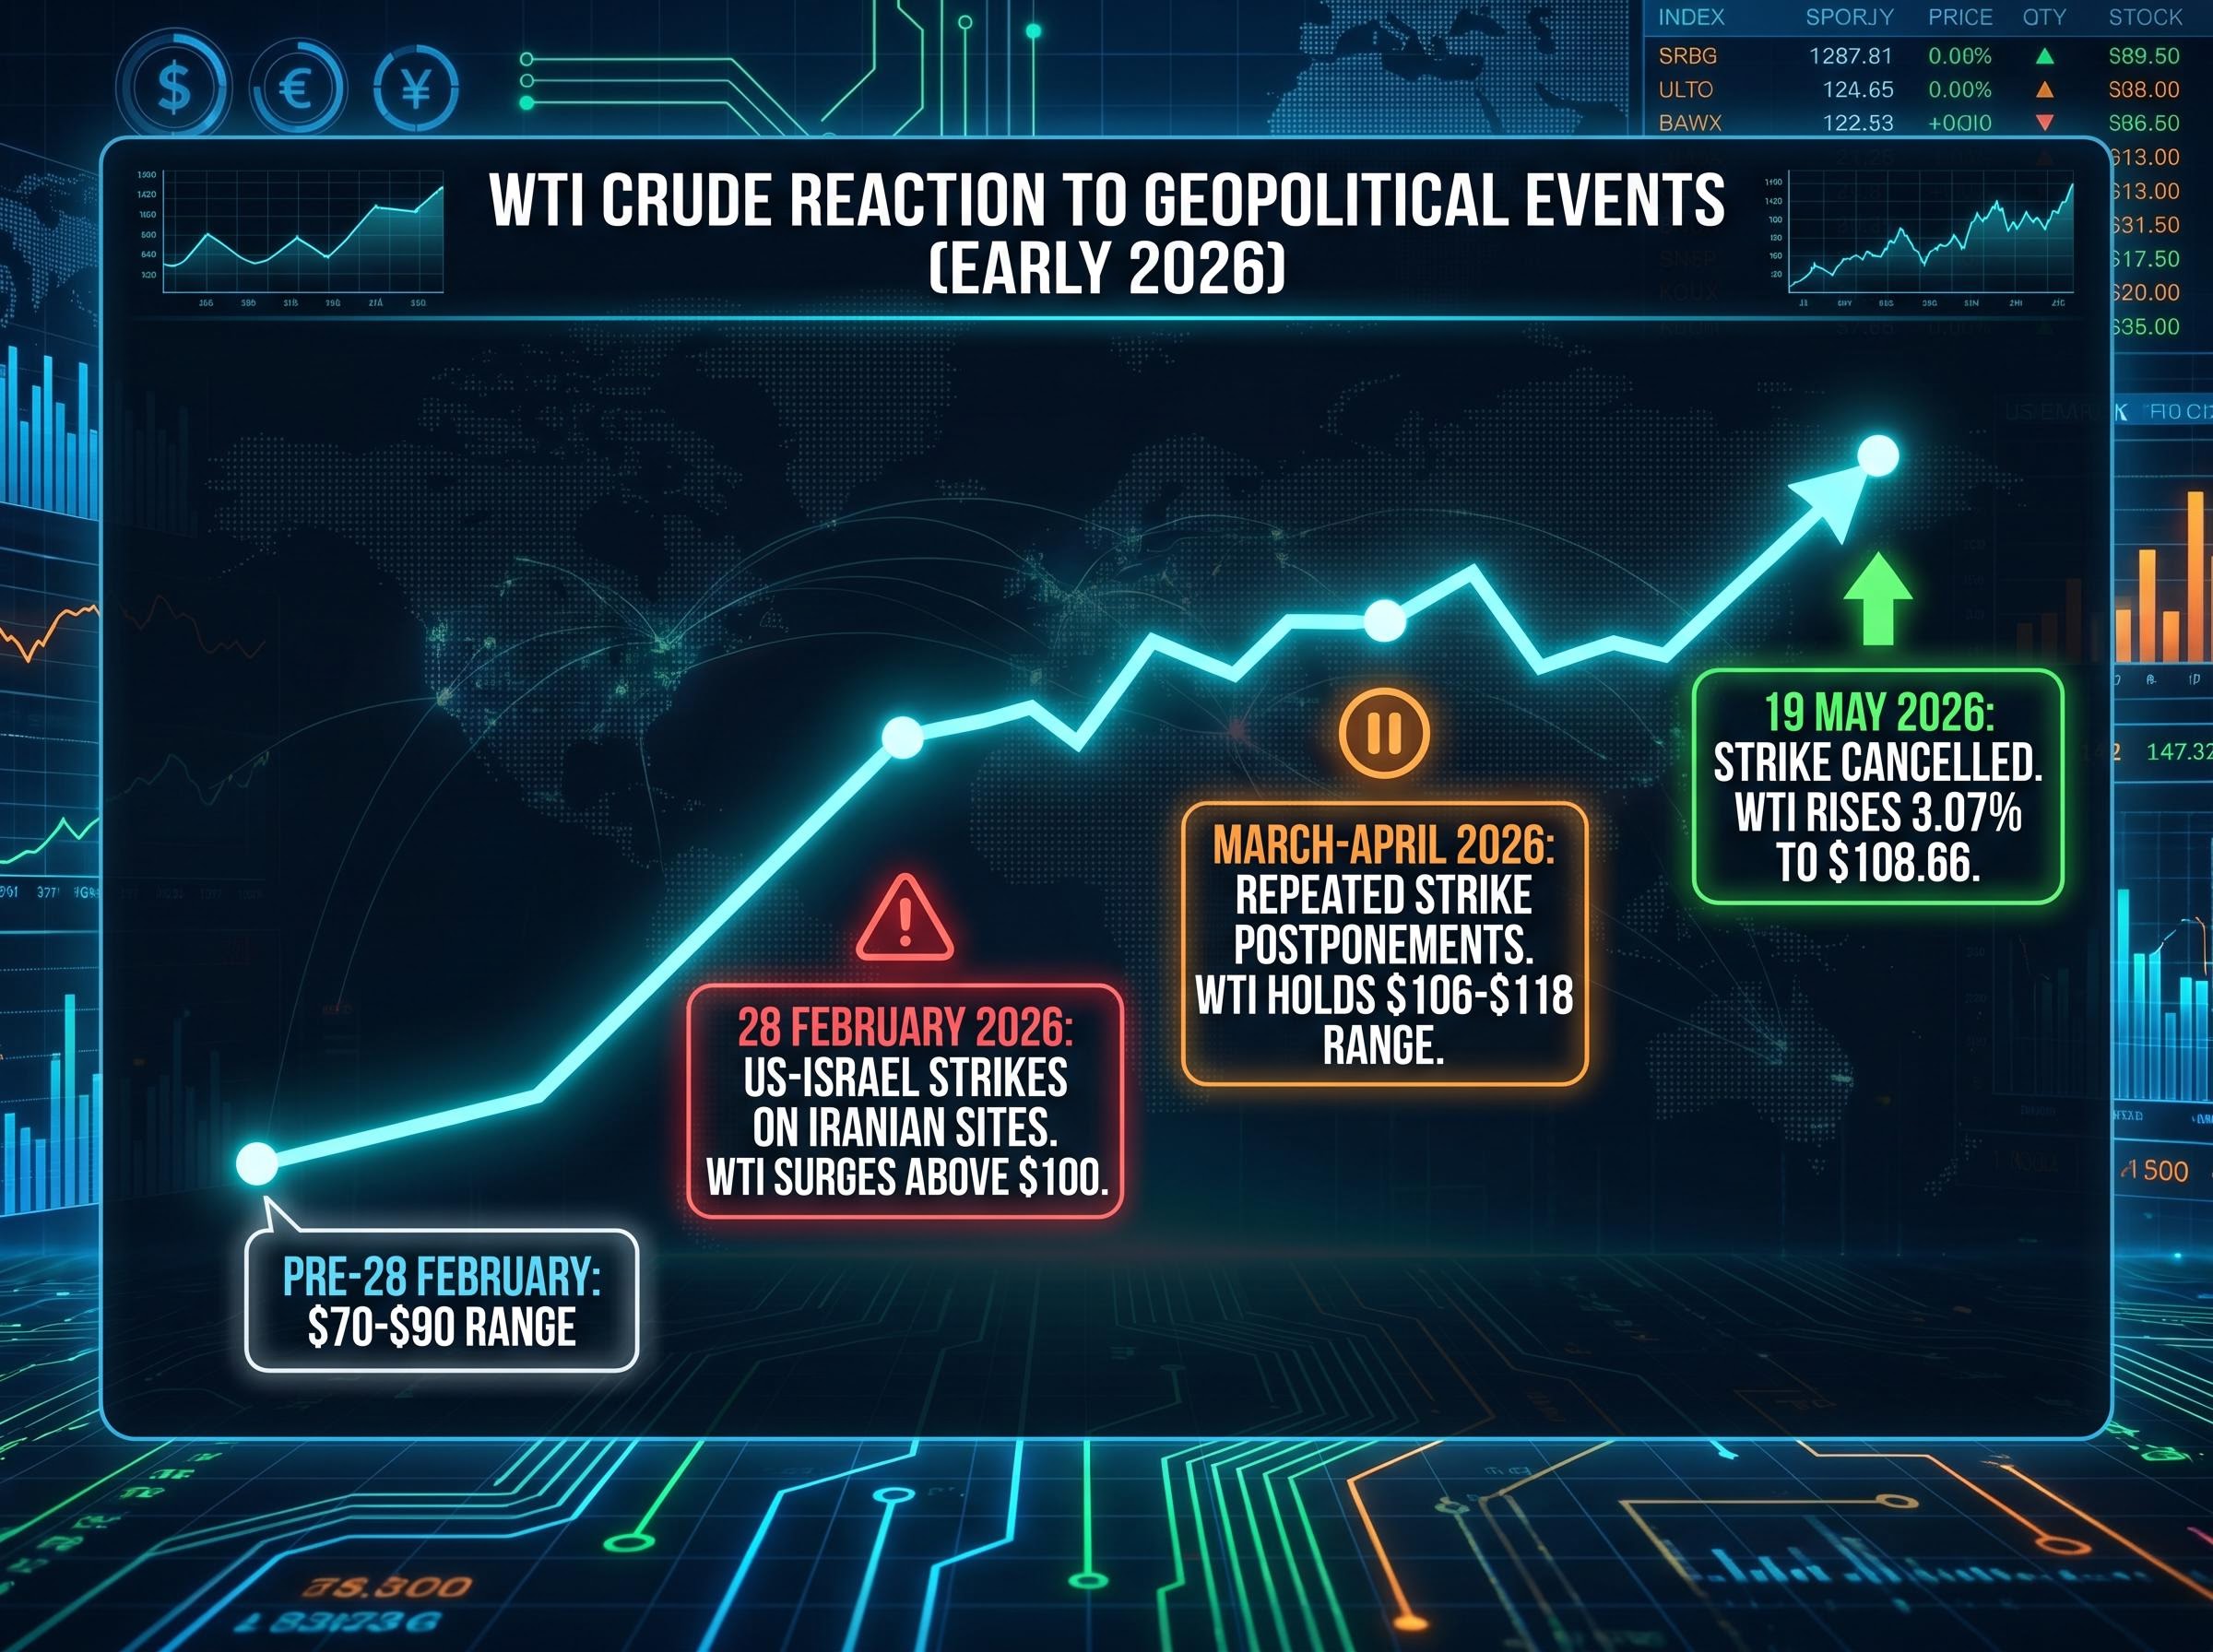
This is not a market that was balanced before the geopolitical risk arrived. Before the 28 February 2026 escalation, WTI and Brent traded in a $70-$90 range. The drawdown rate reflects three concurrent supply disruptions:
Bypass pipeline alternatives, including Saudi Arabia’s East-West Pipeline and the UAE’s ADCOP Pipeline, cannot collectively replace Hormuz throughput at the volumes required, a structural constraint that is central to why the EIA’s most optimistic rebalancing scenarios still project elevated prices through late 2026.
Investors evaluating whether the current price is a geopolitical spike or a structurally supported level need to reckon with the inventory backdrop first. The IEA data indicates that physical tightening is occurring regardless of what happens diplomatically in any given week.
On 19 May 2026, the US cancelled a scheduled military strike on Iran. President Trump cited serious ongoing negotiations over Iran’s nuclear programme as the basis for the decision. Qatar, Saudi Arabia, and the UAE had each made direct appeals in the hours before the strike window.
Markets did not treat the cancellation as a resolution. WTI rose 3.07% to $108.66 on the same session.
The pattern explains why. Since the conflict began with US-Israel strikes on Iranian sites on 28 February 2026, Trump has postponed military action multiple times, each time following Gulf intermediary pressure. Each deferral has been followed by renewed escalation or enforcement actions that keep the risk premium intact.
VLCC daily hire rates tracking near $110,000 per day are a physical market signal that the Hormuz risk premium is not purely a futures market phenomenon; Asia-Pacific importers including Japan, China, India, and South Korea are absorbing 10-20% higher import costs, and the IEA projects a two-year supply chain recovery timeline even under a best-case resolution scenario.
| Date | Event | WTI Response | Diplomatic Actor |
|---|---|---|---|
| 28 February 2026 | US-Israel strikes on Iranian sites | Surged above $100 | N/A (initial escalation) |
| March-April 2026 | Repeated strike postponements | Held $106-$118 range | Gulf state intermediaries |
| 19 May 2026 | Strike cancelled before execution | Rose 3.07% to $108.66 | Qatar, Saudi Arabia, UAE |
The S&P 500 Energy sector ETF hit a six-week high on 19 May, sitting approximately 3% below its 27 March peak. The oil market is not pricing resolution. It is pricing sustained uncertainty, and a pattern of repeated near-misses can itself sustain a risk premium that does not require an actual strike to persist.
The strike cancellation is an episode. Iran’s maritime authority over the Strait of Hormuz is a structure.
In a declaration reported by Press TV on 7 May 2026 and documented by the Maritime Executive on 8 April 2026, Iran asserted formal control over strait passage. The operational mechanics are specific: redrawn traffic separation schemes, required coordination with Iranian officials before transit, and active enforcement including turning back non-compliant vessels. Reports of vessels being refused passage span March through May 2026.
This is qualitatively different from previous Iranian threats to close the strait, which were political statements that required a decision to execute. The maritime authority is institutionalised and self-enforcing. It changes the operating environment for every tanker and insurer regardless of whether a shot is fired.
War-risk insurance premiums have risen in direct response to enforcement actions, embedding an ongoing cost in every barrel that passes through the corridor.
Kharg Island handles the vast majority of Iran’s crude exports. As of 19 May 2026, 23 tankers were congregating offshore, the largest concentration since the US naval blockade commenced. That build-up reflects the real-world consequence of transit uncertainty under the maritime authority regime: operators are hesitant to load cargo they cannot guarantee will transit the strait without interference.
The US government’s concurrent issuance of a Russia crude oil waiver acknowledged implicitly that the blockade is tightening supply enough to require a compensatory policy release, a signal that policymakers recognise the supply chain stress the Hormuz regime is generating.
For readers less familiar with energy market mechanics, the IEA’s 8.5 mb/d drawdown figure is more than a statistic. It is a leading indicator for where the price floor sits.
An inventory drawdown rate measures how quickly the world is consuming stored oil faster than producers can replace it. At 8.5 million barrels per day, global buffer stocks are being depleted at a pace that, if sustained through Q3 2026, would compress the available cushion to levels that historically force prices higher to ration demand.
The IEA has flagged drawdown rates of this magnitude only during extreme supply events. The current reading places this disruption in a category that demands policy response, specifically strategic petroleum reserve (SPR) releases on a scale that has rarely been attempted. SPR releases have been deployed previously but are not unlimited; the reserves are a buffer, not a substitute for flowing supply.
Emergency reserve releases have already been deployed at a scale that exceeds prior crises, with SPR and IEA disbursements totalling approximately 280 million barrels, yet Saudi Arabia’s crude output has simultaneously collapsed to its lowest level since 1990, leaving the combined policy response insufficient to halt the drawdown the IEA is measuring.
Three implications follow from the 8.5 mb/d rate:
Goldman Sachs’ mid-April Brent forecast of the high-$80s to low-$90s reflected a pre-escalation baseline. The market has already substantially exceeded that range. For investors, the drawdown rate signals that the current price is not purely a fear premium but is partly sustained by acute physical tightening, which is structurally different from a geopolitical spike that can reverse overnight.
The supply picture is unambiguously tight. The demand picture is not.
China’s April 2026 economic data arrived well below expectations across every major indicator. Given China’s outsized role in global crude import demand, this weakness matters directly for the trajectory of oil consumption in the second half of 2026.
| Indicator | April 2026 Actual | Consensus Forecast | Prior Month |
|---|---|---|---|
| China retail sales (YoY) | 0.2% | 2.0% | 1.7% |
| China industrial output (YoY) | 4.1% | 5.9% | N/A |
| China fixed-asset investment (Jan-Apr YTD) | -1.6% | +1.6% | N/A |
| US 10-year Treasury yield | 4.623% | N/A | N/A |
| CME rate hike probability (Dec 2026) | 25% | N/A | 21.5% |
The US Treasury yield dynamic compounds the demand-side concern. With the 10-year yield at 4.623%, a one-year peak, and CME FedWatch showing zero probability of Federal Reserve rate cuts, the higher discount rate environment historically compresses commodity valuations over a medium-term horizon, even when near-term supply is tight.
The tension is explicit: the supply shock supports near-term prices; the macro headwinds introduce real downside risk to sustained high prices into late 2026. Investors should not mistake a supply shock for a structural demand boom. The two require different positioning horizons.
Demand destruction pricing and partial reopening probability have both been embedded in the futures curve since March, which is why Brent at $106-$107 sits well below its April peak despite a physical deficit that has now removed a cumulative 12.8 million barrels per day from global circulation since February 2026.
Three forces support energy prices:
Three forces could reverse the premium:
The S&P 500 Energy sector was the best-performing sector on 19 May, up 1.81%, with its ETF at a six-week high. That level sits approximately 3% below its 27 March peak, meaning the market has already partially priced the disruption. The entry point for new investors is not the same as it was in early March, when WTI first broke above $100.
Prediction market participants on Kalshi, as of 1 May 2026, expected US oil prices to reach new 2026 highs. The investor who understands that the current price embeds both a physical supply deficit and a geopolitical fear premium is better positioned to assess what would need to change for prices to fall sharply versus climb further.
This article is for informational purposes only and should not be considered financial advice. Investors should conduct their own research and consult with financial professionals before making investment decisions. Past performance does not guarantee future results. Financial projections are subject to market conditions and various risk factors.
The single most consequential variable to monitor is whether Iran’s maritime authority enforcement escalates from turning back individual vessels to interdicting larger convoys or Western-flagged tankers. That threshold would trigger a qualitatively different insurance and logistics response, one that could push the price floor materially higher.
The parallel diplomatic track (Gulf state intermediaries, Pakistan-brokered discussions) represents the scenario that could deflate the premium. That track has been active for months without resolving the core dispute.
Three specific indicators will signal which direction the market moves next:
Investors who track these three signals are equipped to reassess energy exposure as conditions evolve, rather than reacting to individual price sessions in isolation.
The IEA inventory drawdown rate measures how quickly global stored oil supplies are being depleted faster than producers can replace them. At 8.5 million barrels per day in Q2 2026, the rate signals acute physical tightening that supports a higher price floor regardless of diplomatic developments.
Iran has formalised maritime authority over the Strait of Hormuz, requiring tankers to coordinate with Iranian officials before transit and actively turning back non-compliant vessels. This has raised war-risk insurance premiums and created persistent supply chain costs embedded in every barrel moving through the corridor.
Markets interpreted the cancellation as a continuation of the uncertainty pattern rather than a resolution, because previous strike postponements since February 2026 were each followed by renewed enforcement actions that kept the risk premium intact. WTI rose 3.07% to $108.66 on the same session the cancellation was announced.
China's April 2026 economic data came in well below expectations across retail sales, industrial output, and fixed-asset investment, signalling that demand growth may slow. Elevated US Treasury yields at 4.623% also raise the opportunity cost of commodity-heavy positioning and historically compress valuations over a medium-term horizon.
The three most important signals are the Kharg Island tanker count (currently 23 vessels idling), the tone of Gulf state and Pakistan-brokered diplomatic channels, and the IEA monthly oil market report inventory updates, which will show whether the 8.5 mb/d drawdown rate is accelerating, stabilising, or easing.