CURE and CLNE: the ASX ETFs Returning 25% in 2026
7 hrs ago

Global oil supply has absorbed a cumulative loss of 12.8 million barrels per day since February 2026, yet Brent crude sits at roughly $106-107 per barrel in mid-May rather than retesting its $118 March peak. The gap between a historically large supply shock and a price that has actually retreated from its highs tells investors something specific: demand destruction and reopening probability are already being priced against the physical deficit. The Strait of Hormuz has been effectively closed to normal commercial traffic since 28 February 2026. Iran’s toll regime, a US naval blockade imposed on 13 April, and resumed Houthi attacks on Red Sea shipping have shut both of the Gulf’s major energy corridors simultaneously, a configuration without modern precedent. This analysis traces the disruption’s scale and structure, examines the sharp divergences between OPEC, the IEA, and the EIA on what comes next, follows the shock’s path into aluminium and LNG markets, and identifies the positioning variables that separate informed commodity exposure from undifferentiated directional bets.
Global oil supply fell to 94.2 mb/d in April 2026, down 2.8 mb/d from March alone. Since the Hormuz closure on 28 February, cumulative supply losses have reached 12.8 mb/d, a deficit that has drawn an estimated 246 million barrels from commercial inventories across March and April combined.
Three distinct mechanisms are compounding the losses:
Over 1,550 vessels and approximately 22,500 mariners remain stranded in or near the Gulf.
According to Cambridge analysis cited by AOG Worldwide, this represents the first simultaneous closure of both major Gulf energy corridors in modern history.
The inventory draw magnitude is what matters most for near-term price formation. Demand forecasts can be revised downward. Physical barrels already consumed from storage cannot be revised back into existence. That 246 million barrel deficit sets a floor under prices that persists regardless of where agencies project demand heading next.
The three agencies that anchor institutional commodity analysis have reached materially different conclusions about 2026, and the spread between them is itself the most useful data point for investors building scenario frameworks.
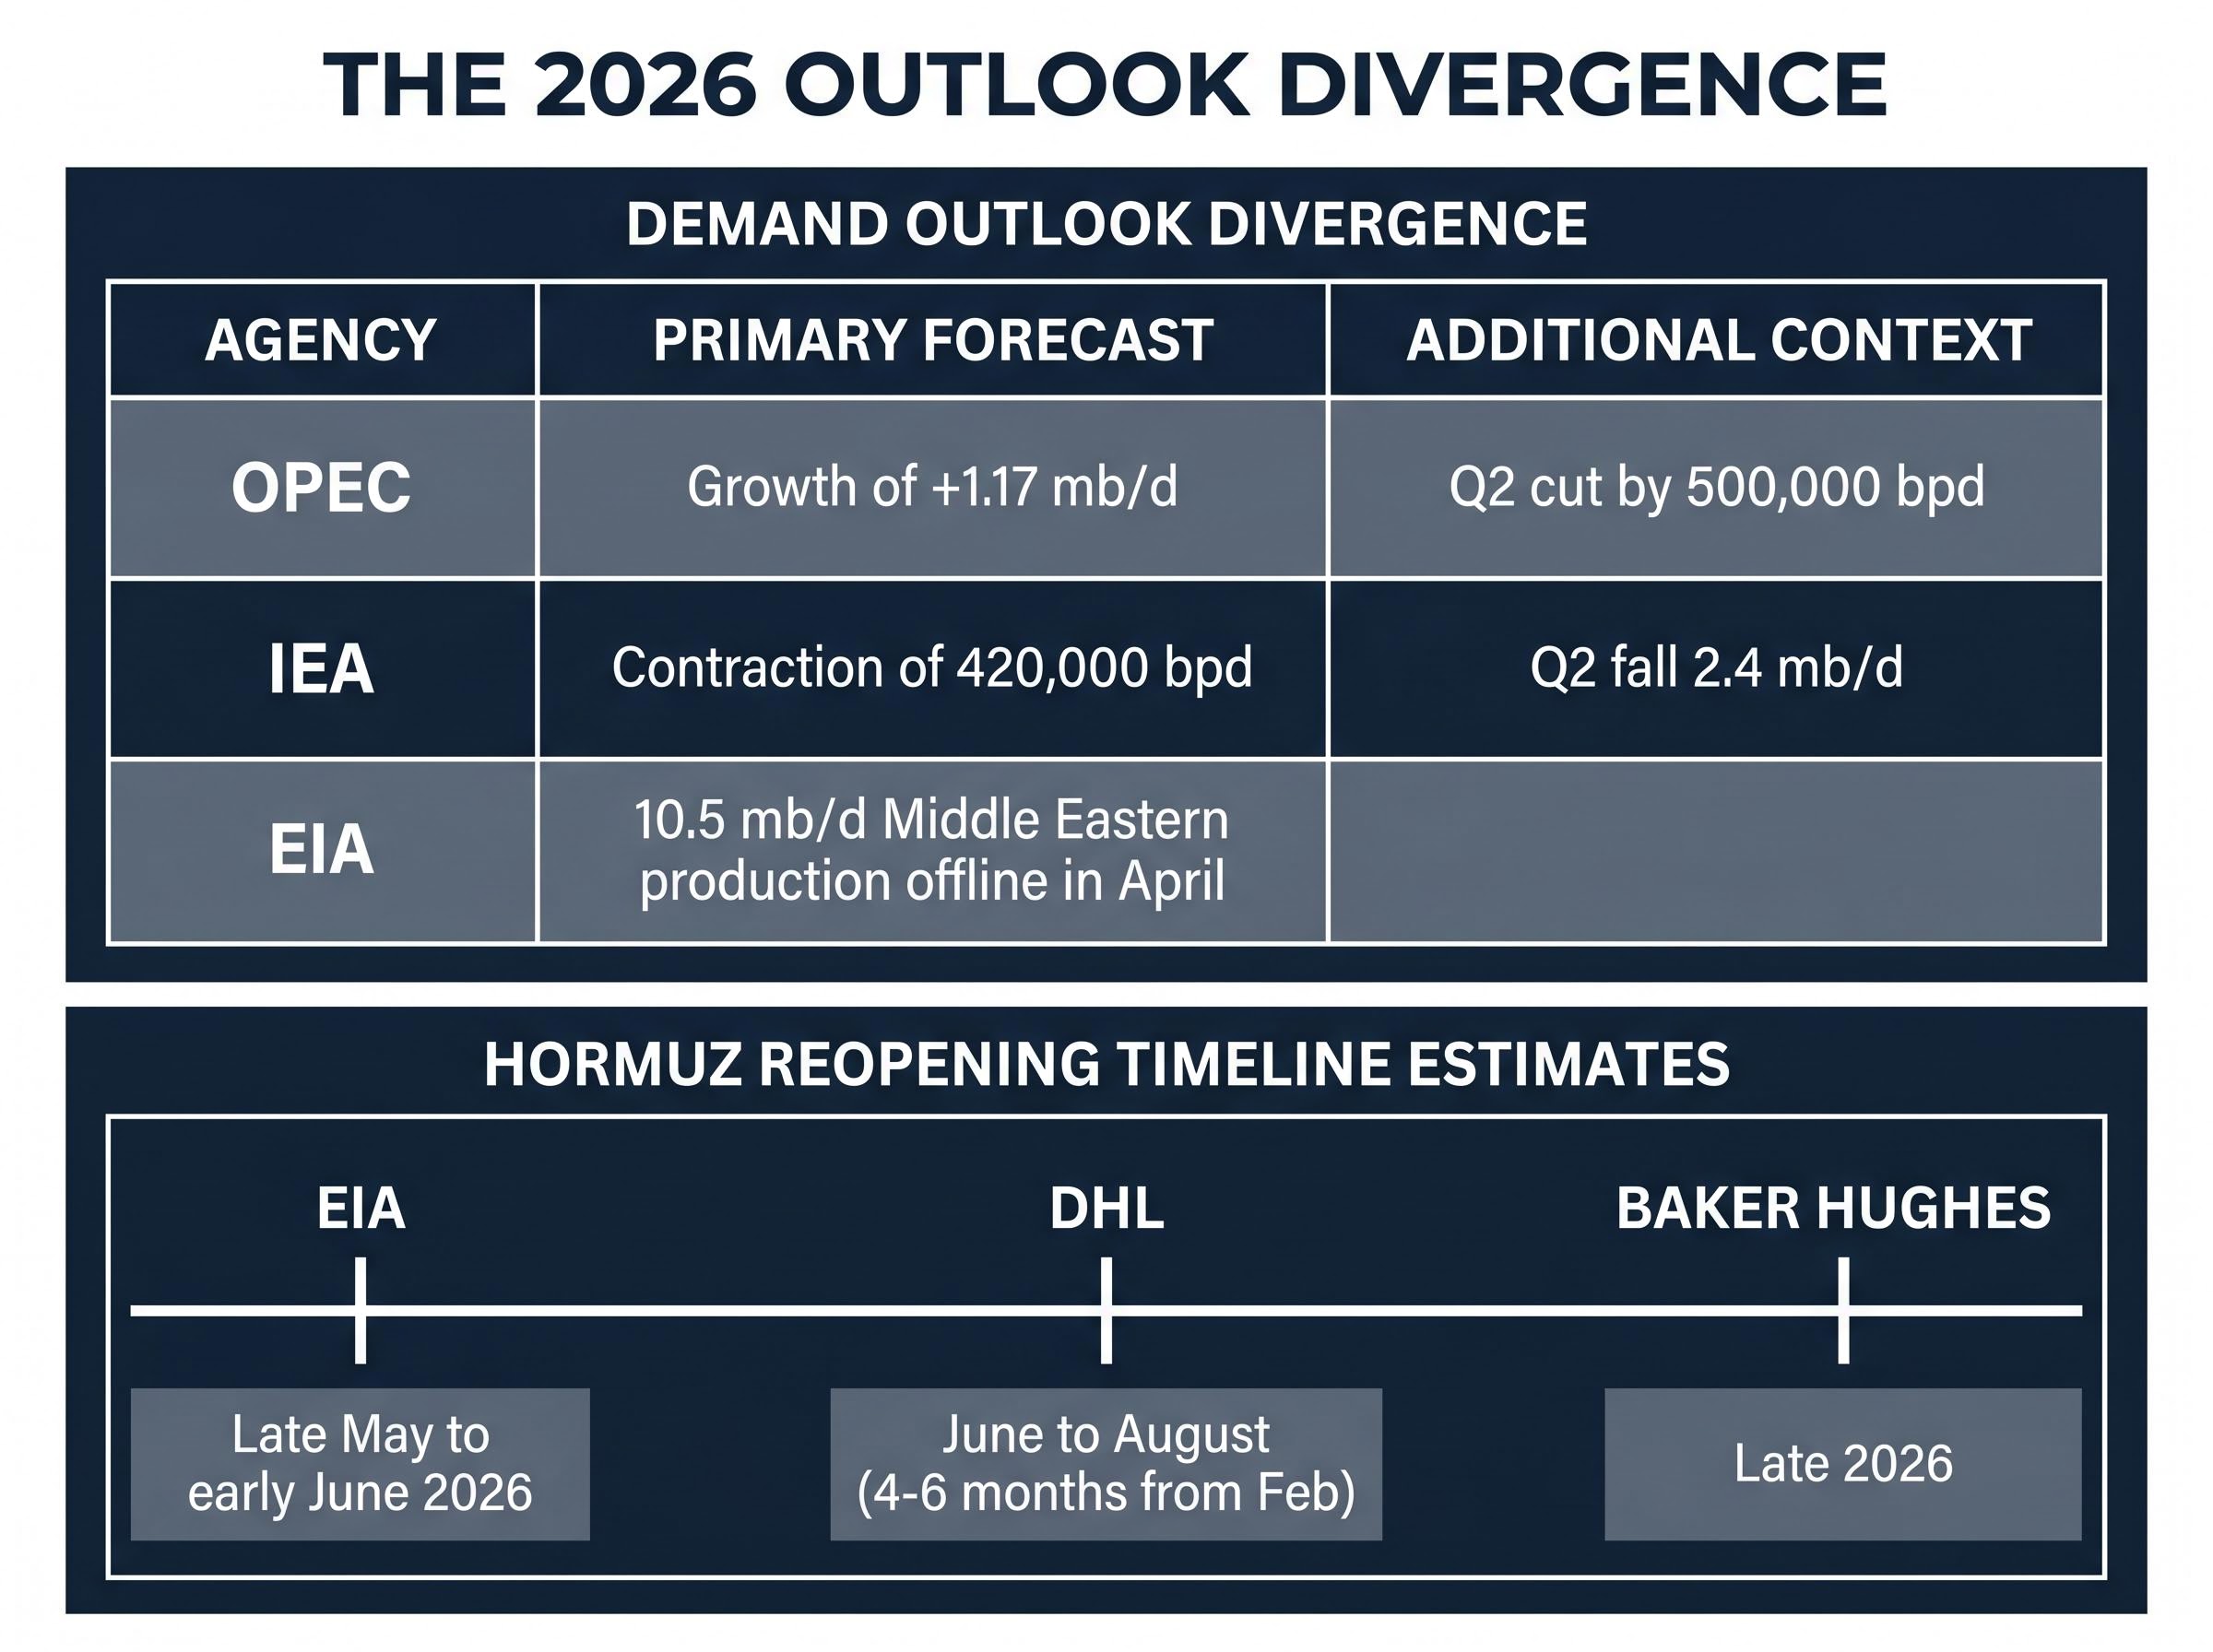
| Agency | 2026 Demand Outlook | Hormuz Reopening Assumption |
|---|---|---|
| OPEC | Growth of +1.17 mb/d; April-June demand estimate cut by 500,000 bpd | Not explicitly specified; optimistic on demand resilience |
| IEA | Full-year demand contraction of 420,000 bpd year-on-year; Q2 demand expected to fall 2.4 mb/d | Frames normalisation probabilistically; stresses downside risk |
| EIA | Approximately 10.5 mb/d of Middle Eastern production offline during April | Base case embeds flows resuming late May to early June 2026 |
The OPEC-to-IEA gap on demand alone spans roughly 1.6 mb/d, the distance between a market that is still growing and one that is contracting outright. The EIA’s reopening assumption, the most optimistic of the three, is not yet supported by observable carrier schedules or any signed agreement. Baker Hughes’ CFO has cautioned that the strait may not fully reopen until late 2026. DHL’s regional leadership is guiding clients to plan for four to six months of ongoing disruption from February, extending into at least June to August.
Investors who anchor to a single agency view without accounting for the full cone are accepting scenario risk they may not have sized.
Brent-Dubai benchmark divergence has created the most extreme regional price split in oil market history, with Dubai crude reaching approximately $260 per barrel at its May 2026 peak while Brent held near $108, meaning any investor or refiner modelling Asian energy costs from headline Brent alone was systematically underestimating real acquisition costs by more than 140%.
The paradox is real but resolvable. Physical balances show a historically large supply hole and massive inventory draws, yet Brent at $106-107 sits well below the $118 March peak. Two forces explain the gap: demand expectations have been cut sharply across all three agencies, and markets are pricing a non-zero probability of partial reopening in the coming months, particularly given the EIA’s late May to early June base case.
The oil pricing paradox of falling spot prices alongside a deepening physical deficit is not unique to mid-May: WTI fell 1.86% to $100.37 on 6 May even as Hormuz remained closed and a second major refinery disruption compounded upstream tightness, with ceasefire sentiment overriding physical inventory signals for several consecutive sessions.
The futures curve remains in backwardation, a signal of near-term physical tightness where buyers pay a premium for immediate delivery. But front-end calendar spreads have narrowed from their March extremes as the demand downgrades partially offset the supply deficit. The curve is tight, not panicked.
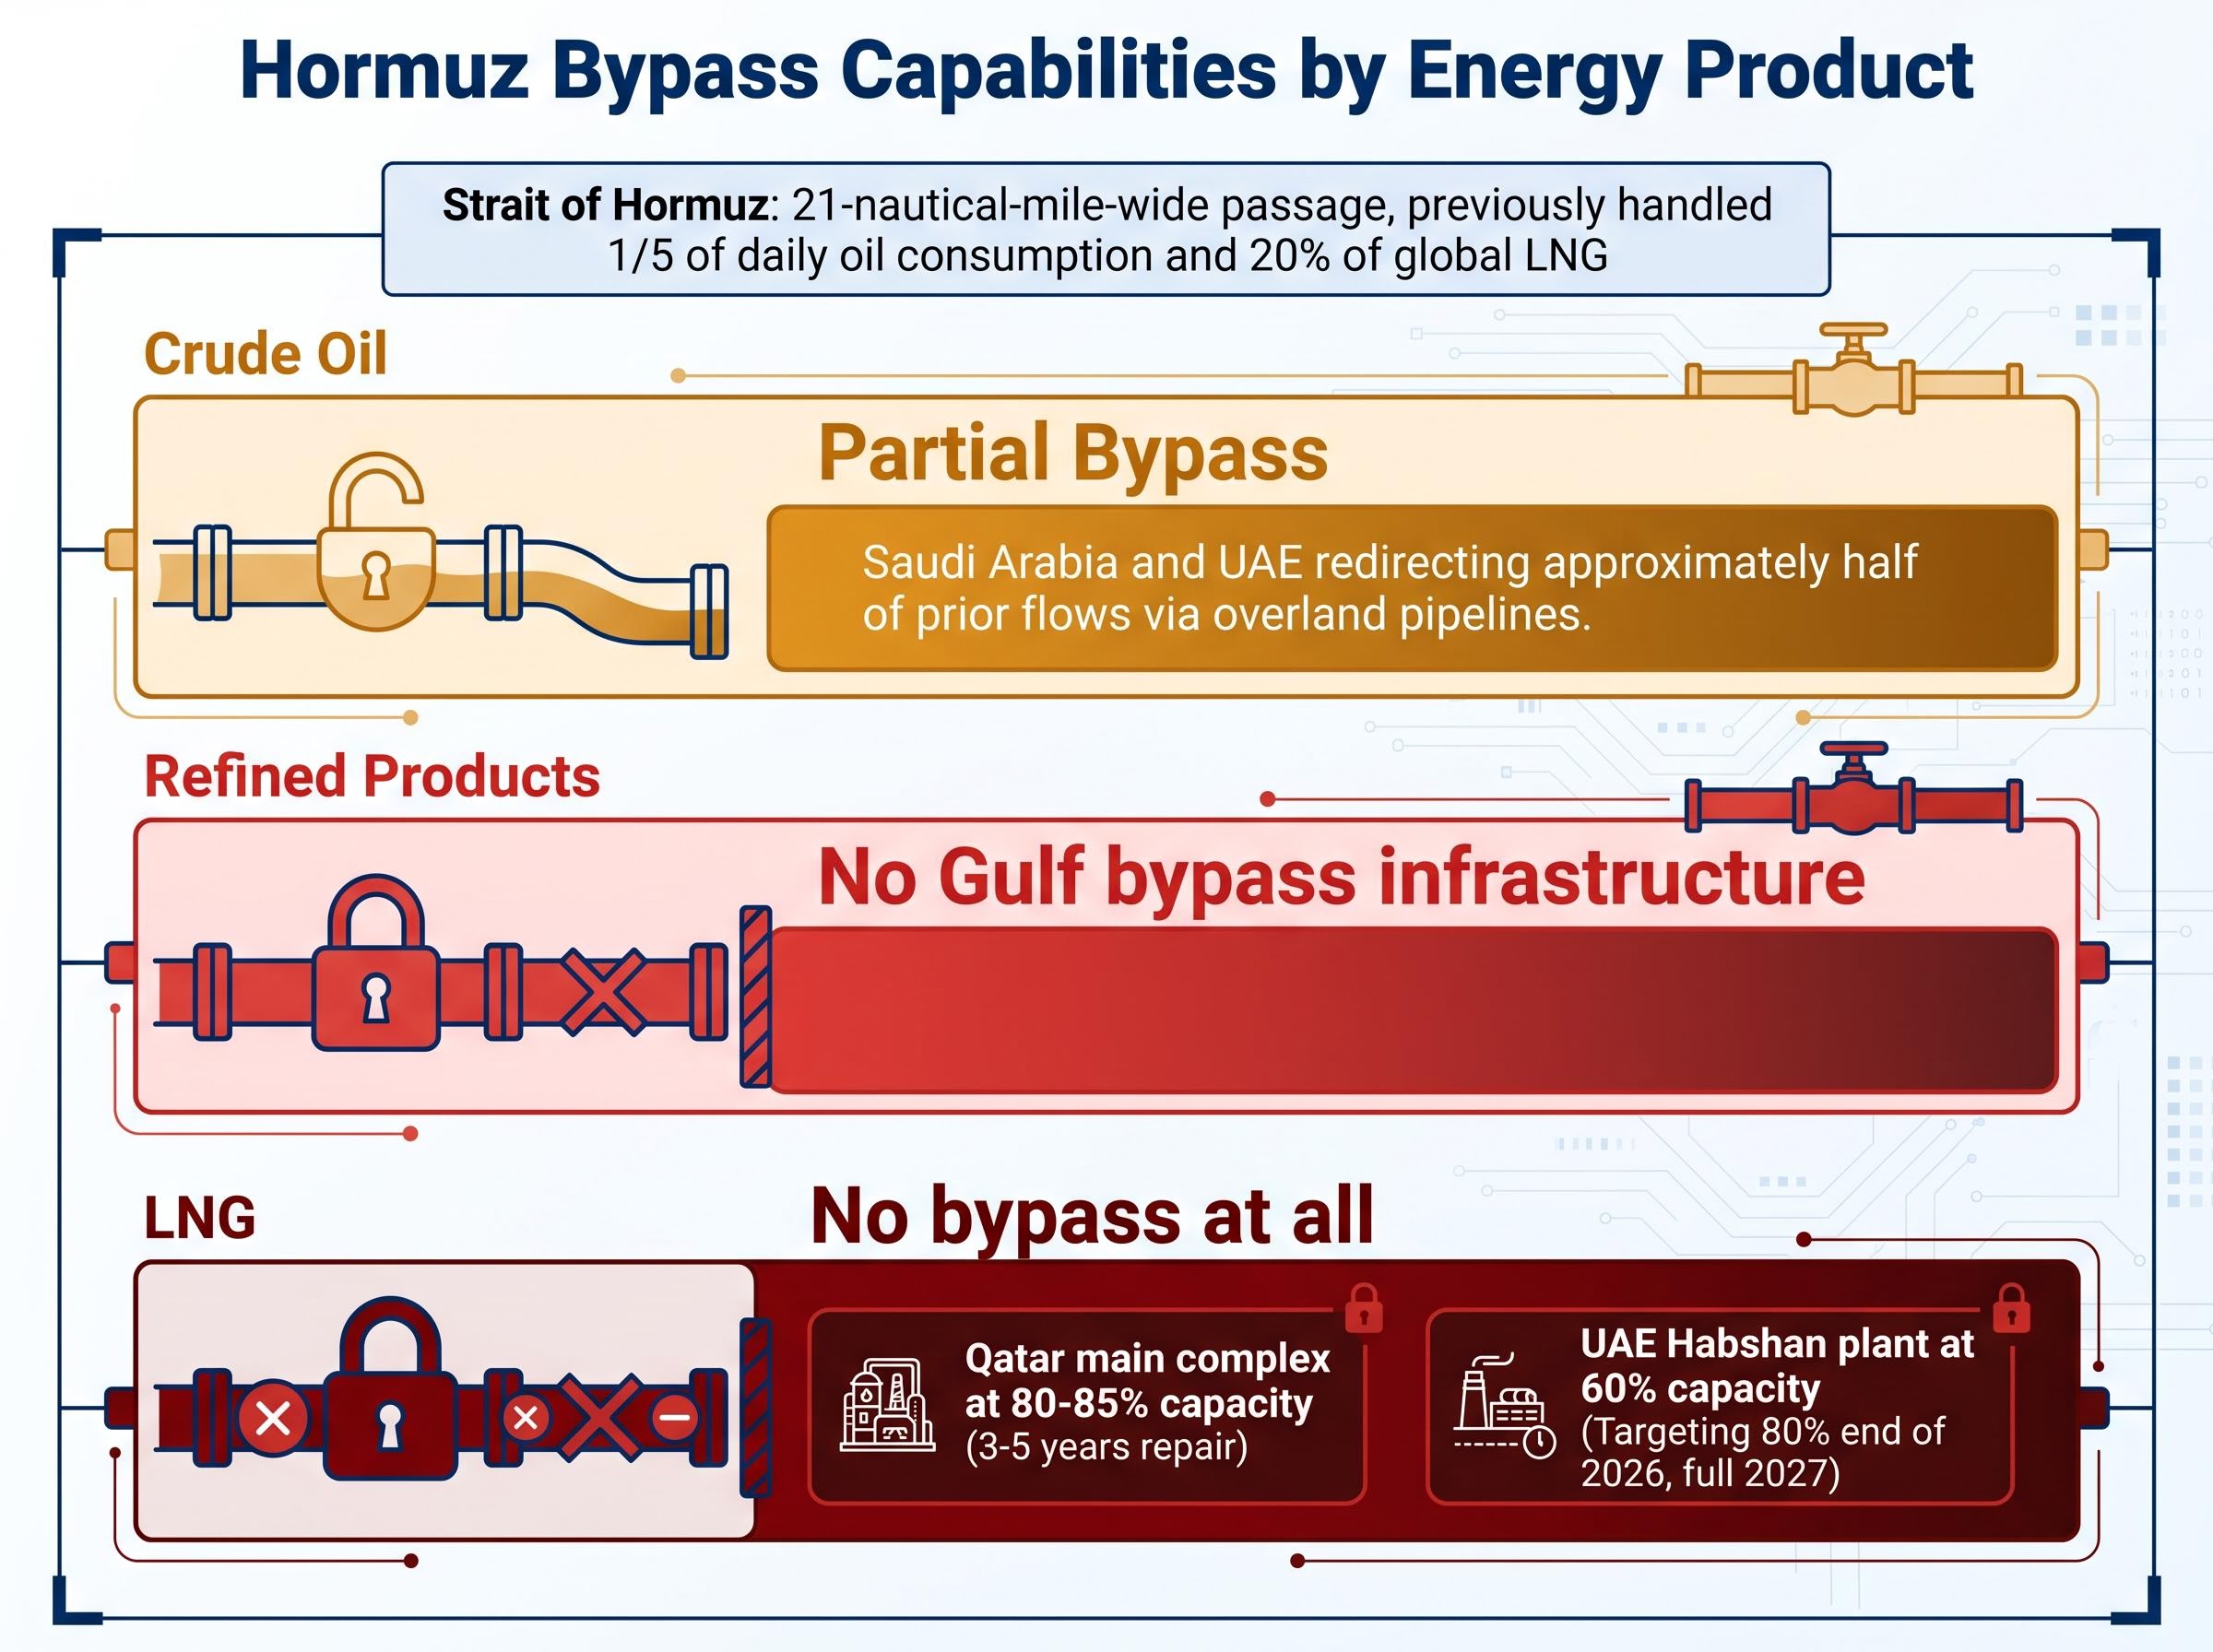
The Strait of Hormuz is a 21-nautical-mile-wide passage between Iran and Oman through which roughly a fifth of the world’s daily oil consumption and approximately 20% of global liquefied natural gas (LNG) previously transited. It is not a trade route that can be substituted; it is physical infrastructure that either functions or does not.
What distinguishes this crisis from prior single-chokepoint disruptions is the asymmetry of bypass options across energy products:
Refined product supply constraints are tightening on a faster timeline than crude oil markets, with jet fuel tanker loadings collapsing approximately 50% week-on-week in early May 2026 and ConocoPhillips flagging critical shortfall risk for import-dependent nations as early as June to July, a vulnerability that the absence of Gulf bypass infrastructure for refined products makes structurally difficult to offset.
The UAE’s Habshan gas plant is operating at 60% of capacity, targeting 80% by end of 2026 and full restoration only in 2027.
According to US intelligence assessments, Iran retains access to 30 of 33 missile positions along the Hormuz corridor and approximately 70% of its pre-conflict missile inventory.
That military posture is the structural reason reopening is not imminent. It is not a political impasse waiting for a phone call; it is a defended geographic position that any reopening framework must physically account for. LNG exposure is structurally more vulnerable than crude oil exposure to prolonged disruption precisely because there is no workaround.
Aluminium smelting is among the most electricity-intensive industrial processes globally. When energy prices rise and stay elevated, the most expensive smelters face margin compression that no hedging programme can fully offset over multiple quarters.
The Hormuz closure has added a second pressure: the UAE, Bahrain, and Qatar are major aluminium exporters, and their product now faces significantly longer and costlier routing via the Cape of Good Hope or exposure to Iran’s toll regime. LME aluminium cash settlement reached approximately $3,653.85 per tonne on 13 May 2026, up roughly 44.81% over the prior year.
Three compounding pressures are tightening the aluminium market simultaneously:
Alcoa has warned that physical aluminium scarcity is anticipated in Europe or North America within approximately six months of May 2026.
Alcoa’s Spain smelter is operating at full capacity through 2027, and the company is pursuing asset monetisation targeting $500 million to $1 billion in proceeds alongside a $65 million investment to expand recycling capacity at its Mosjøen facility in Norway. These are not crisis responses; they are structural repositioning moves by a producer that expects tightness to persist.
For investors seeking commodity exposure without direct crude risk, aluminium has become the clearest non-oil expression of the Hormuz disruption, though positioning is growing increasingly crowded.
The supply shock has created three distinct categories of commodity-linked exposure, each carrying a different risk-reward profile:
The scenario matrix that frames duration risk is specific enough to size positions against:
| Scenario | Brent Price Range | Aluminium Outlook | Key Trigger |
|---|---|---|---|
| EIA base case: partial reopening June 2026 | $90-100/bbl | Premiums ease but physical tightness persists 3-6 months | Verified tanker traffic resuming through Hormuz |
| Baker Hughes: late 2026 partial reopening | $100-110/bbl | Physical scarcity materialises in Europe/North America per Alcoa warning | No signed ceasefire by Q3 2026 |
| Full closure into 2027 | $110+/bbl | Structural deficit; smelter curtailments likely | Renewed military escalation or negotiation breakdown |
The demand destruction feedback loop constrains the upside in all three scenarios. US headline PPI reached 1.4% month-on-month in April 2026 (versus 0.7% expected), annualising at 6.0%, with final demand energy prices up 7.8% and gasoline up 15.6% month-on-month. Sustained high energy prices are generating their own demand headwind, which limits the runway for price-only commodity positions.
The UAE’s departure from OPEC on 28 April 2026 adds a further variable: an independent production strategy from the Gulf’s most Hormuz-bypass-ready producer, signalling that the post-crisis supply architecture will not resemble what came before. Ceasefire-on, ceasefire-off cycle risk is keeping war-risk insurance premiums elevated even beyond any initial partial reopening.
Investors wanting to trace the supply shock through to specific sector earnings impacts will find our full explainer on the Iran conflict’s corporate earnings cascade, which examines how ExxonMobil and Chevron reported Q1 net income declines of 36-45% despite beating estimates, how Spirit Airlines permanently closed on 2 May 2026 as jet fuel costs destroyed its recovery plan, and how the UAE OPEC exit on 28 April structurally altered the alliance’s production architecture.
The near-term price question will resolve when Hormuz reopens, partially or otherwise. The structural investment question will not.
Gulf national oil companies are fast-tracking pipeline expansions to Red Sea and Arabian Sea ports designed to bypass Hormuz permanently, not as a temporary contingency but as long-term infrastructure. US and other Atlantic Basin LNG producers are emerging as structural beneficiaries as buyer supply chains redirect toward non-Gulf sources. The UAE’s post-OPEC exit enables independent production above former quota ceilings wherever pipeline capacity permits.
The effects that will fade with a ceasefire are distinct from those that will not:
According to academic analysis consistent with Tufts maritime research and Cambridge assessments, pre-2026 energy trade architecture is unlikely to return even after shipping resumes. The diversification investments being made now will reshape buyer and seller strategies for years.
Investors who treat this disruption as a temporary price spike to ride and exit are missing the more durable theme. The structural re-mapping of global energy trade is creating long-duration opportunities in pipeline infrastructure, Atlantic Basin LNG capacity, and Gulf NOC diversification strategies that do not depend on Brent staying above $100.
The supply hole is historically large: 12.8 mb/d in cumulative losses and a 246 million barrel inventory draw across two months. Yet Brent at $106-107 is well below the $118 March peak because demand destruction and reopening probability have both been priced into the curve. Edge in this market does not come from directional conviction on whether Hormuz reopens. It comes from scenario-width thinking: sizing positions for the full range of duration outcomes, from June reopening to full closure into 2027.
The Alcoa scarcity timeline, physical deficit in aluminium within approximately six months, represents the most near-term actionable signal for materials investors. The difference between the EIA’s June reopening base case and Baker Hughes’ late-2026 partial reopening call is not a matter of degree; it is a different investment thesis with different position sizing, different hedging structures, and different exit triggers.
Three leading indicators are worth monitoring on a recurring basis: EIA Short-Term Energy Outlook updates (monthly), LME aluminium forward curve structure (cash versus three-month settlement as a barometer of physical tightness), and observable tanker traffic data through Hormuz as the empirical test of any reopening claim.
This article is for informational purposes only and should not be considered financial advice. Investors should conduct their own research and consult with financial professionals before making investment decisions. Past performance does not guarantee future results. Financial projections are subject to market conditions and various risk factors.
The Strait of Hormuz is a 21-nautical-mile-wide passage between Iran and Oman through which roughly one fifth of the world's daily oil consumption and approximately 20% of global LNG previously transited. Its closure since February 2026 has removed 12.8 million barrels per day from global supply, making it the most consequential chokepoint in energy markets.
Since the Hormuz closure on 28 February 2026, cumulative supply losses have reached 12.8 million barrels per day, drawing an estimated 246 million barrels from commercial inventories across March and April 2026 combined.
The three agencies hold materially different assumptions: OPEC projects demand growth of 1.17 mb/d, the IEA forecasts a full-year contraction of 420,000 bpd, and the EIA embeds a base case of flows resuming late May to early June 2026. The gap between OPEC and the IEA alone spans roughly 1.6 mb/d, representing the difference between a growing market and one contracting outright.
LME aluminium cash settlement reached approximately $3,653.85 per tonne on 13 May 2026, up roughly 44.81% over the prior year, driven by rising Gulf producer logistics costs, elevated energy prices squeezing smelting margins, and constrained Chinese production capacity capped at 45 million tonnes annually.
The article identifies three key indicators: monthly EIA Short-Term Energy Outlook updates, the LME aluminium forward curve structure comparing cash versus three-month settlement as a barometer of physical tightness, and observable tanker traffic data through Hormuz as the empirical test of any reopening claim.