What a Random ASX Backtest Reveals About Managing Market Risk
1 hr ago

Semiconductor earnings estimates have been revised upward by more than 20% in 2026, driven by AI capital expenditure commitments from hyperscalers now totalling an estimated $650-$725 billion combined. Yet the prevailing market narrative still labels the sector overpriced. Bank of America analyst Savita Subramanian pushed back directly against that characterisation in a note published on 18 May 2026, citing data on free cash flow yields, positioning levels, and earnings momentum that she argues the bubble narrative is ignoring. The debate carries real portfolio weight: semiconductor stocks occupy a significant share of most U.S. equity allocations, and a misread on their valuation has measurable cost. What follows breaks down the specific metrics behind BofA’s contrarian call, explains what the semiconductor vs. software positioning gap actually looks like, and translates the institutional analysis into a framework for evaluating sector exposure right now.
More than 20%. That is how far semiconductor earnings estimates have been revised upward in 2026, according to Subramanian’s analysis. This is not a single-stock phenomenon driven by one AI chipmaker’s guidance beat. It is a sector-wide repricing of expected profitability.
Semiconductor earnings estimates have been revised upward by more than 20% in 2026, a figure Savita Subramanian cited as evidence that fundamental momentum, not speculative sentiment, is driving valuations higher.
The mechanism is specific: hyperscaler AI capital expenditure guidance, disclosed during Q1 2026 earnings releases in late April, came in above prior estimates across all four major spenders. Each company raised or maintained elevated spending plans tied directly to AI infrastructure buildout:
The distinction that matters here is between a sector whose valuations are climbing on multiple expansion, where investors simply pay more for the same earnings, and one whose valuations are climbing because the earnings themselves are being revised higher. Semiconductors in 2026 fall into the second category. The denominator is moving, and it is moving fast.
The current AI investment cycle has now surpassed every prior technology spending peak as a share of US GDP, reaching 4.9% in Q1 2026 and eclipsing both the dot-com era peak of approximately 4.2% and the cloud buildout peak of approximately 3.8%, a scale that contextualises why semiconductor earnings revisions are running at multiples of the broader market rate.
The trailing price-to-earnings ratio on SOXX sits at approximately 50x. On first encounter, that figure looks alarming, the kind of multiple associated with speculative excess. But trailing P/E measures what a company earned over the prior twelve months, and when earnings are in a steep revision cycle, that backward-looking metric overstates expensiveness.
Forward P/E tells a materially different story. SMH carried a forward P/E of approximately 23x as of March 2026 analysis, and broader sector forward multiples sit in the 23-28x range. That is elevated relative to the long-run market average, but it is not extreme relative to the growth rates currently being priced in.
The more revealing metric, and the one Subramanian is using to anchor her argument, is free cash flow yield. BofA’s May 2026 note found that semiconductors currently exhibit their highest free cash flow yield in recent history. In practical terms, this means the sector is generating more cash relative to its market capitalisation than at any comparable point, a signal that the businesses underpinning these stock prices are producing real, distributable cash, not paper earnings inflated by accounting treatment.
| Metric | Semiconductors | Software |
|---|---|---|
| Trailing P/E | ~50x (SOXX) | Elevated |
| Forward P/E | ~23-28x | Higher relative to growth |
| Free Cash Flow Yield | Historic high | Near multi-year lows |
For investors relying on trailing P/E alone, the picture looks expensive. For professional allocators using free cash flow yield, the same set of companies looks mispriced by a backward-looking metric.
For investors wanting to apply the free cash flow yield and forward P/E analysis to specific names rather than the sector index, our full explainer on semiconductor valuation frameworks examines Micron at under 9x forward earnings alongside Intel at 101x, walking through the PEG ratio, EV/EBITDA, and cycle-adjusted estimate tools that produce materially different conclusions for different stock types within the same index.
A speculative bubble, by the analytical framework buy-side professionals use, requires three conditions to be met simultaneously:
Where do semiconductors stand on each? Active long-only overweight in the sector currently sits at approximately 20%. That is meaningful, but it is half the 2017 peak of 40% overweight. Positioning is elevated; it is not at an extreme.
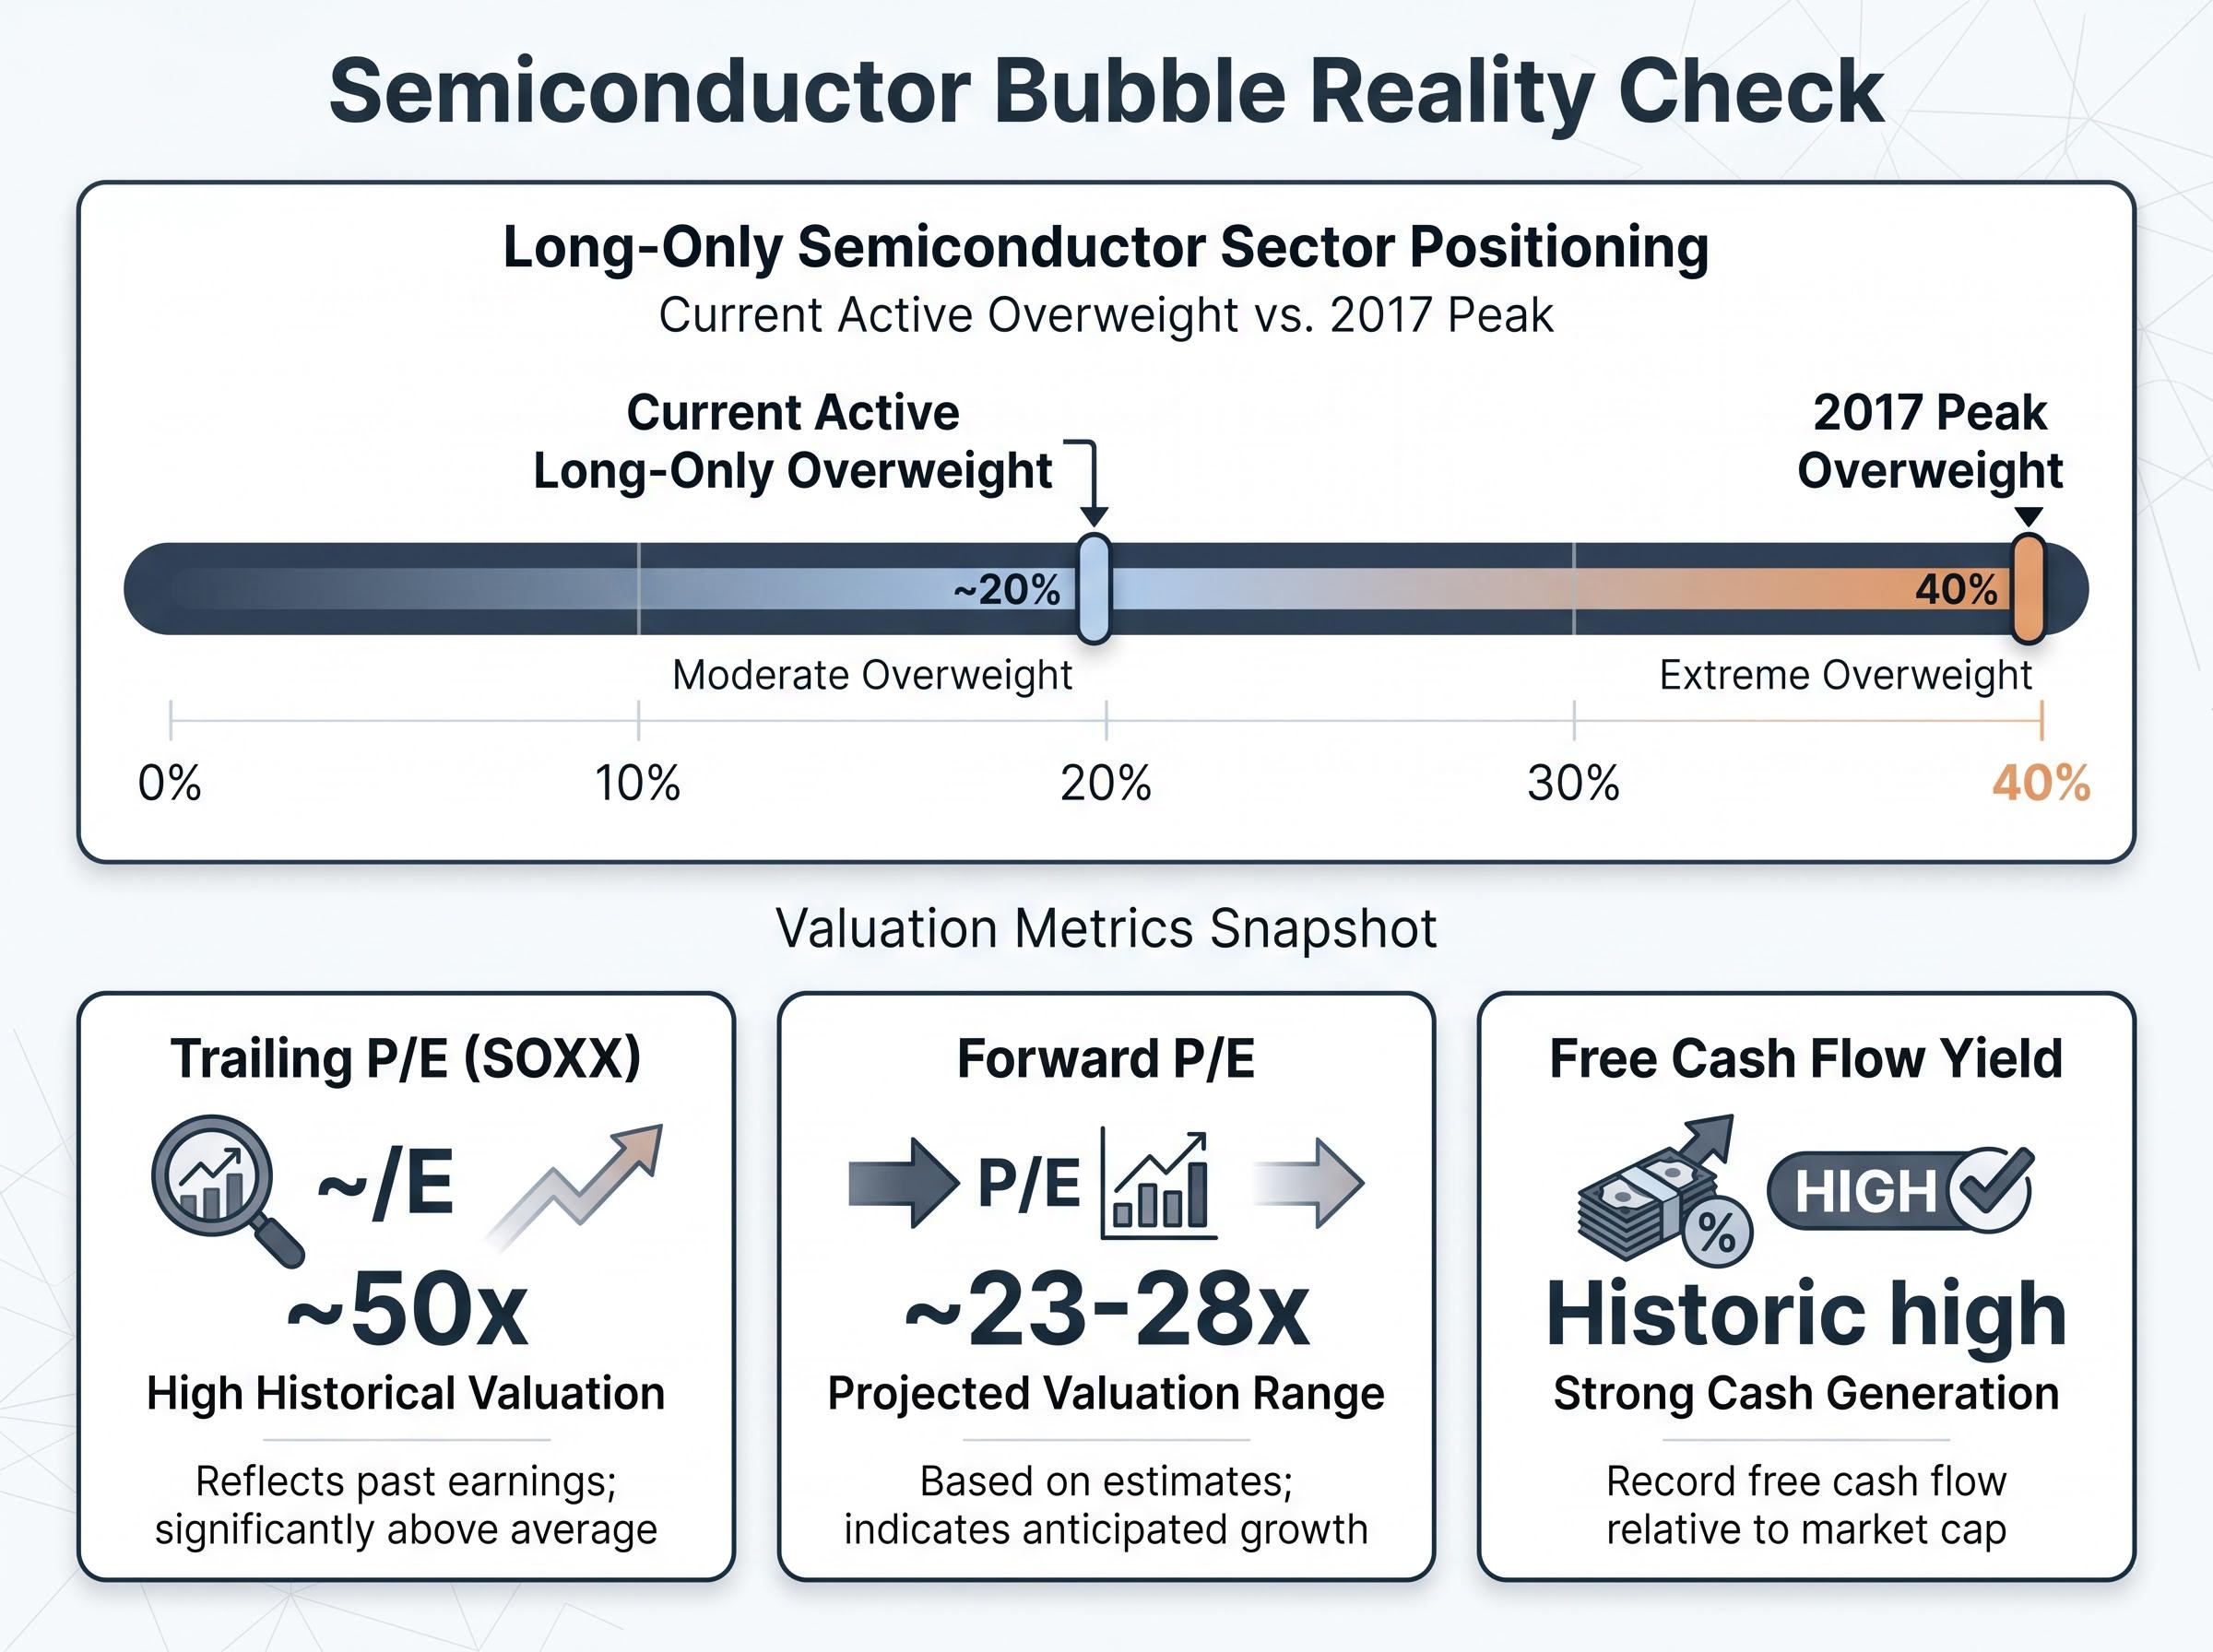
Active long-only overweight in semiconductors currently stands at approximately 20%, compared to a 2017 peak of 40% overweight, according to Subramanian’s analysis.
On earnings quality, the 20%-plus revision cycle is being driven by disclosed corporate capex commitments, not speculative revenue projections. And management tone across hyperscaler earnings calls has been consistent with the financial data disclosed, with capex guidance being raised rather than maintained against weakening fundamentals.
The dot-com analogue is instructive precisely because it highlights the differences. In 2000, technology companies were valued on revenue projections with no free cash flow to support them, and positioning had reached extremes. Semiconductors in 2026 exhibit record free cash flow yield and positioning at half of the prior cycle peak. “Expensive” and “in a bubble” are not the same category of risk. Conflating them leads to premature exits from sectors with genuine fundamental support.
The supercycle versus dot-com repeat debate has been sharpest around individual stock data points that aggregate index figures obscure: Intel reaching an all-time high for the first time in 26 years and Micron posting record quarterly net income of $13.79 billion are real earnings events, not narrative-driven multiple expansion, and they anchor the sector-wide case against speculative excess analogies.
Both semiconductors and software carry an active long-only overweight of approximately 20%. Similar positioning levels. Very different fundamental profiles underneath.
| Metric | Semiconductors | Software |
|---|---|---|
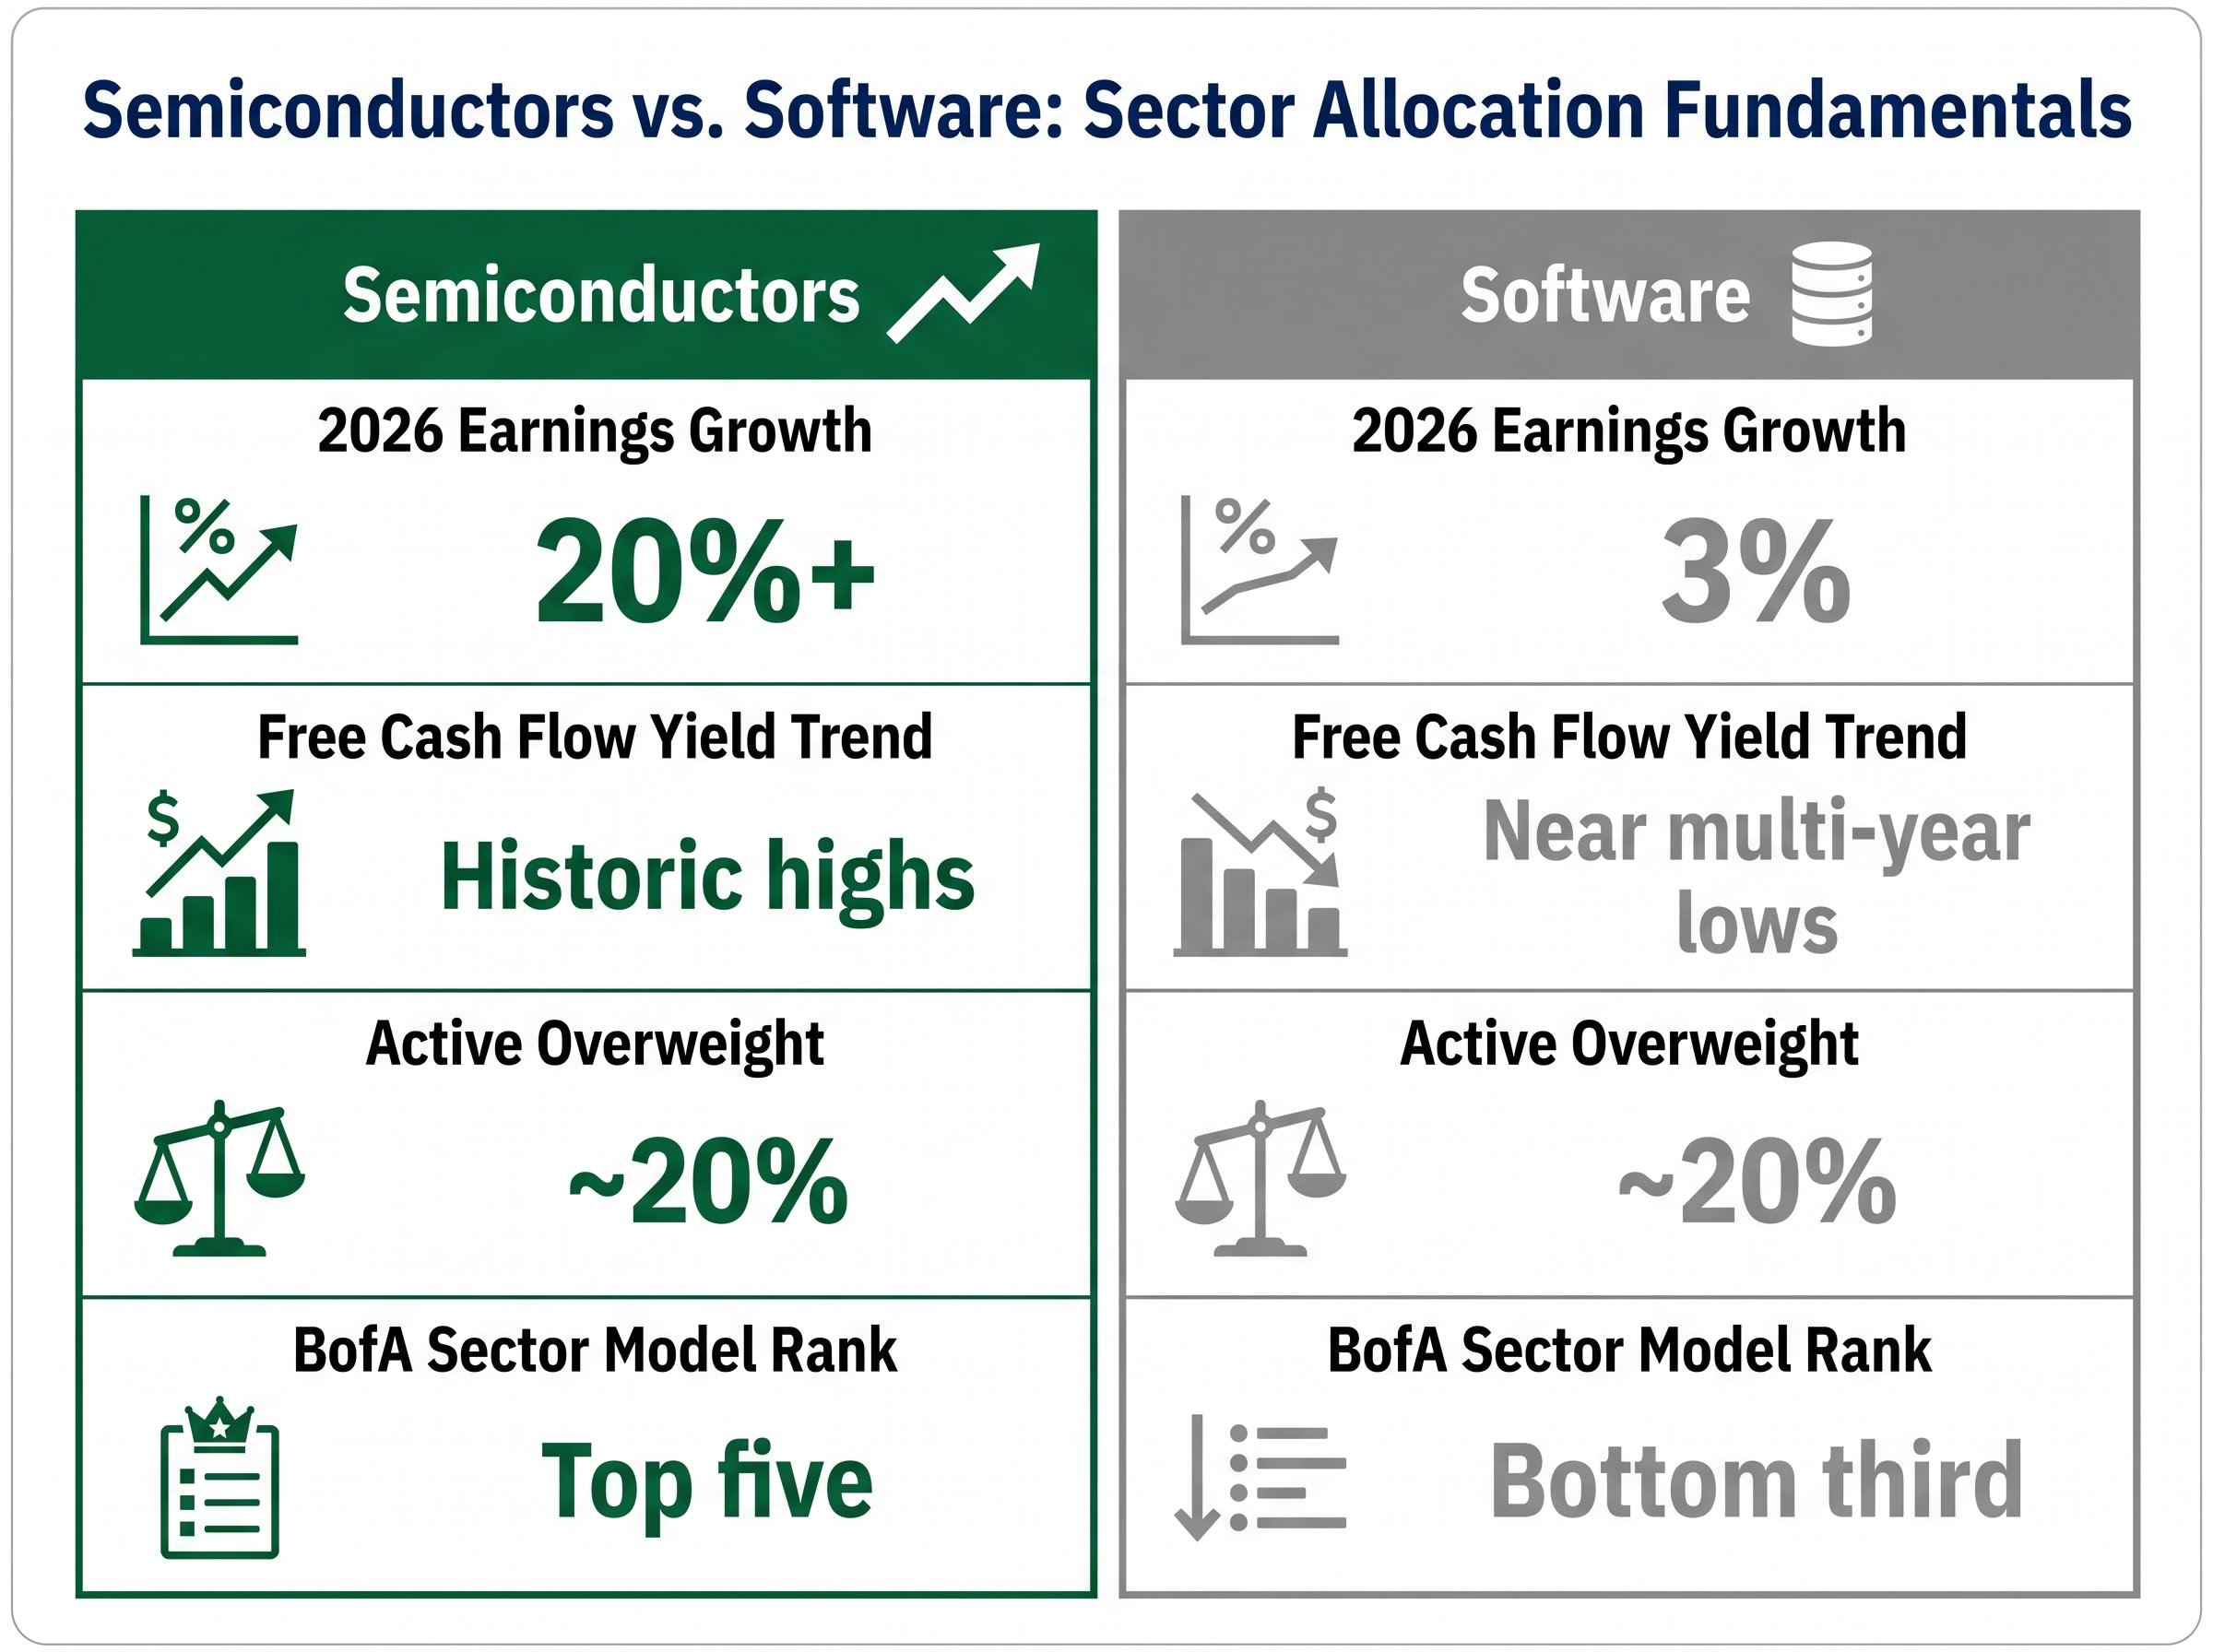
| 2026 Earnings Growth | 20%+ | 3% |
| Free Cash Flow Yield Trend | Historic highs | Near multi-year lows |
| Active Overweight | ~20% | ~20% |
| BofA Sector Model Rank | Top five | Bottom third |
Semiconductor earnings growth of more than 20% against software’s 3% is a sevenfold gap in fundamental momentum. Software’s free cash flow yield sits near multi-year lows while semiconductors are at record highs. Fund ownership breadth in software has shown minimal movement, indicating no meaningful capitulation from holders despite deteriorating relative fundamentals.
BofA’s sector ranking model reflects this divergence directly: semiconductors rank in the top five sectors, software in the bottom third. For an investor holding both, the data argues for maintaining the semiconductor overweight and scrutinising the software position. The allocation choice is not about growth versus value; it is about the quality of the earnings supporting each position.
The earnings revision cycle did not materialise from analyst enthusiasm. It traces directly to what the actual buyers of semiconductors are committing to spend.
These figures, disclosed during Q1 2026 earnings releases reported in late April 2026 (according to Fortune and Business Insider, 29 April 2026), represent the combined spending plans of the four companies that drive the majority of global data centre hardware procurement. Both Alphabet and Meta raised their guidance from prior ranges, indicating demand acceleration rather than plateau as of the most recent reporting period.
The chain from hyperscaler capex to semiconductor earnings is direct. Hyperscaler capital expenditure flows into data centre hardware procurement, which flows into semiconductor component demand, which flows into semiconductor company revenue forecasts, which flows into the earnings estimate revisions that analysts then price into valuations. Capex guidance is the upstream leading indicator. When it rises, semiconductor earnings estimates follow. That is the mechanism producing the 20%-plus revision cycle Subramanian is tracking.
This moves the demand case from analyst opinion to disclosed corporate commitments, a more durable basis for conviction than any single buy-side recommendation.
Subramanian’s note synthesises into a clear position: semiconductors are not overvalued relative to their fundamentals. Free cash flow yield is at historic highs. Earnings revisions exceed 20%. Positioning is at 20% overweight, half the 2017 cycle peak of 40%. On the data BofA is tracking, the bubble characterisation is not supported.
The broader context matters. BofA’s 2026 S&P 500 EPS estimate stands at $335, reflecting approximately 22% year-over-year earnings growth. The year-end S&P 500 price target remains at 7,100, a cautious stance maintained even as the EPS estimate was raised. Consensus long-term growth expectations for the S&P 500 rose to 16%, the highest since 2021, according to Subramanian’s May 2026 analysis. The broader market is assessed as expensive on 16 out of 20 metrics BofA monitors.
BofA assesses the S&P 500 as expensive on 16 out of 20 valuation metrics it monitors, yet identifies semiconductors as a top-five sector within that expensive market, a targeted contrarian call rather than broad market endorsement.
This tension is instructive. The semiconductor call is a specific sector-level view operating inside a sober market-level assessment. The allocation choice is best understood as a quality-of-earnings decision: which overweight is backed by fundamental momentum, and which is not.
Three conditions would weaken the semiconductor bull case:
Semiconductor stocks will remain volatile. The broader market is expensive by most institutional measures, and any single quarter where hyperscaler capex fails to translate into semiconductor revenue at the expected pace would pressure forward estimates. These risks are real and worth monitoring.
The claim that is not well-supported by the current data is that the sector is in a speculative bubble. The three core metrics from Subramanian’s 18 May 2026 note argue against it: free cash flow yield at historic highs, earnings revisions exceeding 20%, and active positioning at half of the prior cycle peak.
Indicators that would signal the bull case is deteriorating:
The data currently resolves the valuation question in favour of fundamental support. What it does not yet resolve is whether the $650-$725 billion in hyperscaler capex spending will convert to semiconductor revenue at the pace baked into forward estimates. That remains the test for the quarters ahead.
Investors monitoring the conditions that would weaken the semiconductor bull case will find our deep-dive into the capex-to-revenue lag risk examines Morningstar analyst Dennis Li’s 18-24 month conversion timeline, Gartner’s finding that only 20% of current AI agent pilots are scalable to production by 2027, and the geopolitically uneven distribution of export control risk across ASML, Nvidia, and AMD.
BofA’s analytical contribution is to replace the bubble narrative with a data-driven sector case built on earnings revision momentum and cash flow quality. The broader market remains expensive on most metrics, and BofA’s unchanged S&P 500 price target of 7,100 reflects continued caution at the index level. The semiconductor call is targeted, not a broad market endorsement. The next test arrives when Q2 2026 earnings reveal whether hyperscaler capex is flowing through into semiconductor revenue growth at the pace the current revisions assume.
This article is for informational purposes only and should not be considered financial advice. Investors should conduct their own research and consult with financial professionals before making investment decisions. Past performance does not guarantee future results. Financial projections are subject to market conditions and various risk factors.
A semiconductor bubble would require extreme institutional positioning, earnings driven by accounting fiction, and management tone disconnected from financials. As of May 2026, Bank of America analyst Savita Subramanian argues none of these three conditions are met, with active overweight at 20%, roughly half the 2017 peak of 40%, and earnings revisions exceeding 20% tied to real hyperscaler capex commitments.
Trailing P/E for the SOXX index sits around 50x because it measures earnings from the prior twelve months before the current revision cycle, while forward P/E for SMH is approximately 23x reflecting upgraded estimates. Free cash flow yield, which measures actual cash generation relative to market cap, is at historic highs for semiconductors, indicating the businesses are producing real distributable cash rather than inflated paper earnings.
Hyperscaler capex flows directly into data centre hardware procurement, which drives semiconductor component demand, revenue forecasts, and ultimately earnings estimate revisions. The four major hyperscalers, Alphabet, Meta, Microsoft, and Amazon, disclosed a combined estimated $650-$725 billion in 2026 capex guidance during Q1 2026 earnings releases, with both Alphabet and Meta raising their prior guidance ranges.
Despite both sectors carrying approximately 20% active long-only overweights, their fundamentals diverge sharply: semiconductors are tracking over 20% earnings growth in 2026 versus software's 3%, semiconductor free cash flow yields are at historic highs while software's are near multi-year lows, and Bank of America ranks semiconductors in the top five sectors while placing software in the bottom third.
According to Bank of America's May 2026 analysis, three conditions would weaken the semiconductor investment case: hyperscaler capex guidance being cut or revised downward in subsequent quarters, active long-only positioning approaching the prior cycle peak of 40% overweight, and free cash flow yield compressing from current historic highs.