On 15 May 2026, the SPDR S&P 500 ETF’s daily Relative Strength Index (RSI) registered 78. In the five previous instances since 2023 where a comparable reading preceded a decline of more than 1%, five of those six total historical instances resulted in drawdowns of at least 7%, with one exception producing sideways consolidation. Friday’s 1.2% drop may have been the opening move.
BTIG technical strategist Jonathan Krinsky flagged the signal the same day it appeared, citing a pattern that has been nearly without exception across the current market cycle. The session that followed delivered the kind of breadth collapse that, historically, accompanies the early stages of a larger unwind rather than a one-day flush.
What follows breaks down exactly what the RSI signal means, why the historical pattern carries weight, what the corroborating internal and macro evidence reveals, and what investors should monitor in the sessions ahead as they assess whether Friday marked a dip or the start of a drawdown.
What Friday’s selloff is actually telling you
On the surface, a 1.2% decline in SPY on 16 May 2026 looks like a mild pullback in a market that has been running hot. One bad session in a strong trend. The kind of day investors are conditioned to buy.
The internal picture tells a different story.
- SPY declined 1.2% on Friday, 16 May
- Approximately 70% of NYSE trading volume was concentrated in declining stocks, the highest such reading since March 2026
- SMH (the VanEck Semiconductor ETF) fell 3.8%, its worst single-session performance since March 2026
Approximately 70% of NYSE trading volume was concentrated in declining stocks on 16 May 2026, the highest such reading since March 2026.
Some rotation into software names was observed, but overall breadth remained broadly negative. The semiconductor decline was not random sector noise; it was the exact kind of leadership deterioration that Krinsky’s framework had flagged as a likely consequence of the overbought signal. When the stocks that carried an index higher are the ones selling hardest, the headline number understates the damage.
When big ASX news breaks, our subscribers know first
How RSI works and why a reading of 78 is genuinely rare
RSI, or the Relative Strength Index, is a momentum oscillator that measures the speed and magnitude of recent price changes on a scale of 0 to 100. A reading above 70 conventionally signals overbought conditions, meaning prices have risen quickly relative to recent history. A reading below 30 signals oversold conditions.
Most investors encounter RSI in the context of individual stocks, where readings above 70 occur regularly. A single company can surge on an earnings beat, a product launch, or a takeover bid, pushing its RSI into overbought territory for days or weeks at a time.
Why index-level RSI extremes carry more weight than single-stock readings
An index like the S&P 500 aggregates hundreds of positions. That diversification dampens volatility by design. For an index-level RSI to reach extreme territory, a broad and simultaneous wave of buying must occur across a large number of constituents.
- Individual stocks routinely hit RSI readings above 80; an index reaching 78 requires far broader participation
- Index-level extremes are statistically infrequent because diversification moderates the momentum swings that push RSI higher
- Each instance of an index-level RSI extreme therefore represents a genuine broad-market momentum event, not a single-name aberration
Since 2023, BTIG has identified only six instances where SPY dropped more than 1% following a daily RSI reading above 75. The sample size is small. But it is small precisely because the condition itself is rare, which is what gives the pattern its analytical weight.
The six-instance historical pattern that makes this signal credible
The first instance resolved in a drawdown of at least 7%. So did the second. And the third. By the time the pattern reached its fifth occurrence, the consistency was difficult to dismiss.
Five of the six historical instances since 2023 where SPY dropped more than 1% after a daily RSI reading above 75 resulted in peak-to-trough drawdowns of at least 7% in the weeks that followed. The sixth, which occurred in 2023, produced sideways consolidation before the uptrend eventually resumed. It did not produce a rally; it simply did not produce the drawdown the other five delivered.
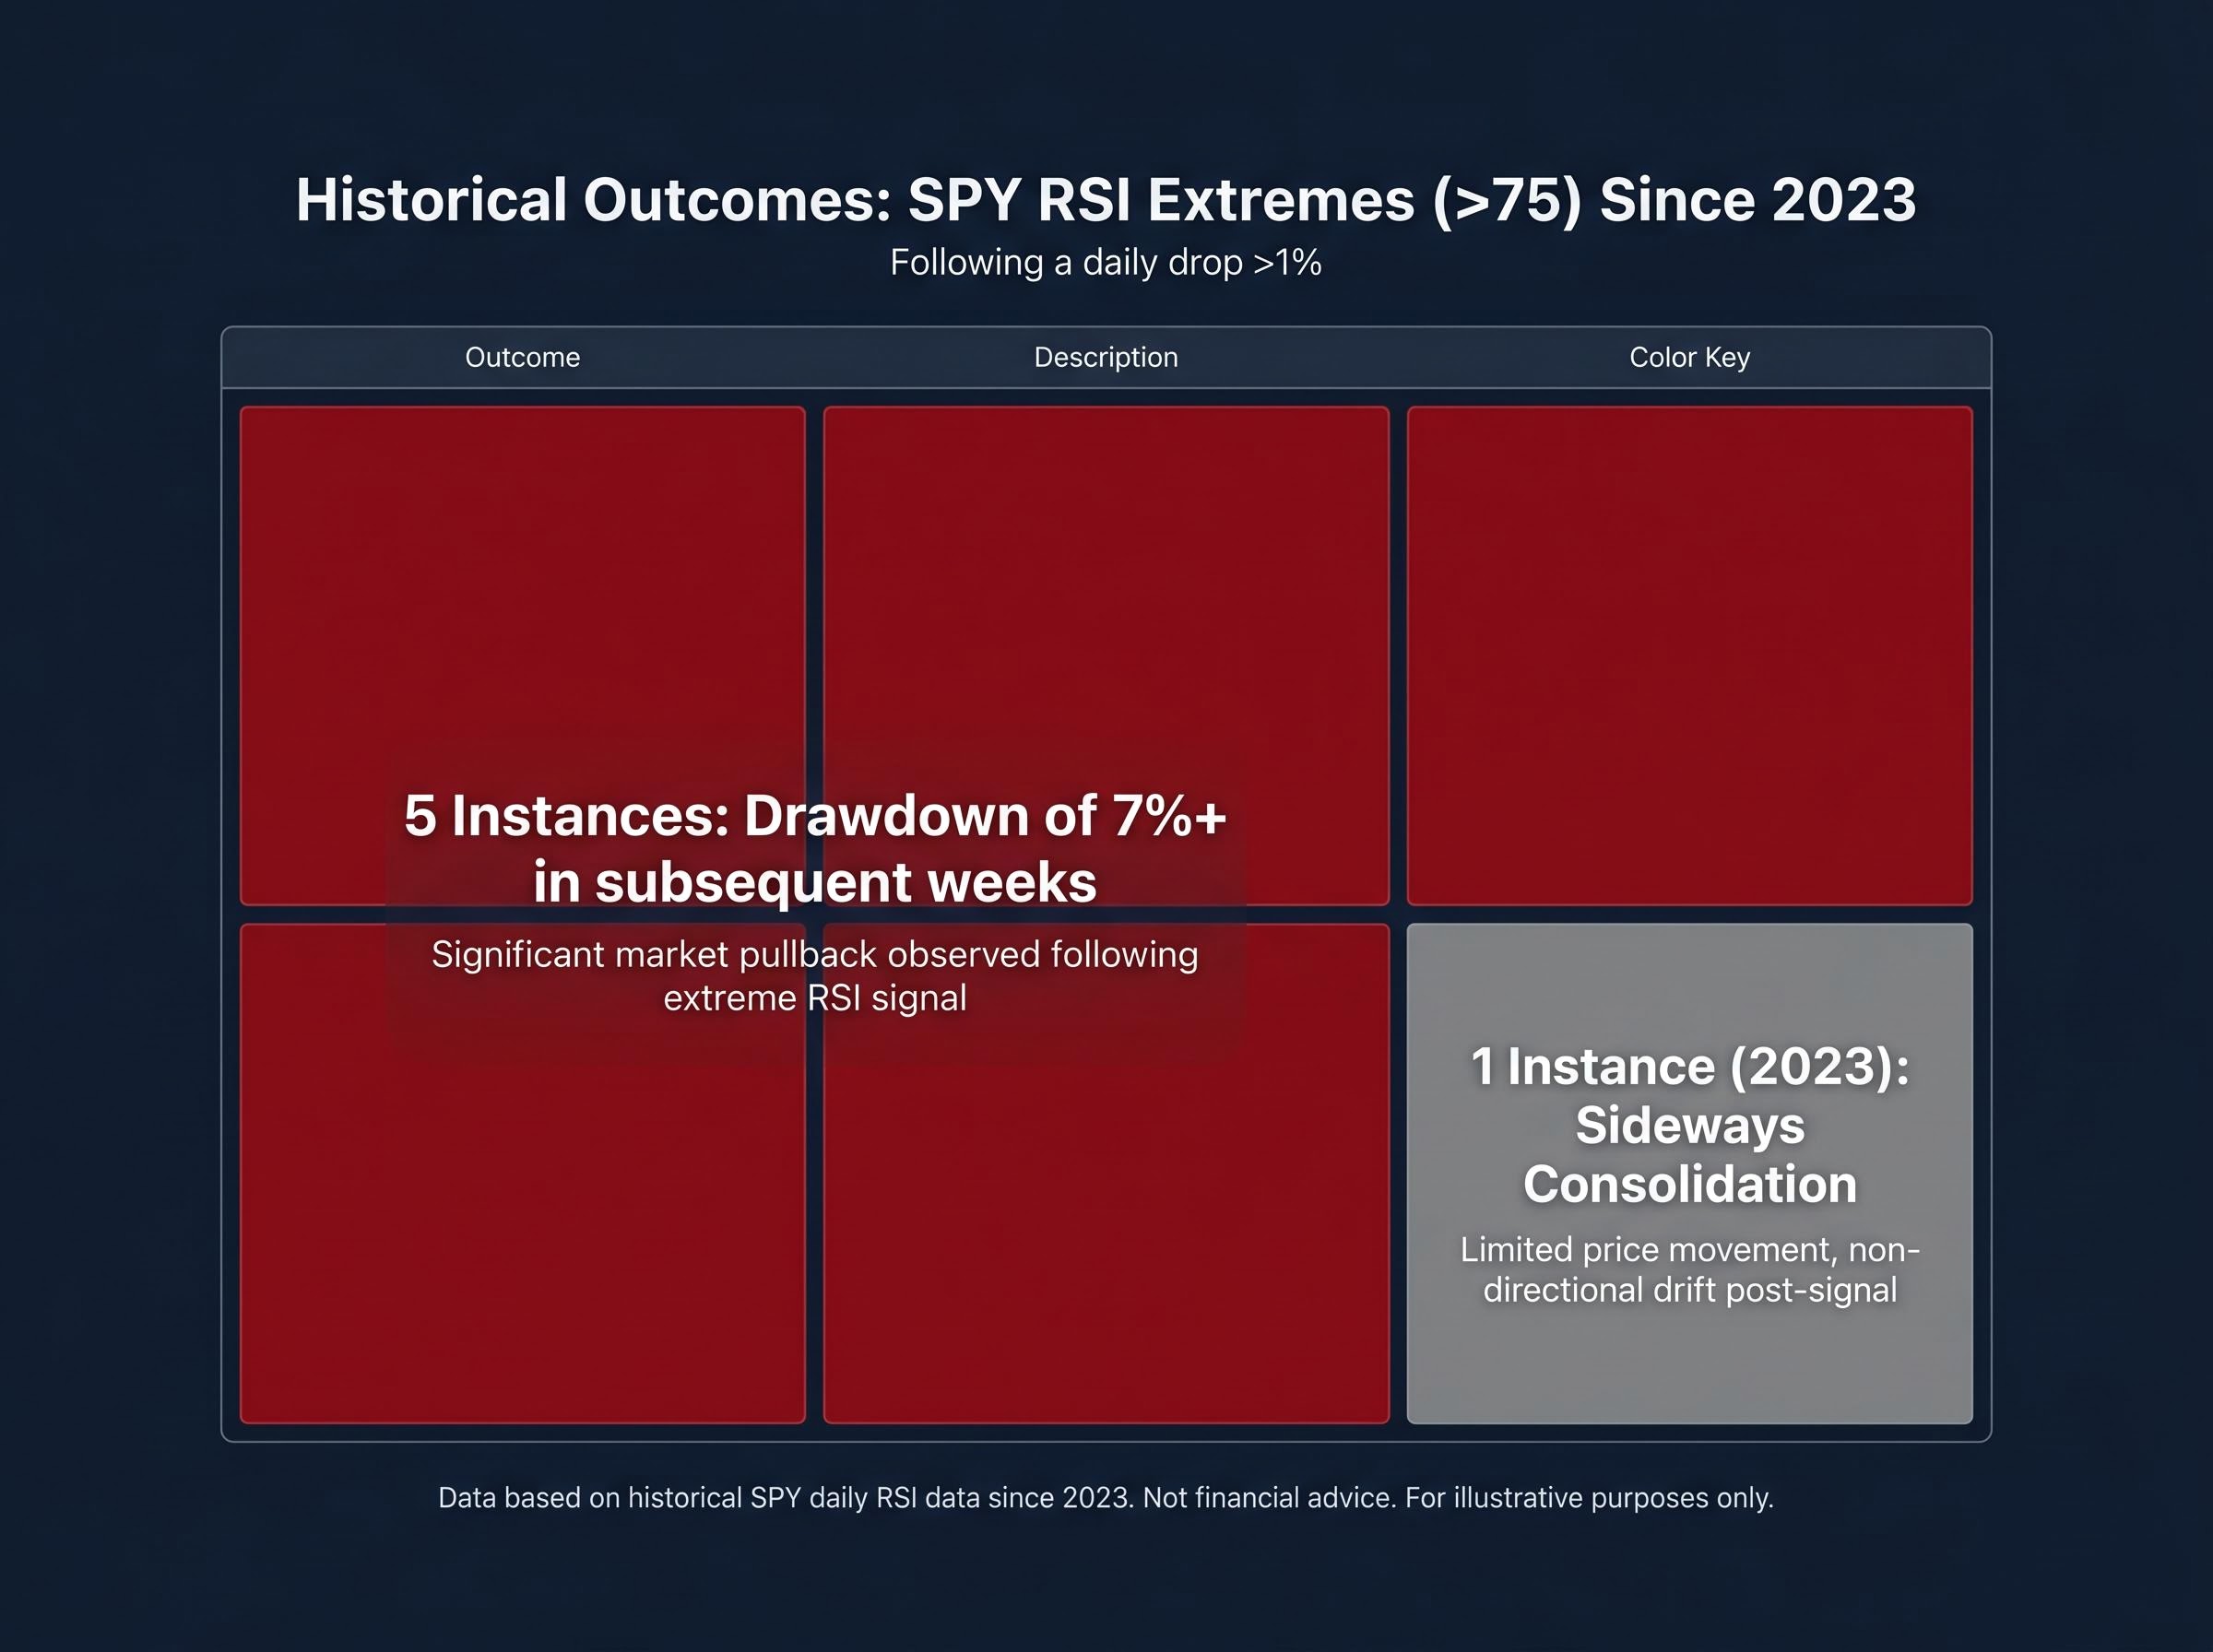
Five of six comparable RSI instances since 2023 produced drawdowns of at least 7% in the weeks following the signal.
According to BTIG’s Krinsky, average returns were negative across every measured timeframe from 5 to 40 days following the signal. That consistency across multiple horizons strengthens the directional bias the pattern implies.
| Instance | Approximate Period | Post-Signal Outcome | Drawdown Magnitude | Resolution |
|---|---|---|---|---|
| 1 | 2023 | Sideways consolidation | N/A | Sideways, then higher |
| 2 | 2024 | Drawdown | 7%+ | Drawdown |
| 3 | 2024 | Drawdown | 7%+ | Drawdown |
| 4 | 2025 | Drawdown | 7%+ | Drawdown |
| 5 | 2025 | Drawdown | 7%+ | Drawdown |
| 6 | 2026 | TBD / Pending | TBD / Pending | TBD / Pending |
The single exception does not invalidate the signal. It contextualises it. A 5-for-6 hit rate with a consistent directional bias across multiple timeframes gives the pattern enough weight to inform near-term positioning decisions rather than be dismissed as noise.
The divergence no one is talking about
The RSI signal does not exist in isolation. Beneath the index-level resilience that prevailed through mid-May, a widening gap between the S&P 500 and its own constituents had been building for weeks.
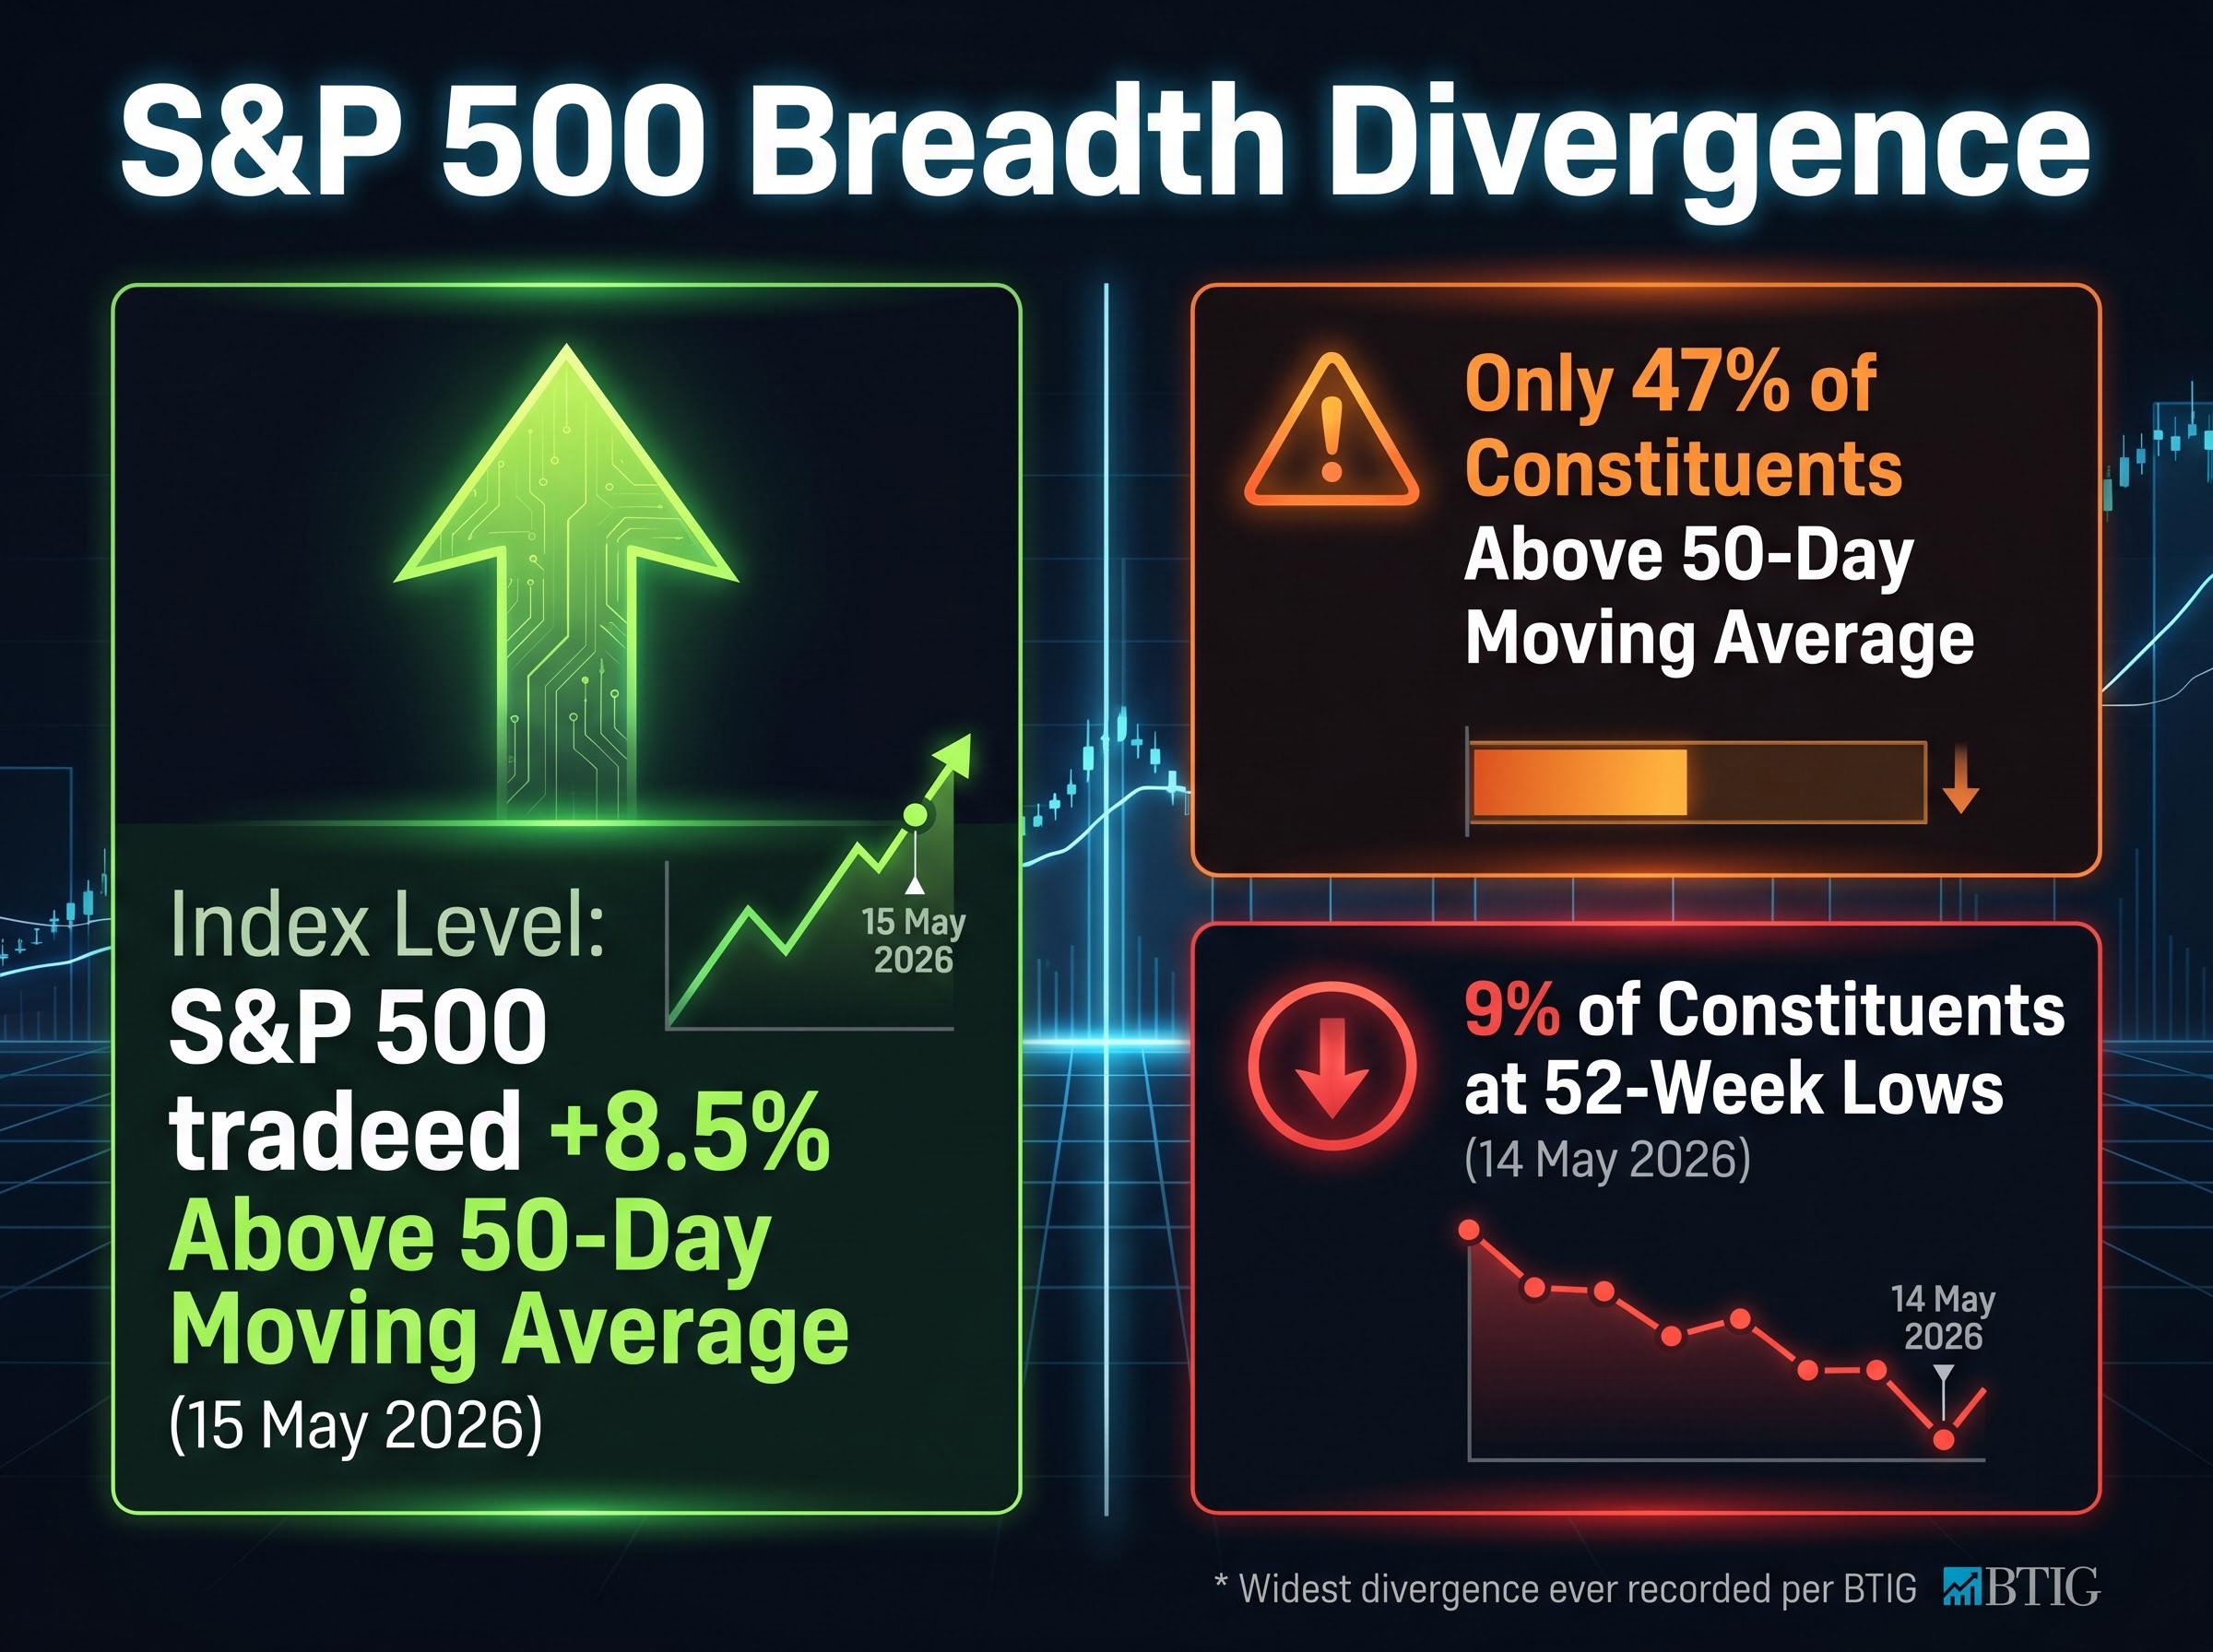
- As of 15 May 2026, the S&P 500 was trading 8.5% above its 50-day moving average, while only 47% of constituent stocks were above their individual 50-day moving averages; Krinsky described this as the widest such divergence ever recorded
- Approximately 9% of S&P 500 constituents were registering 52-week lows as of 14 May 2026, despite the index itself holding near recent highs
- Krinsky noted that deterioration in market internals had been accumulating for several weeks prior to the 15 May signal
The S&P 500 sat 8.5% above its 50-day moving average on 15 May 2026, while only 47% of its constituents traded above theirs, a divergence Krinsky characterised as the widest ever recorded.
This is the data that reframes the 16 May selloff. A market where nearly half the constituents are already below their 50-day averages, and nearly one in ten is at a 52-week low, is not a market experiencing broad-based strength. The index-level number has been carried by a narrow cohort. Friday’s breadth collapse confirmed what the internals had been signalling for weeks; it did not create the weakness.
Why the 30-year yield above 5% changes the calculus for tech
The 30-year U.S. Treasury yield had risen back above 5% by mid-May 2026, approaching its 2023 cycle high of approximately 5.17%. At the index level, the S&P 500 had largely absorbed this move without visible damage.
- At the index level, the market appeared resilient to the rate move
- At the constituent level, the typical S&P 500 stock had not been insulated from rate pressure in the way the headline performance implied, per Krinsky
The distinction matters. A cap-weighted index dominated by a handful of mega-cap technology names can mask the stress that higher rates impose on the broader market.
Tech’s resilience to rates may not survive a 5%-plus 30-year yield regime
Growth and AI-related stocks are long-duration assets. Their valuations depend heavily on the present value of future cash flows, which compresses when long-end yields rise. As long as rates remained near their prior range, the concentration of the index in these names was a source of strength. If the 30-year yield establishes a durably higher range above 5%, that concentration becomes a source of vulnerability.
Krinsky warned explicitly that durably higher long-end yields would likely become a meaningful headwind for technology and AI-related names. For investors holding concentrated positions in these sectors, the rate environment represents a compounding risk factor that the headline index return has so far obscured.
The global bond market selloff unfolding simultaneously in May 2026 adds a dimension that the current article’s focus on the 30-year Treasury alone cannot fully capture: Japan’s 30-year government bond yield hit an all-time high of 4.17% on 18 May, European yields repriced upward in parallel, and CME FedWatch moved to pricing a greater than 50% probability of a Fed rate hike by December 2026, a constellation that has historically amplified drawdown pressure on long-duration equity valuations.
What record tech concentration means for the S&P 500 forecast
The S&P 500 technology sector’s weighting reached a fresh record of 37.5% as of mid-May 2026. That exceeds the prior peak recorded during the dot-com bubble period, per BTIG’s Krinsky.
The S&P 500 technology sector weighting reached a record 37.5% as of mid-May 2026, surpassing the concentration peak of the dot-com era, according to BTIG.
The mechanical consequence is straightforward:
- At 37.5% technology weighting, the index’s performance is dictated by a narrow band of large-cap tech names
- Weakness in that cohort translates directly into index-level drawdowns, compressing the buffer that diversification normally provides
- If the five historical RSI-triggered drawdowns averaged at least 7%, the current setup’s narrower leadership base could produce a similar or larger move from fewer names selling off
This is not a theoretical risk. Friday’s session demonstrated the mechanism in real time. SMH fell 3.8% while broader rotation failed to offset the damage. At this concentration level, investors holding broad index exposure cannot rely on diversification to cushion a technology-led selloff.
Five signals, one exception, and what to watch next
The RSI reading, the breadth deterioration, the rising long-end yields, and the record technology concentration do not each tell the same story independently. Together, they form a compounding risk stack where each element amplifies the others. Overbought momentum is more dangerous when breadth is already weak. Narrow leadership is more fragile when the sector carrying the index faces a rate headwind. The pattern’s 5-for-6 hit rate is harder to dismiss when the supporting conditions are more aligned than in any of the five prior drawdown instances.
The 2023 exception remains a live possibility. Markets can absorb overbought signals through sideways consolidation rather than drawdown. But the current divergence between the index and its constituents, the proximity of the 30-year yield to its cycle high, and the record concentration were not present to the same degree in 2023.
For investors exploring what a technology-led drawdown scenario could mean for positioning across the broader market, our dedicated guide to small-cap rotation signals examines the Russell 2000’s 6-percentage-point outperformance of the S&P 500 year to date in 2026, the institutional fund flow shift from approximately 8% to 25% of equity inflows toward small-caps, and the valuation gap that has historically widened before rotation accelerates.
Four data points to monitor in the sessions ahead
- SPY breadth readings in subsequent sessions: a recovery led by broad participation would challenge the drawdown thesis; continued concentration in declining volume would confirm it
- SMH price action: whether the 3.8% decline finds buyers or continuation selling in the sessions ahead
- 30-year Treasury yield relative to the 5.17% cycle peak from 2023: a sustained break above would add pressure to long-duration equities
- Percentage of S&P 500 constituents above their 50-day moving averages: improvement from the 47% reading would signal genuine breadth recovery
The RSI reading resolved quickly in 2023. This time, the conditions look different.
The signal is rare. The historical pattern is directionally consistent. And the supporting evidence, breadth divergence, yield pressure, and record concentration, is unusually aligned.
In 2023, the lone exception that produced sideways consolidation rather than a drawdown occurred without comparable breadth divergence, without the 30-year yield above 5%, and without technology concentration at 37.5%. Those conditions do not guarantee a worse outcome this time. They do raise the bar for dismissing the signal as a repeat of the exception.
The 5-to-40-day window where average forward returns have historically turned negative begins now. The next 5-10 sessions will either confirm the historical pattern or produce the second exception in this cycle. Investors who understand the full signal stack, and the specific conditions that would confirm or refute it, are positioned to distinguish signal from noise as the data arrives.
This article is for informational purposes only and should not be considered financial advice. Investors should conduct their own research and consult with financial professionals before making investment decisions. Past performance does not guarantee future results. Financial projections are subject to market conditions and various risk factors.
—