Goodman Group’s 18% Pullback: Decoding the Metrics That Matter
16 mins ago
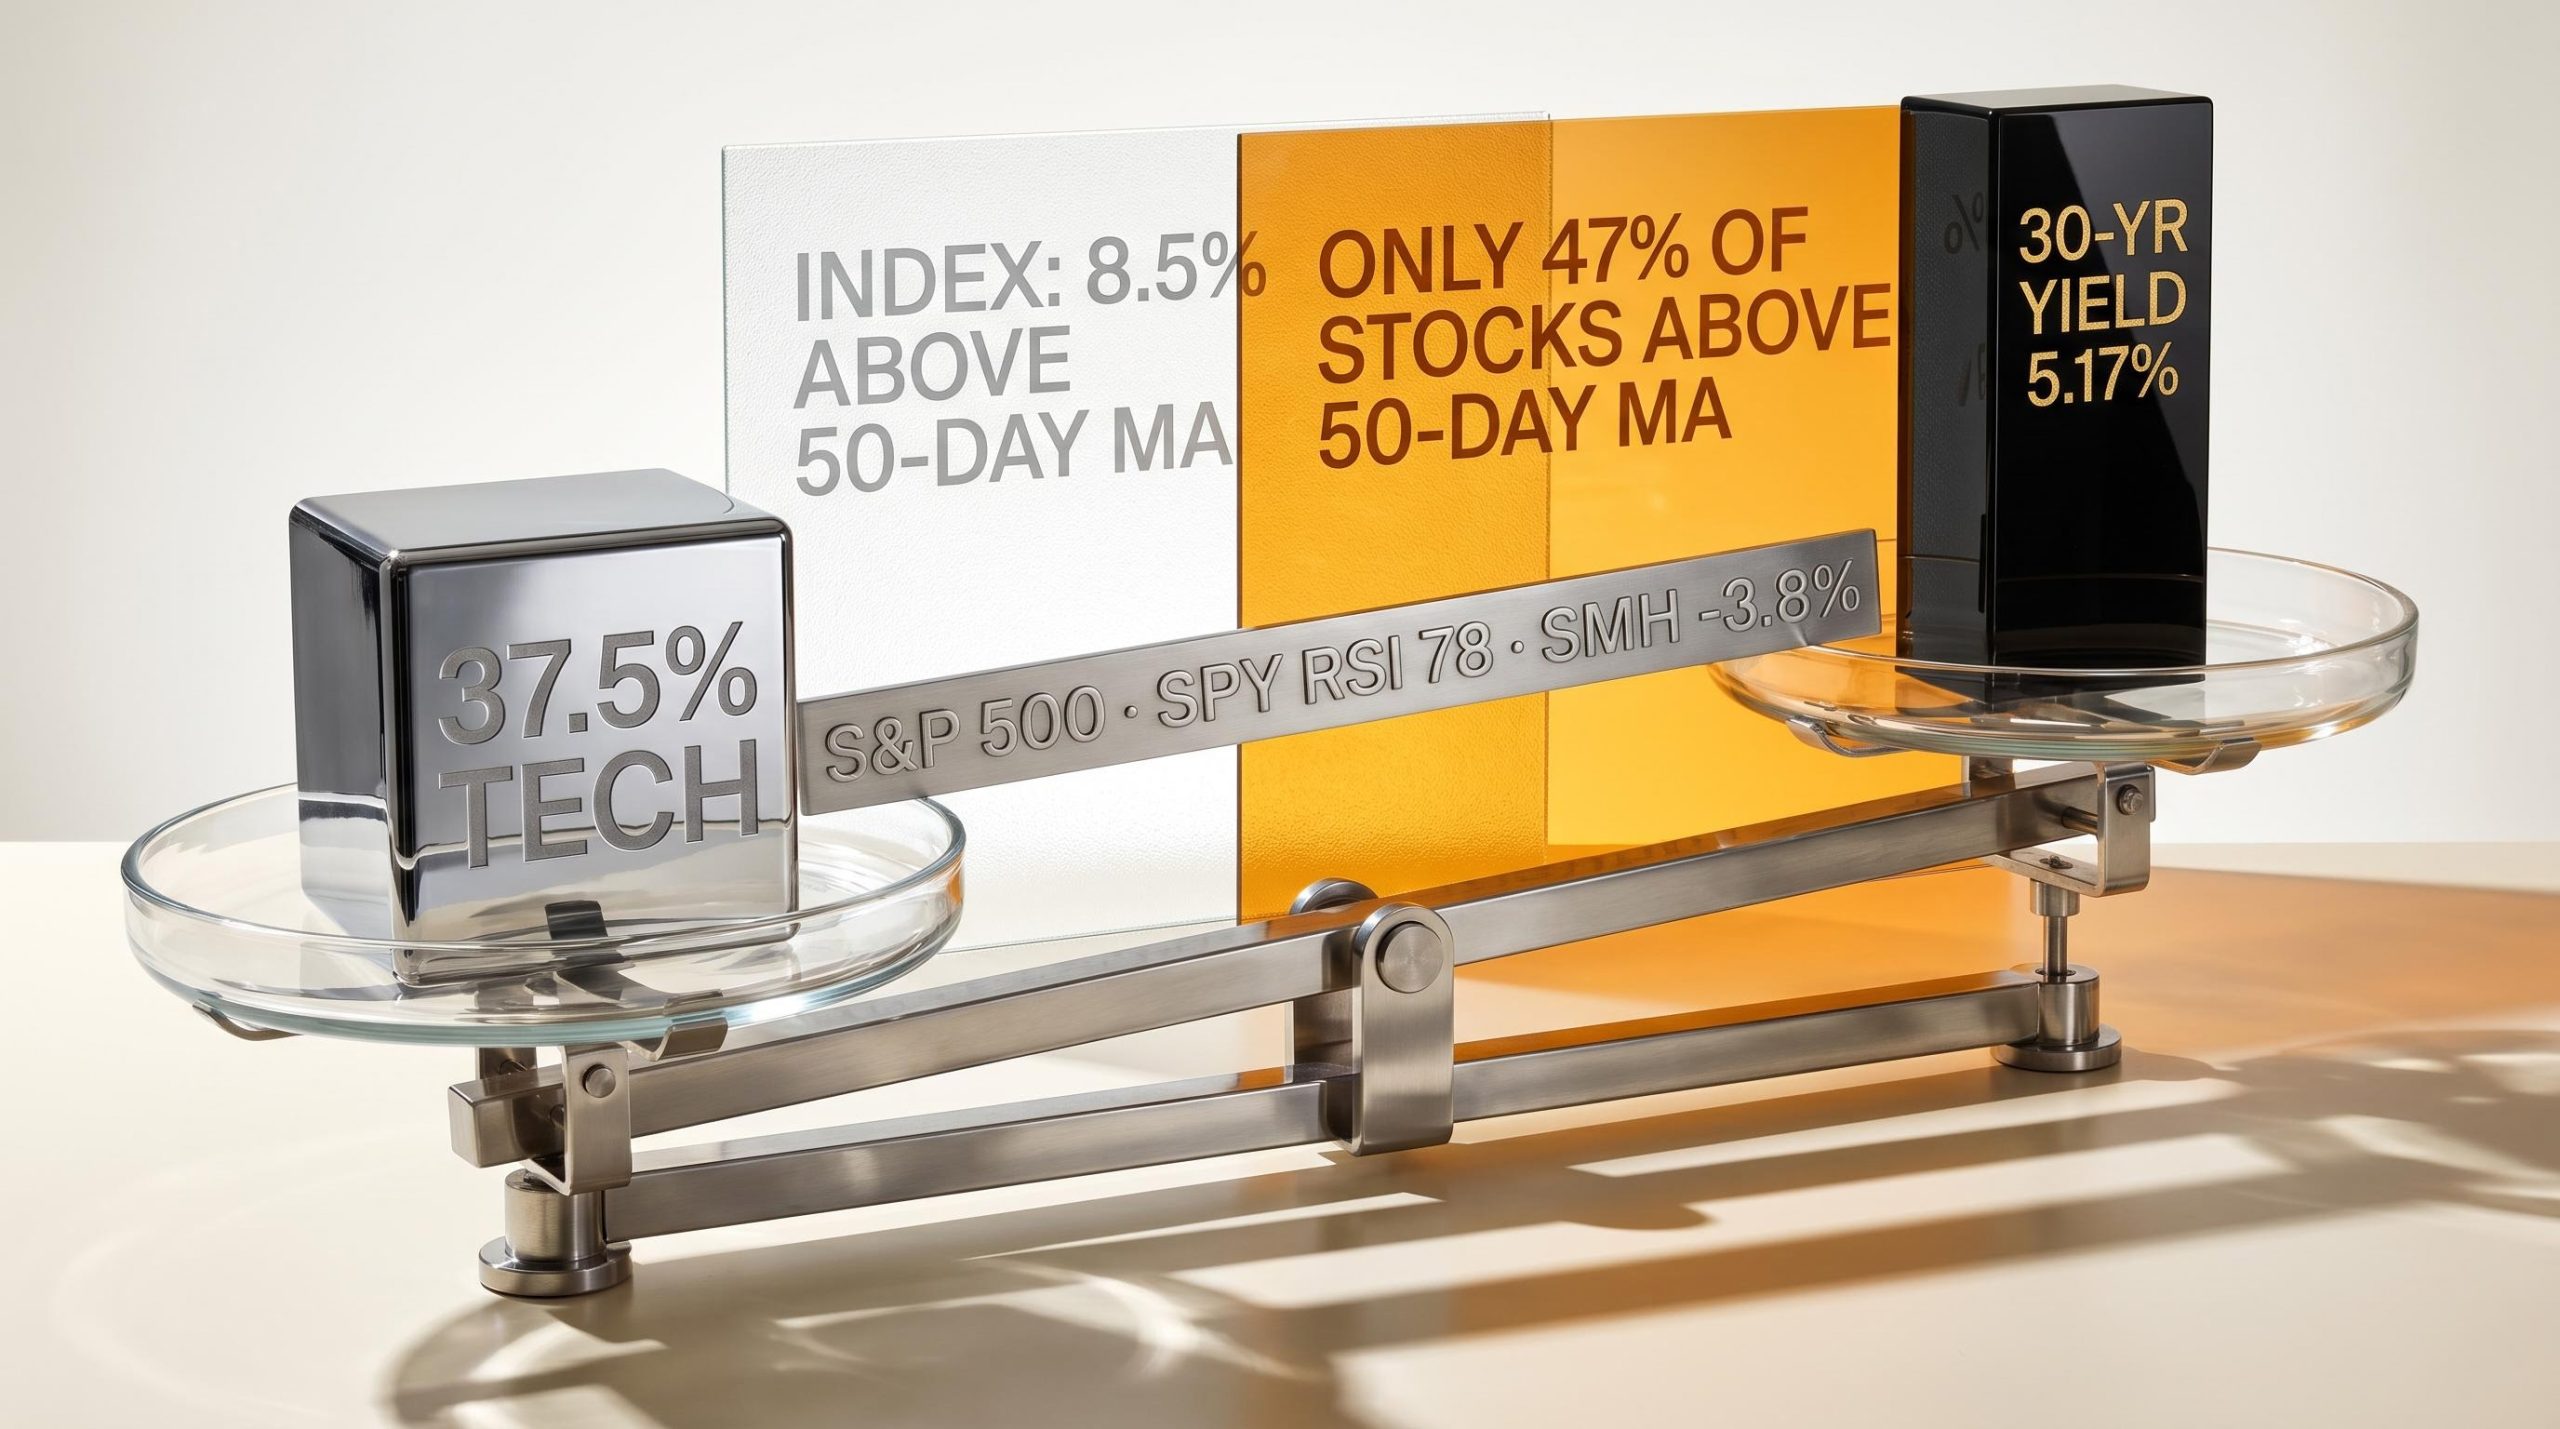
The S&P 500 information technology sector now accounts for 37.5% of the entire index by market capitalisation, according to BTIG’s Jonathan Krinsky, a figure that surpasses even the dot-com bubble’s peak concentration. At the same moment, the 30-year Treasury yield has climbed back above 5% and is closing in on its 2023 cycle high of 5.17%. These two forces have developed largely in parallel through 2025 and into mid-2026, but their convergence is creating a structural setup that institutional strategists at Morgan Stanley, JPMorgan, and BTIG have each flagged as unusually fragile. The index-level resilience that has allowed the S&P 500 to absorb rising yields so far rests almost entirely on the continued outperformance of a very small number of mega-cap tech and AI names. What follows is an examination of why tech concentration and rising long-term yields are individually concerning, why they compound each other in a way not yet visible in headline index performance, and what a genuine stock market correction would look like if these pressures intersect.
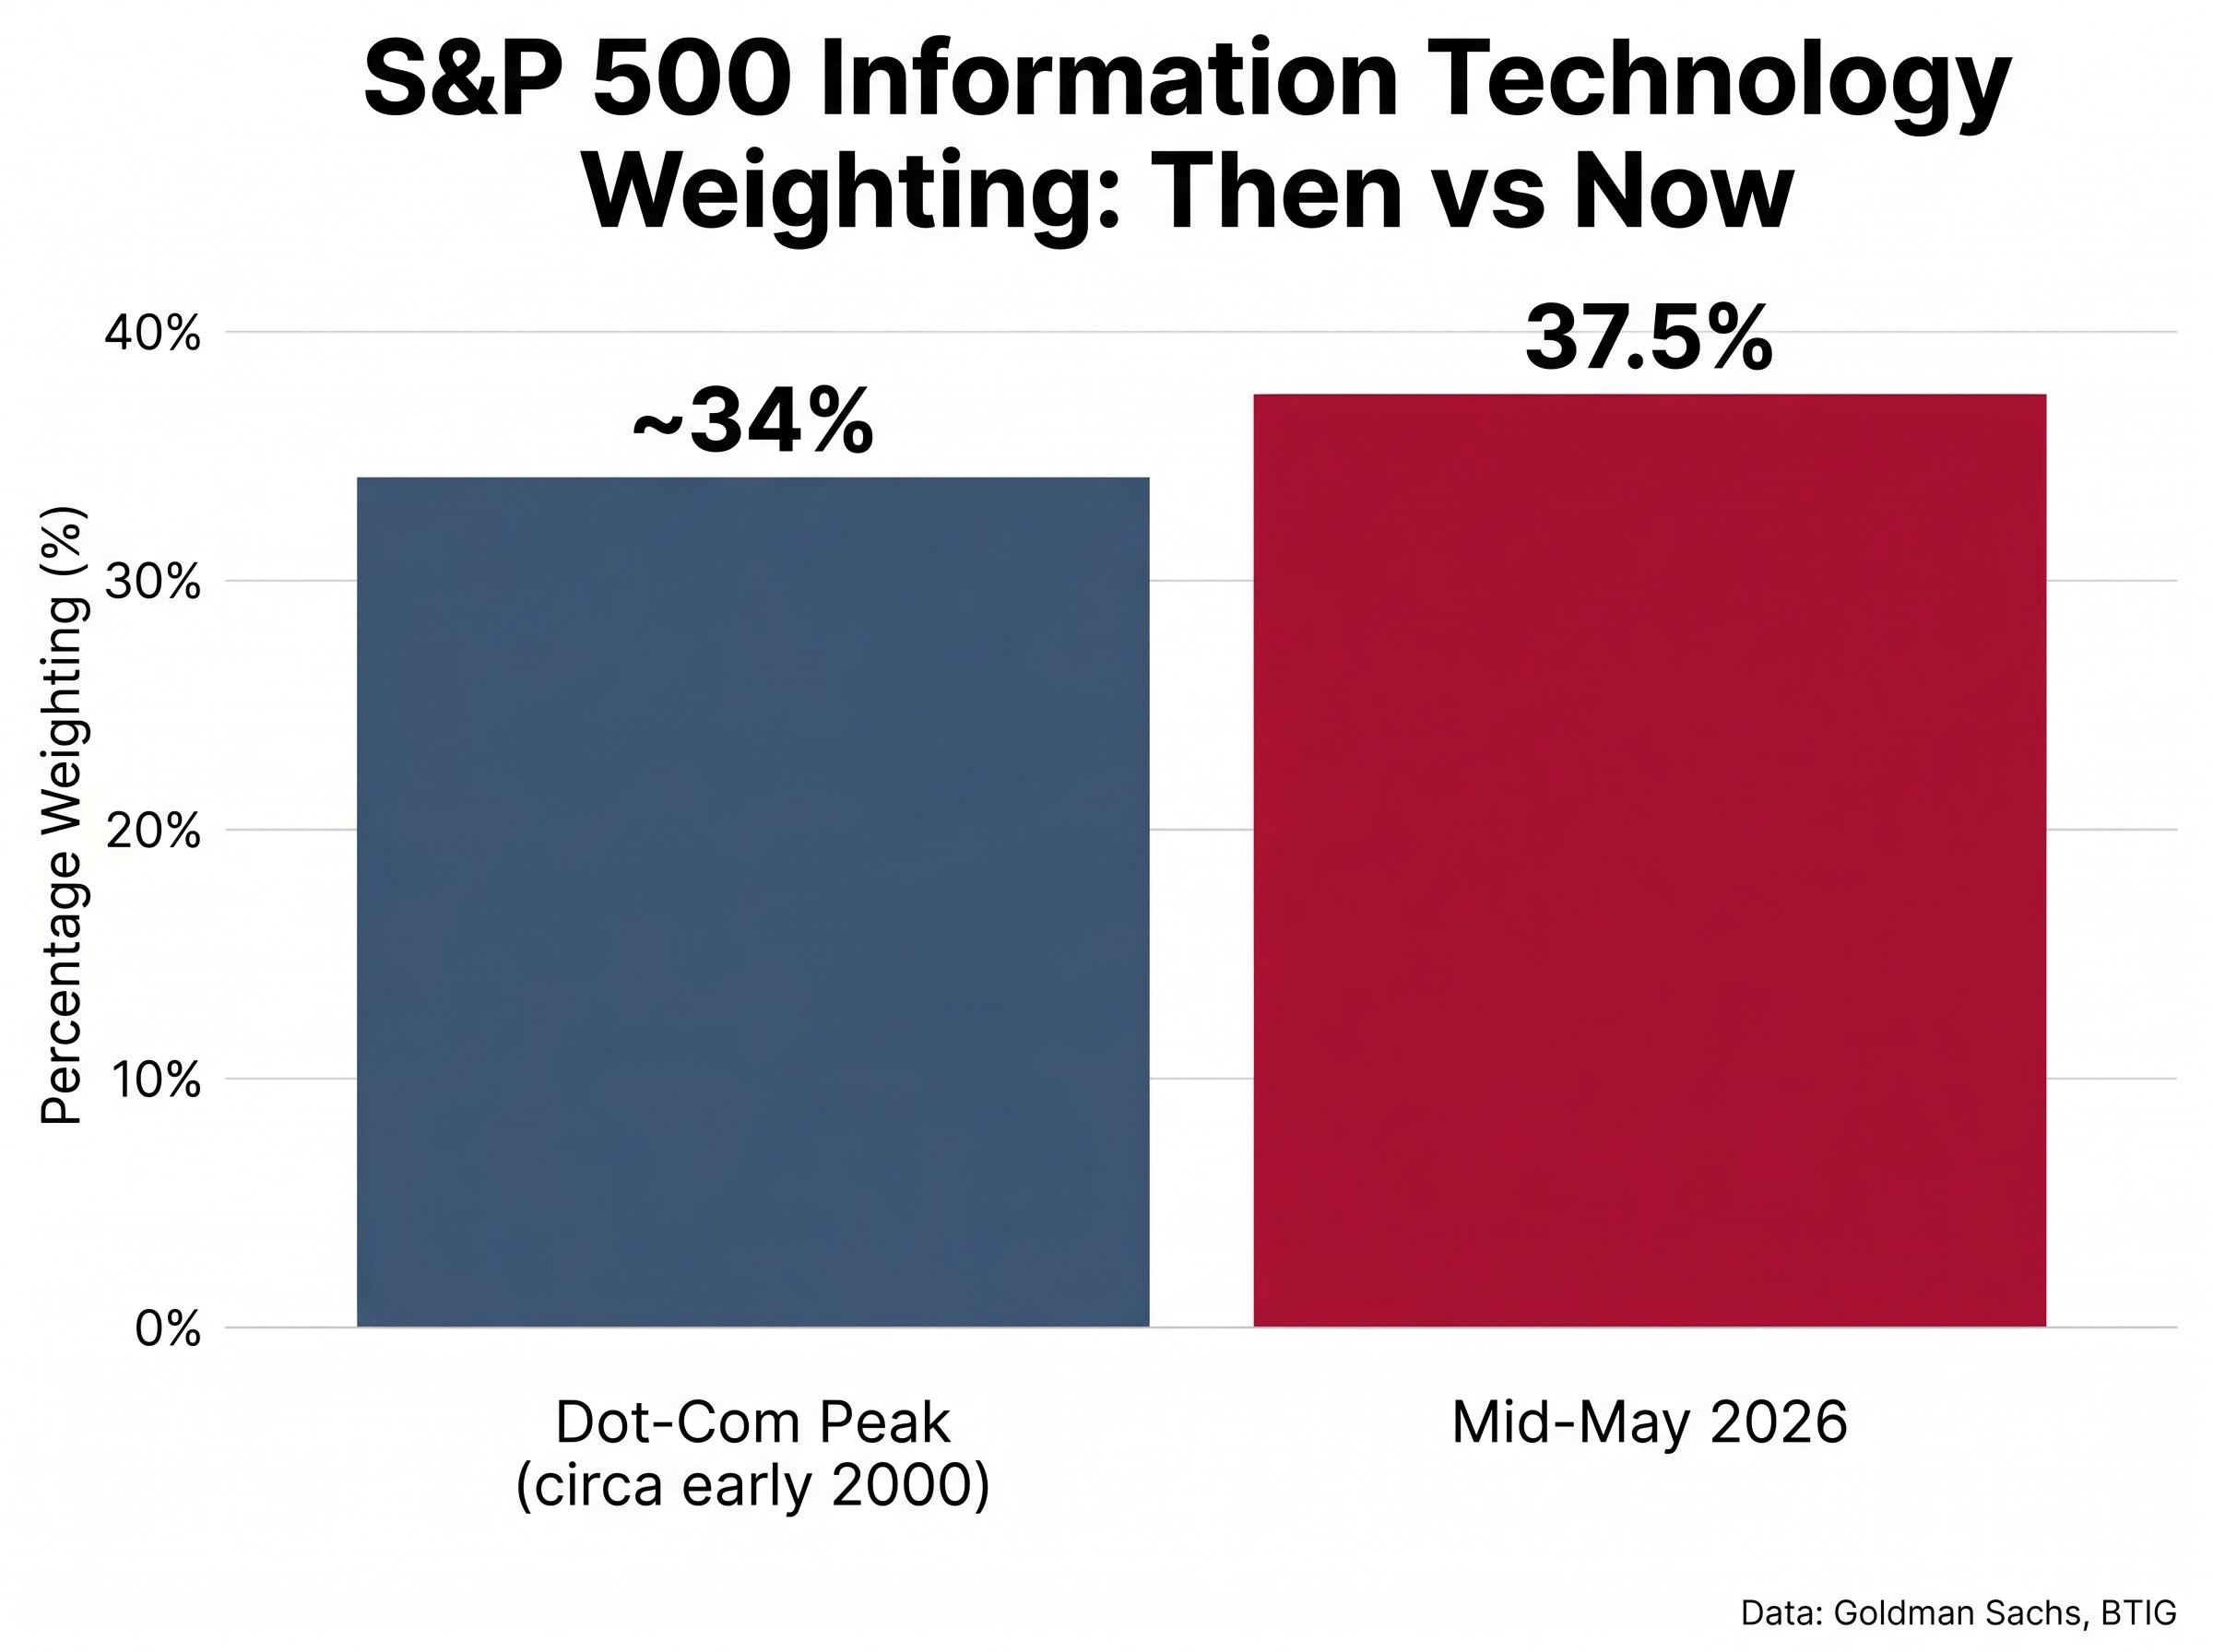
The number demands a double-take. Technology stocks now represent 37.5% of the S&P 500’s total market capitalisation, per BTIG data from mid-May 2026. That is not a rounding error above the dot-com era; it is a structural overshoot.
“The S&P 500 is more concentrated in Big Tech than during the dot-com bubble,” Goldman Sachs noted in research cited by CNBC in April 2024.
Source-level variation exists in the precise figure, reflecting methodological differences across providers:
Even the lowest of these readings sits near the historical extreme. The Financial Times reported in April 2024 that the top 10 S&P 500 stocks alone accounted for roughly 33% of index market capitalisation, with technology-related sectors dominating that cohort. In effect, the index’s daily performance is a leveraged bet on a handful of names, not a diversified read on the U.S. economy.
Goldman Sachs Global Investment Research placed the dot-com era peak IT weighting at approximately 34%, circa early 2000. Today’s 37.5% reading exceeds that by more than three percentage points.
One distinction matters. Morningstar, Goldman Sachs, and others consistently emphasise that today’s mega-cap tech firms carry stronger earnings, margins, and balance sheets than their dot-com predecessors. That is a meaningful difference. But concentration risk is structural regardless of earnings quality. When a third of an index is one sector, a sector-level de-rating becomes an index-level event.
Valuation frameworks for mega-cap tech produce meaningfully different verdicts depending on the metric applied: the Shiller CAPE ratio at 40-41 places the current cycle among the three most extreme episodes in 155 years of market data, yet sector forward multiples of 23-36x and 27% year-on-year Q1 2026 earnings growth distinguish it sharply from the unprofitable dot-com names trading at 50x forward earnings.
Market-cap weighting is straightforward in principle: larger companies receive higher weights, and their price moves dominate index returns disproportionately. When a single sector commands 37.5% of the weight, its daily performance effectively sets the direction for the index as a whole.
The consequence is a widening gap between what the S&P 500 headline number communicates and what the average stock is actually doing. As of 15 May 2026, BTIG’s Jonathan Krinsky documented this divergence in stark terms: the S&P 500 sat 8.5% above its 50-day moving average, while only 47% of constituent stocks were above their own 50-day moving averages. Krinsky described this as the widest such divergence ever recorded.
Cap-weighted index mechanics systematically compound this problem over time: as mega-cap tech prices rise, their index weights rise with them, forcing passive funds to allocate more capital to names that are already expensive and making the headline return increasingly a single-sector story rather than a broad-economy read.
| What the S&P 500 index shows | What the average constituent stock shows |
|---|---|
| Index 8.5% above its 50-day moving average | Only 47% of stocks above their 50-day moving averages |
| Index trading near recent highs | ~9% of constituents at 52-week lows (14 May 2026) |
| Headline suggests broad strength | ~70% of NYSE volume in declining stocks (16 May 2026) |
This creates a specific correction vulnerability. When the narrow leaders eventually sell off, there is no broad market base to absorb the blow.
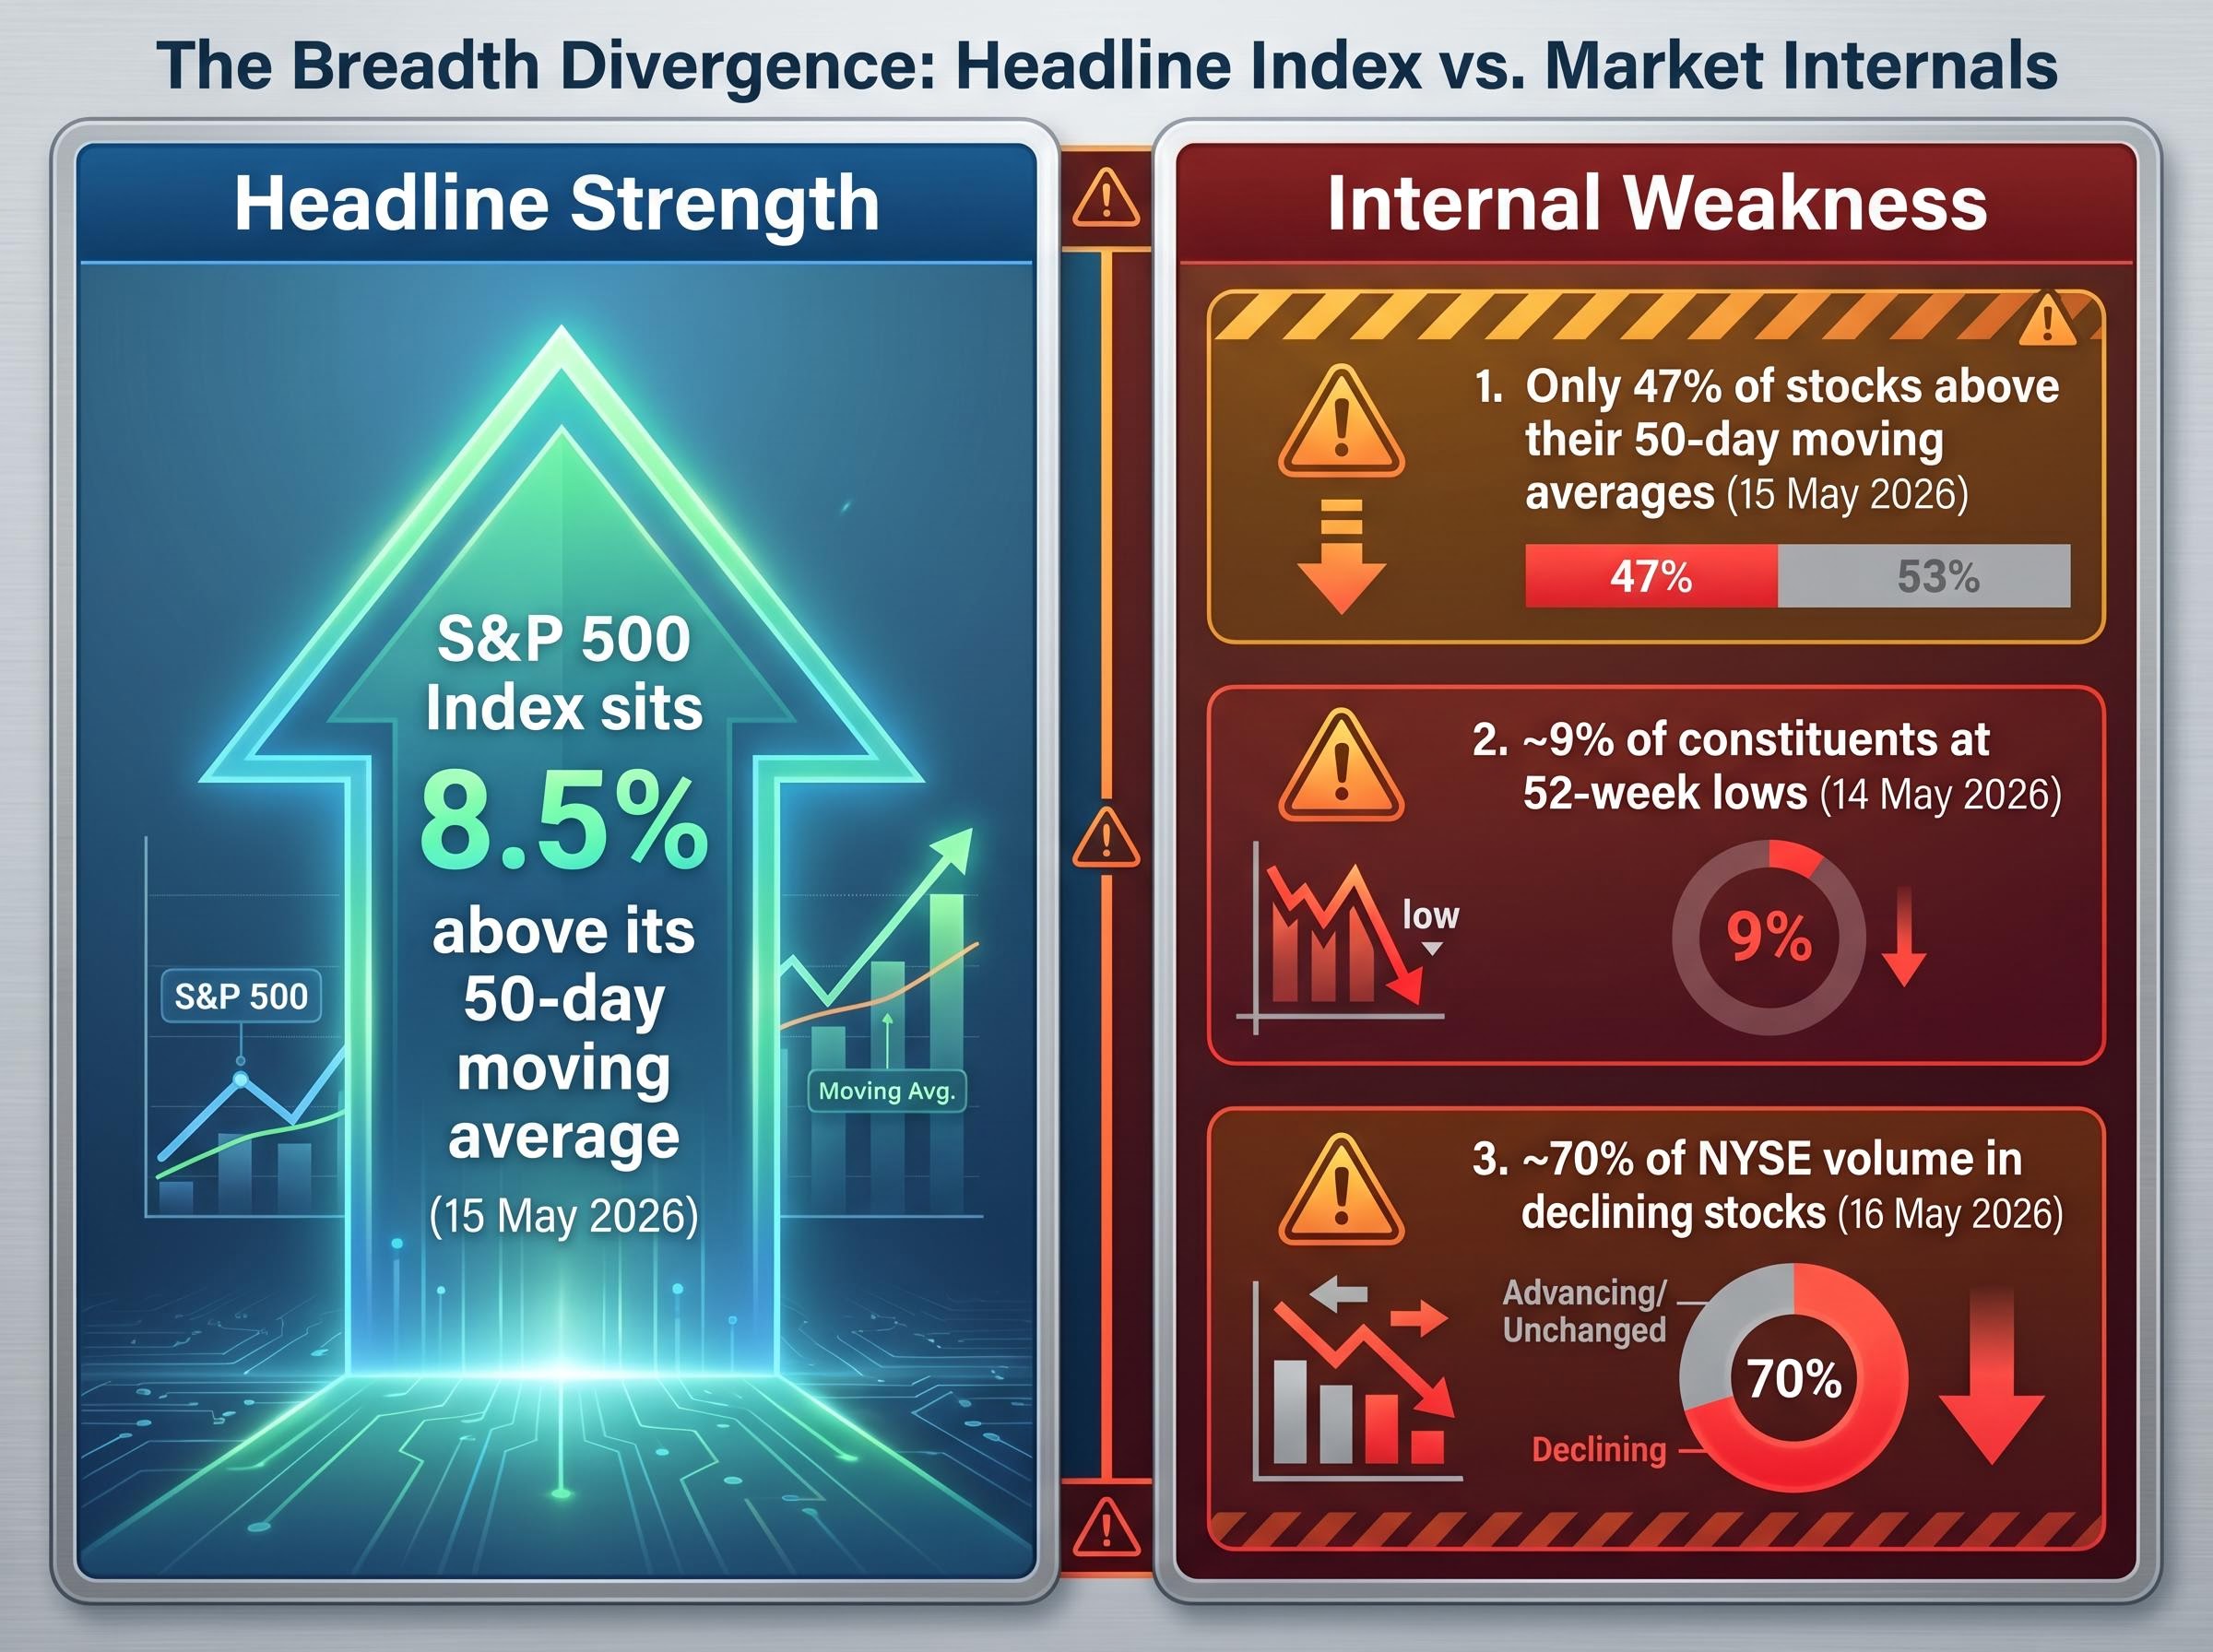
The internal deterioration is already underway, not hypothetical. Approximately 9% of S&P 500 constituents were registering 52-week lows as recently as 14 May 2026, despite the index sitting near recent highs. On 16 May 2026, roughly 70% of NYSE trading volume was concentrated in declining stocks, the highest such reading since March 2026.
Krinsky noted that deterioration in market internals had been accumulating for several weeks before the RSI overbought signal triggered on 15 May 2026. The headline index masked what the components were already signalling.
The 30-year Treasury yield stood at approximately 5.00-5.12% as of mid-May 2026, according to Trading Economics and Federal Reserve data. That places it within a few basis points of the October 2023 cycle high of 5.17%, the highest level since 2007.
This is not a routine data point. Higher long-term yields reduce the present value of future earnings through the discount rate mechanism. The further out those earnings are projected, the larger the mathematical impact. Growth stocks with valuations built on earnings years into the future are the most exposed cohort.
The 30-year yield crossing 5% on 15 May 2026 was not an isolated US event; it occurred simultaneously with UK 30-year gilt yields hitting their highest since 1998 and Japanese 30-year JGB yields reaching an all-time record, a convergence that strategists are treating as a structural repricing of long-duration sovereign debt rather than a transient inflation spike.
Goldman Sachs has noted that yields at or above 5% compress the implied equity risk premium into a historically low range, making equities, especially long-duration growth stocks, vulnerable to de-rating.
The sensitivity is not theoretical. It has manifested in documented episodes across this cycle.
Morgan Stanley has framed the situation directly: partial resilience among profitable mega-caps does not insulate the index given current concentration weights. The pattern is clear. Each time the long bond spikes, the same names sell off, and those names now represent more of the index than ever before.
The danger here is not additive. It is multiplicative. When a single sector dominates the index and that sector is also the most rate-sensitive cohort, any yield-driven de-rating produces an outsized index-level decline relative to what would occur with normal diversification.
Institutional strategists have converged on this assessment from different angles:
Mike Wilson of Morgan Stanley has characterised the S&P 500 as “a call option on a handful of AI and mega-cap tech names.”
Early signals of the compounding effect are already visible. The VanEck Semiconductor ETF (SMH) declined 3.8% on 16 May 2026, its worst single-session performance since March 2026. Semiconductors sit at the intersection of both risks: high index weight and high rate sensitivity. Where SMH goes first, the broader tech complex often follows.
The technical signal is already present. The daily RSI on the SPDR S&P 500 ETF (SPY) reached 78 on 15 May 2026. According to BTIG’s Krinsky, five of six historical instances since 2023 where the RSI exceeded 75 and was followed by a 1%+ down day resulted in at least 7% peak-to-trough drawdowns. Average returns were negative across every measured timeframe from 5 to 40 days following the signal.
BTIG’s analysis found that average returns were negative across every measured timeframe from 5 to 40 days following comparable overbought signals since 2023.
SPY declined 1.2% on 16 May 2026. The RSI trigger condition has been met.
A correction triggered by yield pressure and concentration unwinding would follow a specific sequence:
Morningstar noted in November 2025 that more speculative AI and cloud names had already been underperforming sharply on days when the long bond sold off. The asymmetry is the same one that powered the rally in reverse: the concentration that pulled the index higher would pull it disproportionately lower.
The S&P 500 headline number remains near recent highs. The internal evidence tells a different story. Breadth divergence is at record extremes, 9% of constituents are at 52-week lows, NYSE volume is concentrated in declining stocks, and semiconductors have already registered their worst session in months.
The question is not whether tech concentration and rising yields are risks in theory. They demonstrably are; the February, March, and October 2025 episodes proved that. The question is whether yields sustaining above 5% and moving toward 5.17% will force the index to reconcile its headline level with the underlying breadth reality.
Edward Jones noted in January 2025 that high concentration in tech magnifies the effect of macro shocks such as rate spikes, even when the underlying companies are fundamentally sound. For any investor holding passive S&P 500 exposure, this concentration is a structural tech overweight that no individual may have actively chosen.
For investors weighing how to act on concentration risk beyond simply monitoring the 30-year yield, our dedicated guide to small-cap rotation strategies examines the Russell 2000’s outperformance of the S&P 500 by more than 6 percentage points year to date in 2026, the institutional fund flow data behind the shift, and the valuation discount that major banks are citing as a structural rationale for reducing mega-cap overweights.
Three concrete steps follow from that recognition:
The S&P 500 carries record tech concentration that has historically amplified both gains and corrections, and the 30-year yield is now close enough to its 2023 cycle high to represent a credible near-term catalyst. The Magnificent Seven are genuinely profitable companies with strong balance sheets, a meaningful distinction from 2000-era dot-com names that Goldman Sachs and Morningstar have both emphasised. Any correction may prove shallower or more contained than the dot-com analogy implies.
That distinction does not neutralise the structural risk. Edward Jones has noted that concentration magnifies macro shocks even when underlying companies are fundamentally sound. Understanding this setup is not a call to sell. It is a reason to examine concentration risk honestly and to watch the 30-year yield relative to the 5.17% prior cycle high as a specific near-term signal.
This article is for informational purposes only and should not be considered financial advice. Investors should conduct their own research and consult with financial professionals before making investment decisions.
Past performance does not guarantee future results. Financial projections are subject to market conditions and various risk factors.
Sector concentration risk refers to the danger that arises when a single sector dominates an index by market capitalisation, meaning that a sell-off in that sector produces an outsized decline in the overall index rather than being cushioned by diversification across other sectors.
A 30-year Treasury yield at or above 5% raises the discount rate used to calculate the present value of future earnings, which disproportionately reduces the valuations of growth and tech stocks because their earnings are projected further into the future.
According to BTIG data from mid-May 2026, the S&P 500 information technology sector represents 37.5% of the index by market capitalisation, exceeding Goldman Sachs Global Investment Research's estimate of approximately 34% at the dot-com peak in early 2000.
Market breadth measures how many individual stocks are participating in an index move; as of 15 May 2026, BTIG's Jonathan Krinsky documented that the S&P 500 sat 8.5% above its 50-day moving average while only 47% of constituent stocks were above their own, which he described as the widest such divergence ever recorded.
Investors can check the actual sector weights in any index fund they hold, assess whether their portfolio already carries elevated duration risk through tech exposure, and monitor the 30-year Treasury yield relative to the 5.17% prior cycle high as a specific signal for further pressure on high-multiple names.