In the week of 18 May 2026, global bond yields surged to levels not seen in nearly two decades. Gold retreated from multi-month highs. Base metals across the London Metal Exchange sold off in unison. ASX resources stocks followed. The connection between rising bond yields and falling commodity prices is not immediately obvious to most retail investors, but it is mechanical, repeatable, and worth understanding. This article explains the two distinct channels through which higher yields pressure commodities and commodity-linked equities, uses the mid-May 2026 selloff as a live case study, and provides a framework for evaluating resources exposure when the interest rate environment shifts.
What just happened to commodity prices in mid-May 2026
The bond market backdrop
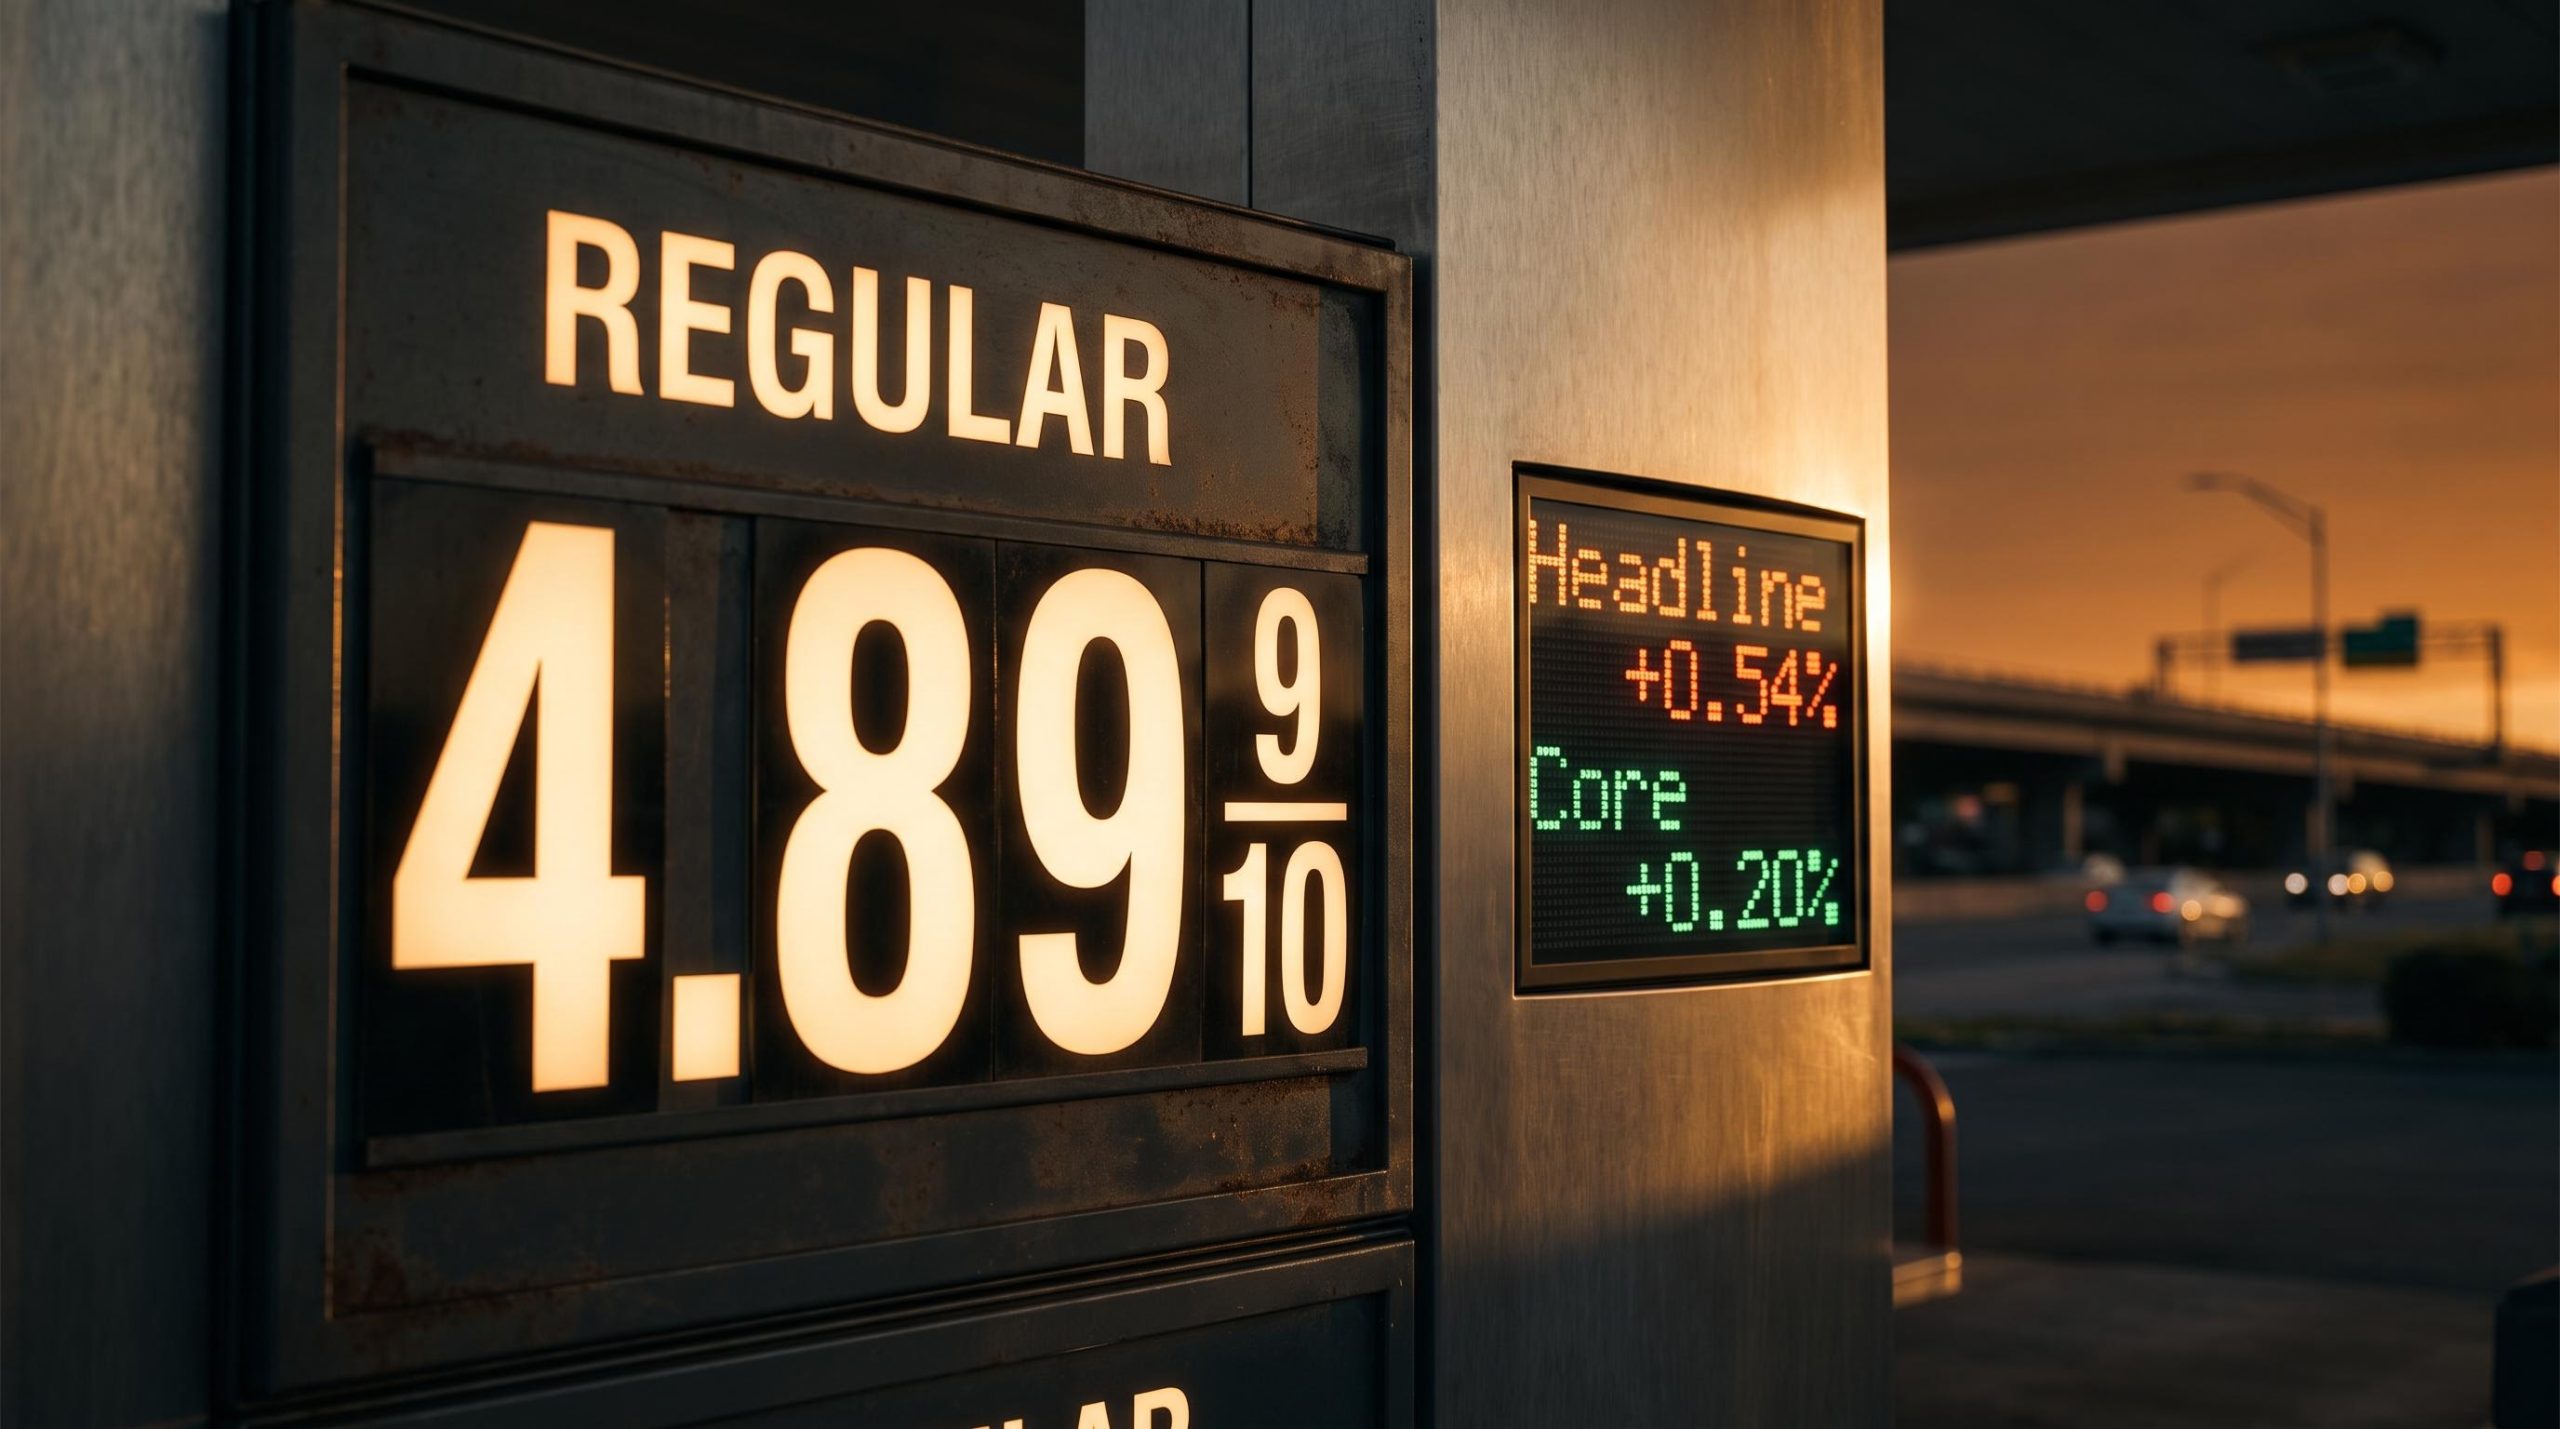
The week began with a jolt. Hotter-than-expected US inflation data for April, with the Consumer Price Index (CPI) running at 3.8% annually and the Producer Price Index (PPI) at 6.0% annually, forced a rapid repricing across global sovereign debt markets. Sustained energy price pressure from the ongoing Middle East conflict had fed directly into those inflation readings, and bond markets responded by demanding higher yields to compensate for the risk that central banks would need to keep rates elevated for longer.
The 3.8% CPI and 6.0% PPI readings that triggered the yield repricing were themselves the product of an oil-to-inflation transmission chain stretching back to the February 2026 US-Israeli strikes on Iran, with Brent crude surging above $111 per barrel and energy costs rising 3.8% in a single month, feeding directly into the headline inflation figures that bond markets then repriced.
The scale of the move was global and synchronised:
The RBA Financial Stability Review on global macro conditions documented how geopolitical pressures feeding into energy prices had contributed to elevated sovereign bond yields and tighter financial conditions across commodity markets, providing the Australian regulatory context for the yield dynamics playing out in mid-May 2026.
- US 30-year Treasury yield broke above 5.1%, the highest since 2007
- UK 10-year gilt reached 5.17%, the highest since 2008
- Japan 30-year government bond yield hit 4%, a level not seen since those securities were first issued in 1999
- AUD/USD traded in a range of approximately 0.715-0.726 during the period
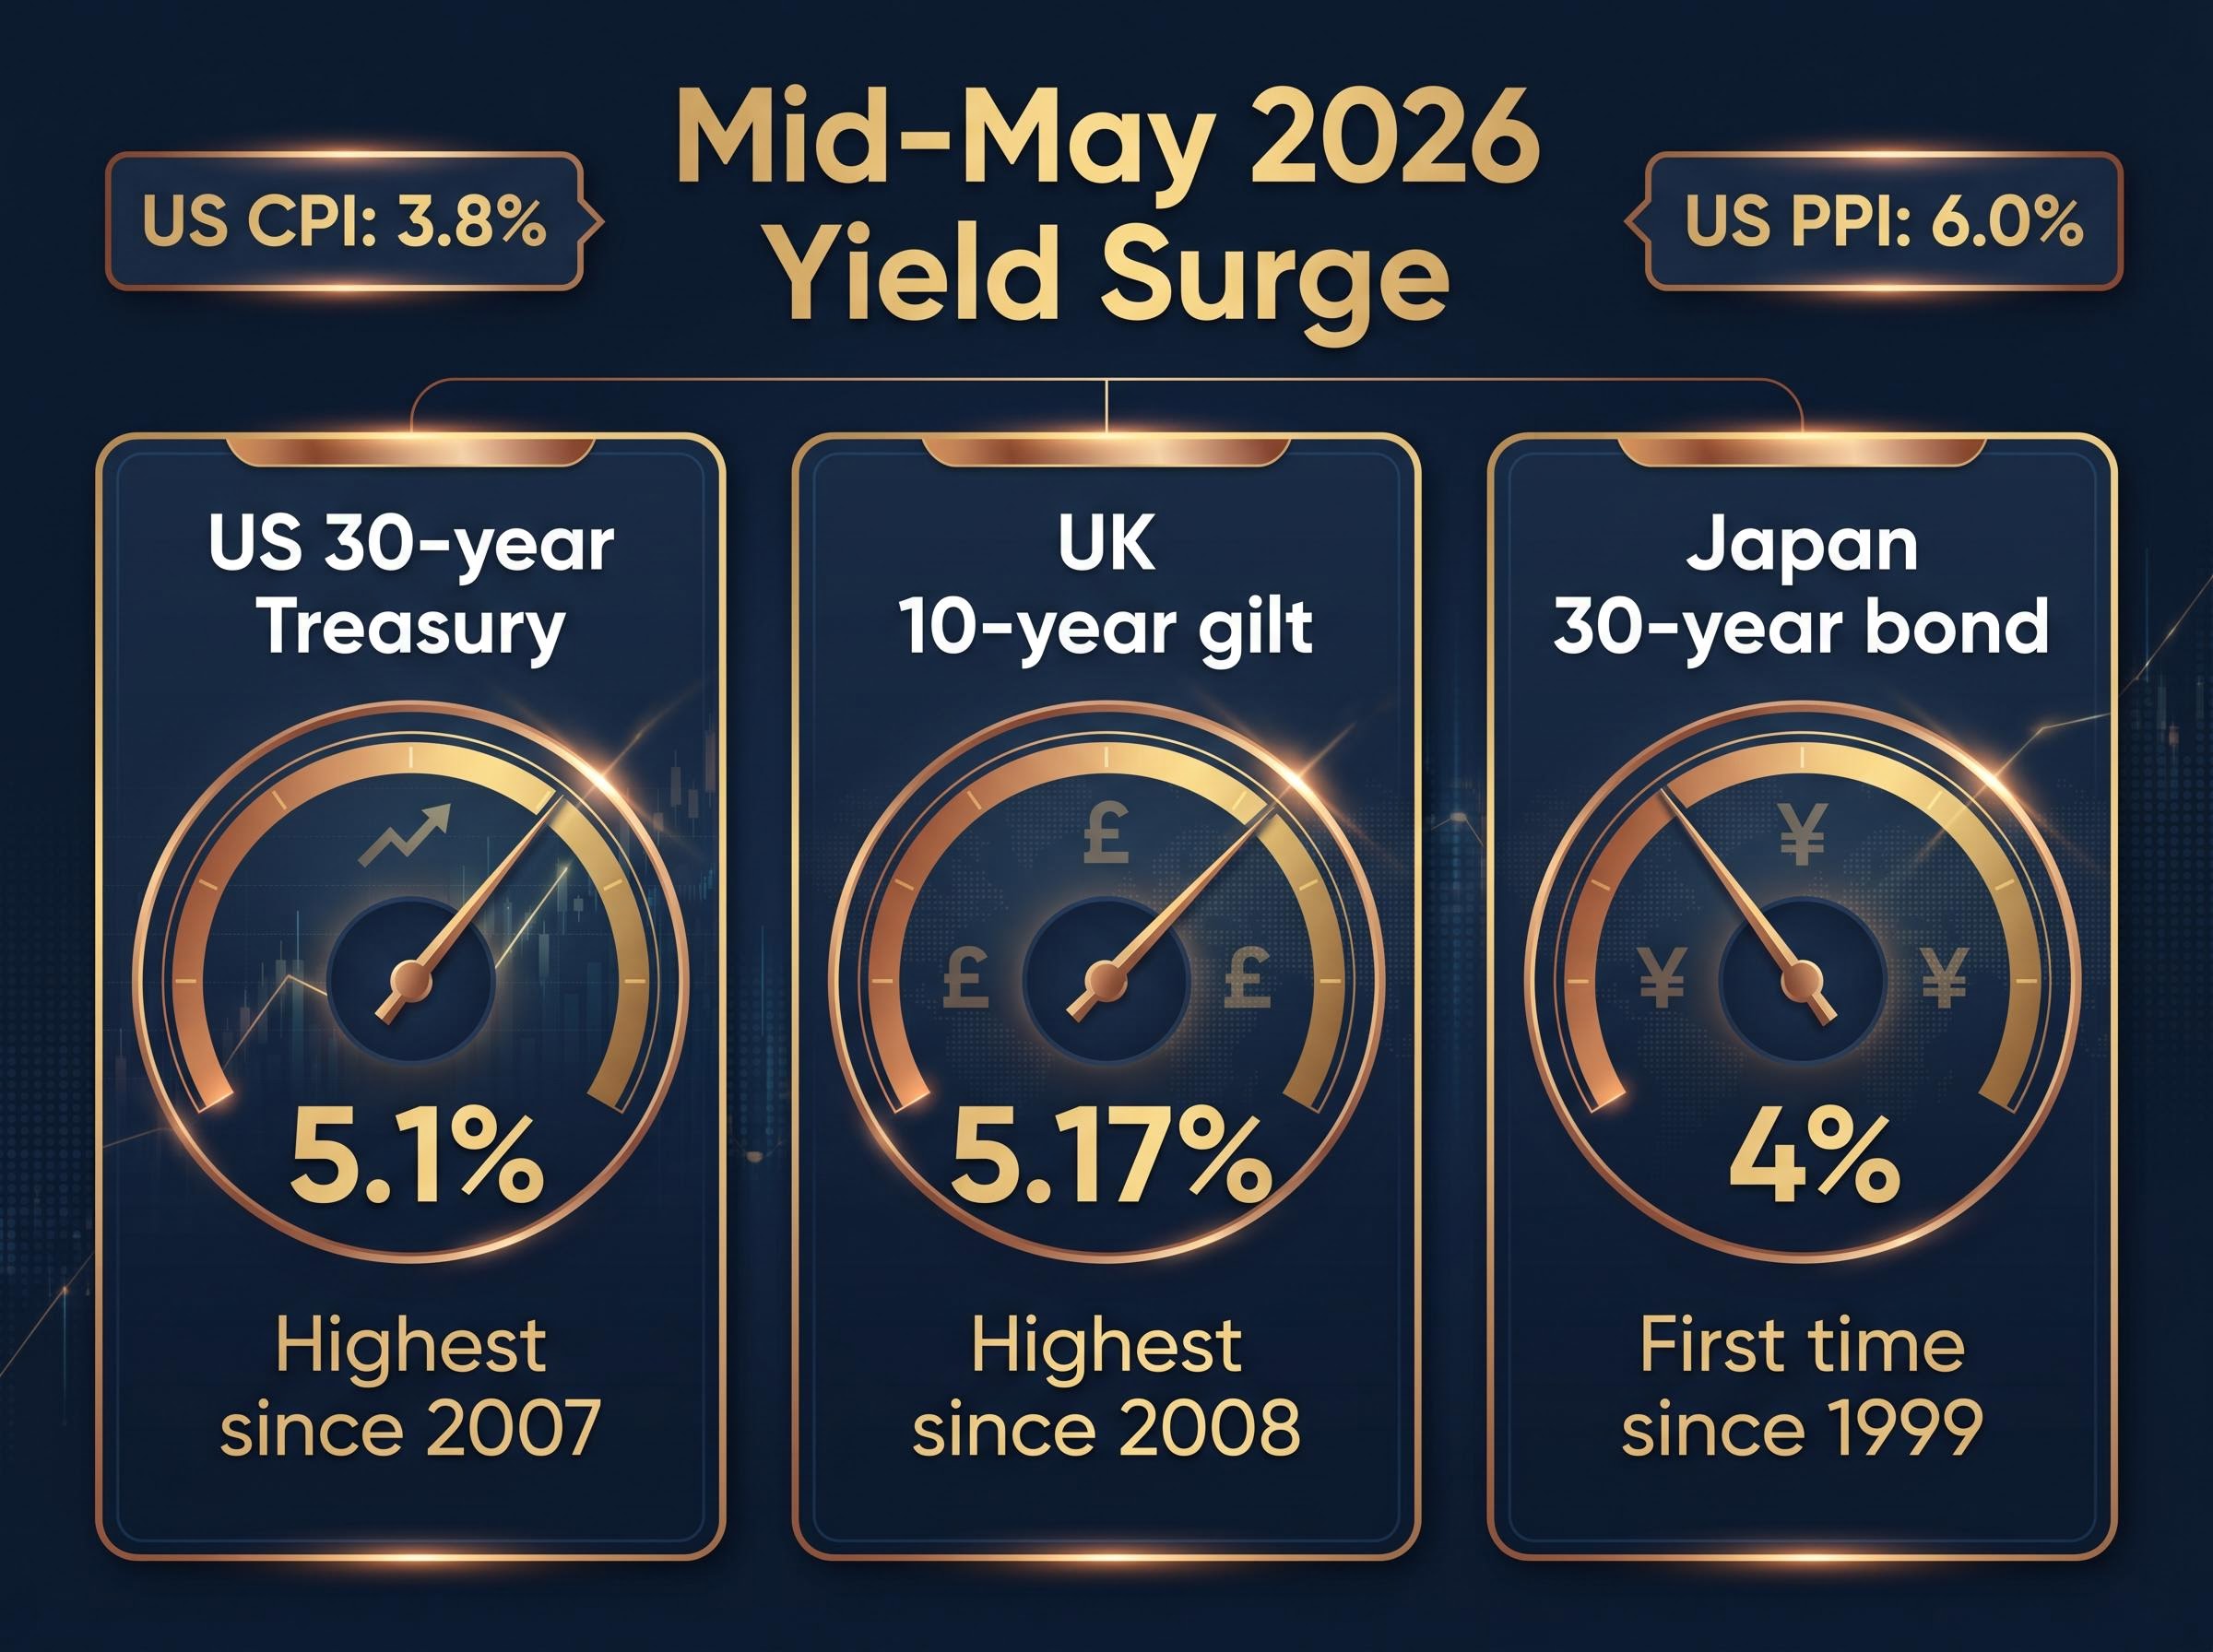
The US 30-year Treasury yield above 5.1% marked its highest level since 2007, a threshold that repriced the cost of capital across every asset class globally.
How commodity prices moved
Within the same week, commodity markets moved sharply lower, and not because of any change in physical supply or demand for the metals themselves. Gold spot prices pulled back to an approximate range of US$4,500-4,704/oz, down from prior highs. LME copper traded in the range of approximately US$13,500-14,000/t, with COMEX copper futures extending their decline by approximately 0.9% in subsequent Asian trading sessions. Aluminium and nickel also declined across the complex, though verified figures for those metals remain subject to confirmation.
The pattern was the telling detail. Copper, gold, aluminium, and nickel are commodities with very different end-use profiles and supply dynamics, yet they all sold off in the same week. That simultaneity pointed to a shared macro driver rather than anything specific to individual metals markets.
When big ASX news breaks, our subscribers know first
Why rising yields specifically punish gold
Gold is structurally different from every other commodity in a rising-yield environment. Copper has industrial demand. Aluminium has construction and packaging end-markets. Gold produces no income: no dividends, no interest payments, no earnings yield. Its entire investment case rests on capital appreciation and its function as a hedge against inflation, currency debasement, or geopolitical risk.
That distinction becomes financially concrete when risk-free bond yields cross certain thresholds. When US 30-year Treasuries yielded near zero (as they did in parts of 2020-2021), the income sacrifice of holding gold instead of bonds was negligible. At 5.1%, that sacrifice amounts to a measurable annual cost.
- Gold produces zero income; its return depends entirely on price appreciation
- A US 30-year Treasury at 5.1% offers guaranteed annual income for holding a risk-free asset
- The gap between zero and 5.1% is the opportunity cost of choosing gold over bonds
- That cost compounds annually, raising the hurdle gold must clear to justify its place in a portfolio
When the US 30-year Treasury yields above 5%, holders of non-yielding assets face a measurable annual cost for the privilege of earning no income, a cost that did not exist when bonds yielded near zero.
Gold spot prices in mid-May 2026 traded in the approximate range of US$4,500-4,704/oz, reflecting this pressure alongside the broader selloff.
Silver futures dropped more than 4% and platinum also declined in the same period, underscoring that the yield-and-dollar pressure extended across the entire precious metals complex, with silver’s additional industrial demand exposure amplifying losses beyond what the opportunity-cost channel alone would predict.
The extra layer for gold mining stocks
Gold miners carry the same opportunity-cost headwind as physical gold, plus an additional valuation mechanism. Mining companies generate cash flows projected years and sometimes decades into the future. Those cash flows are valued using discounted cash flow (DCF) models, a standard method that calculates what future earnings are worth in today’s money by applying a discount rate.
When risk-free yields rise, that discount rate rises with them. A simple illustration from financial analysis: a $1 perpetuity (an annual payment that continues indefinitely) is worth approximately $50 when discounted at 2%, but only approximately $20 when discounted at 5%. The cash flow is identical; the rate at which it is discounted determines its present value.
For ASX-listed gold miners such as Newmont and Northern Star, this creates a compounded effect. The gold price itself faces headwinds from opportunity cost, and the miners’ equity valuations face an additional compression from higher discount rates applied to their long-duration cash flows. Investors holding gold ETFs such as GOLD (ETF Securities) or shares in gold producers face both layers simultaneously.
How a stronger US dollar squeezes commodity buyers
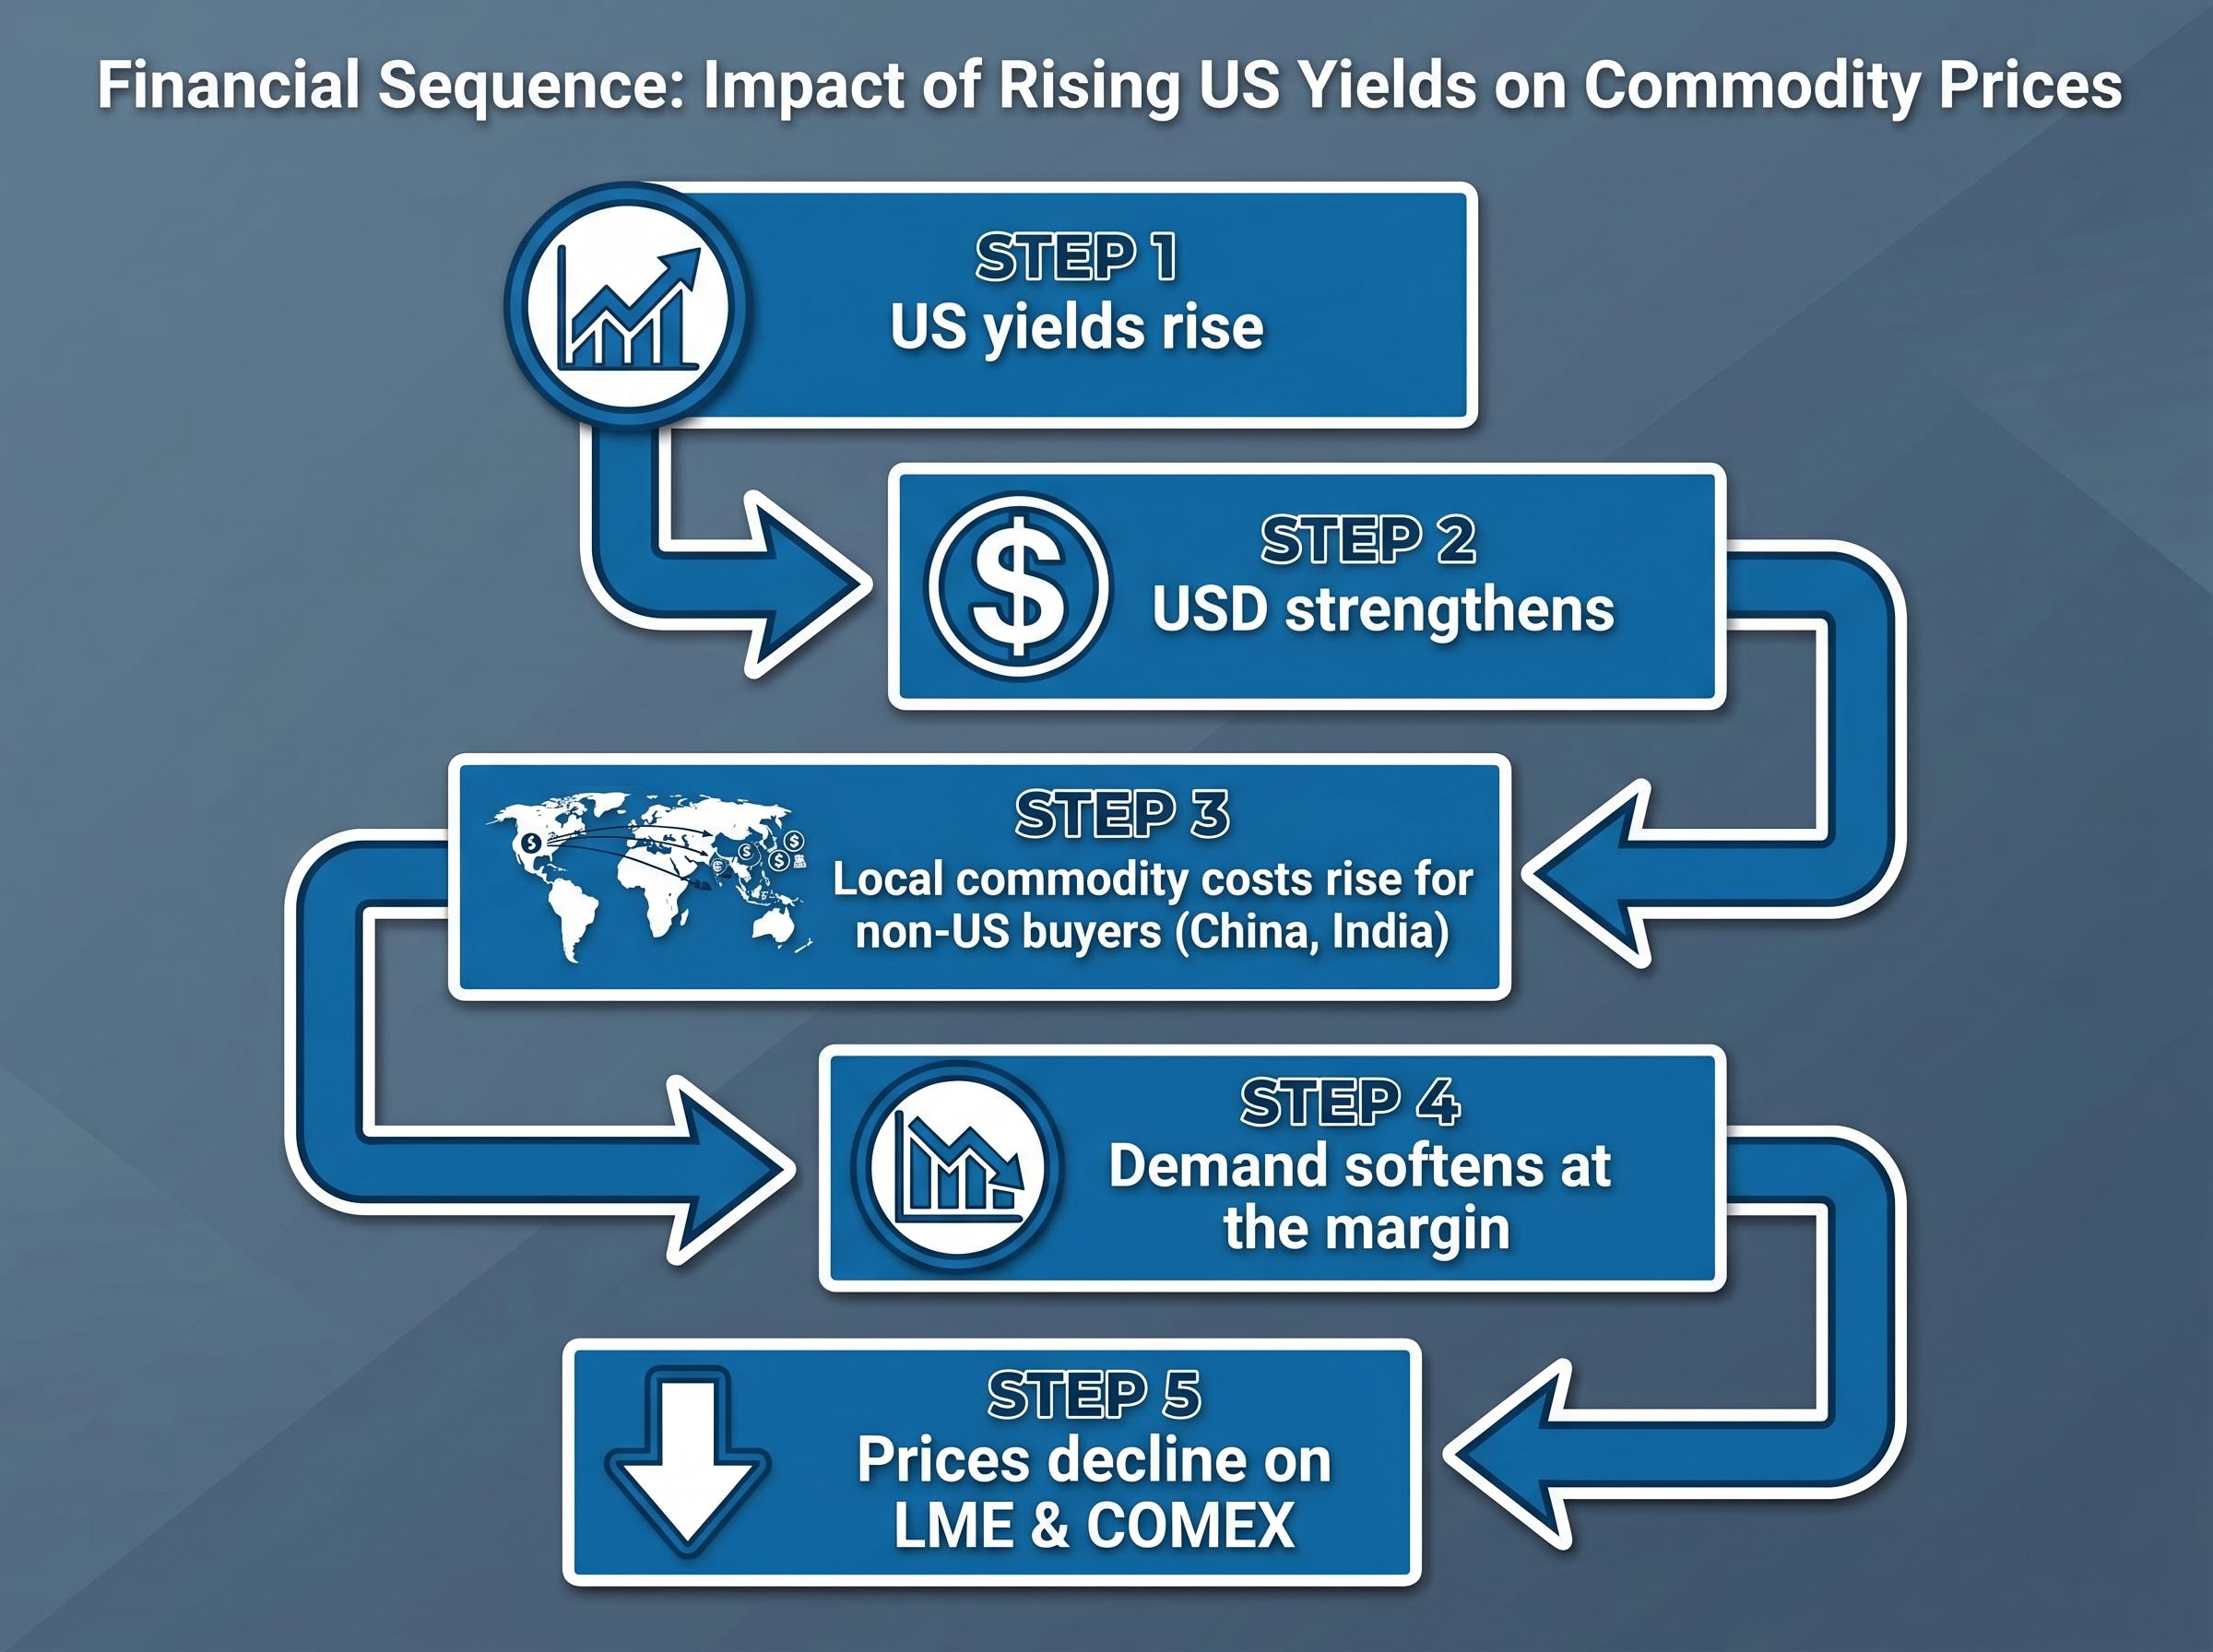
The transmission chain from bond yields to commodity prices runs through the currency market, and it works in a specific sequence.
- US bond yields rise, making dollar-denominated assets more attractive to global capital
- Money flows into those assets, increasing demand for US dollars
- The US dollar strengthens against other currencies
- Non-US commodity buyers face a higher local-currency cost for commodities priced in USD
- Demand softens at the margin as buyers defer or reduce purchases
- Commodity prices adjust lower to reflect the reduced buying interest
The mechanism is a currency translation effect. Physical demand for copper or aluminium does not necessarily fall because a bond auction in Washington attracted more bids. But the effective cost to a copper buyer in Shanghai or a nickel importer in Mumbai rises when the dollar strengthens, and that introduces price resistance across USD-denominated commodity markets.
ANZ and Westpac analytical commentary has noted that a stronger US dollar “tightens financial conditions for non-US commodity buyers” and raises landed commodity costs for emerging-market importers. The mechanism applies most acutely to large commodity-importing economies such as China, whose purchase volumes are large enough to move global price benchmarks.
| Stage | What happens | Who is affected |
|---|---|---|
| US yields rise | Dollar-denominated assets attract global capital | Global fixed-income investors |
| USD strengthens | Exchange rates shift against non-US currencies | All non-US currency holders |
| Commodity costs rise in local currency | Import bills increase for the same volume of metals | Emerging-market commodity buyers (China, India) |
| Demand softens at the margin | Buyers defer or reduce purchases | LME and COMEX price benchmarks |
| Commodity prices decline | Global benchmarks adjust to reflect reduced buying | Producers, miners, commodity-linked equities |
For Australian investors, this mechanism carries a specific wrinkle. The majority of ASX-listed miners sell commodities priced in US dollars but report earnings in Australian dollars. When the USD strengthens sharply, the relationship between the headline commodity price and the miner’s AUD revenue becomes more complex, and analyst earnings models often require revision.
How these same forces flow through to base-metal miners and ASX resources stocks
For base metals such as copper, aluminium, and nickel, the yield-related pressure operates through a different mix. These are industrial inputs with genuine physical demand from construction, manufacturing, and infrastructure spending. Their investment case does not rest on opportunity cost in the same way gold’s does. The primary pressure channel is the USD strengthening effect described earlier: a stronger dollar raises effective costs for the world’s largest commodity importers, softening demand at the margin and weighing on global benchmarks.
LME copper traded in the approximate range of US$13,500-14,000/t during mid-May 2026. Aluminium and nickel declined directionally across the week, though verified price levels for those metals remain subject to independent confirmation.
| Asset type | Primary yield pressure channel | Secondary pressure channel | ASX examples |
|---|---|---|---|
| Physical gold | Opportunity cost (zero income vs rising risk-free yields) | USD strength raising cost for non-US buyers | GOLD ETF (ETF Securities) |
| Gold miners | Opportunity cost + DCF discount rate compression | Gold price decline feeding through to revenue | Newmont, Northern Star |
| Base metals | USD strength softening demand from non-US buyers | Broader risk-off sentiment during bond volatility | LME copper, aluminium, nickel |
| Diversified miners | Commodity price softening from USD channel | DCF discount rate compression on equity valuations | BHP, Rio Tinto |
Why the equity effect compounds the commodity price effect
For ASX-listed diversified miners such as BHP and Rio Tinto, higher bond yields create pressure from two directions simultaneously. Softer commodity prices reduce the revenue line in analyst models. At the same time, the higher risk-free rate raises the discount rate applied in DCF valuations, compressing the present value of cash flows expected from long-life mining projects.
CommSec commentary has noted that the lift in risk-free rates lowers the present value of long-life mining projects, contributing to weakness in the S&P/ASX 200 Materials index. For diversified miners, the balance between the two pressures depends on where the actual commodity price sits; at verified copper levels of approximately US$13,500-14,000/t, the price-softening component may be less acute than the valuation compression component. Both, however, work in the same direction when yields are rising.
What Australian retail investors with resources exposure should actually consider
The question is not “sell commodities” or “hold.” It is a structured re-evaluation of why each commodity holding exists in a portfolio and whether that rationale remains intact when the yield environment shifts materially.
The evaluative framework starts with three questions for each holding:
The yield environment shift was not confined to US Treasuries; RBA rate repricing following Australia’s own 4.6% CPI reading had pushed the cash rate to 4.1% by April 2026, meaning Australian investors faced a double compression: rising global risk-free rates applying downward pressure on commodity valuations, and rising domestic rates making income-producing alternatives materially more competitive within their own portfolios.
- What role does this position play: income generation, inflation hedge, growth leverage, or portfolio diversification?
- Does that role change when risk-free yields rise above 4-5% and income-producing alternatives such as term deposits, bond ETFs, and hybrids compete more credibly?
- What is the specific opportunity cost of holding this non-yielding or commodity-linked asset versus an income-producing alternative at current rates?
According to the Australian Financial Review (March 2025), advisers reported clients “shifted from gold ETFs back into income-producing hybrids and bond funds” once yields on cash and short-duration fixed income exceeded 4-5%.
The 2024-2025 period offers direct precedent. BetaShares published model portfolio data showing gold exposure cut from approximately 10% to approximately 5% of total assets in response to higher yields, explicitly framing the decision around opportunity cost. Vanguard Australia noted in November 2024 that with bond yields “back near or above long-run averages,” the case for large tactical gold allocations as a diversifier had lessened in some cases.
These are 2024-2025 precedents, not May 2026-specific observations. But they demonstrate that Australian retail investors and advisers have already worked through this exact trade-off in recent years, and the framework they used remains directly applicable.
The bond market as foundation: why every asset reprices when yields shift
Government bond yields set the risk-free rate that underpins every other asset valuation. When that foundation shifts, all assets built on top of it must reprice, not because anything about those assets has changed but because the standard against which they are measured has moved.
The mid-May 2026 episode was notable for its speed and synchronicity. US CPI at 3.8% annually and PPI at 6.0% annually arrived hotter than expected, the US 30-year yield broke above 5.1% for the first time since 2007, the UK 10-year gilt reached its highest since 2008, and Japan’s 30-year bond hit 4% for the first time since those securities were first issued in 1999. Gold, copper, aluminium, and mining equities all moved lower in the same week.
The mechanism this episode illustrates is permanent. It will recur whenever bond markets reassess inflation expectations or monetary policy trajectories.
For investors wanting to place the May 2026 gold pullback within a longer historical valuation context, our dedicated guide to the Dow-to-gold ratio examines how the ratio’s current reading of approximately 10.5, roughly 30% below its 50-year average, compares with the extreme readings at the 1980 and 1999 secular turning points and how analysts use it alongside metrics such as the Buffett Indicator to assess whether equity or gold cycles are stretched.
Three durable principles worth retaining:
- The risk-free rate is the baseline against which all asset valuations are measured; when it moves, everything reprices
- Non-yielding assets face specific opportunity-cost pressure when yields rise, because the income sacrifice of holding them becomes measurable
- USD-denominated commodities face demand-softening pressure through the currency channel whenever higher US yields strengthen the dollar
Bond yield moves are not a one-off: how to hold resources exposure more deliberately
The two mechanisms, the USD-demand channel and the opportunity-cost channel, are not unique to May 2026. They operate every time the yield environment shifts materially. A portable framework for evaluating resources exposure at those moments involves four steps:
- Identify the role each holding plays. Is the gold ETF an inflation hedge, a diversifier, or a speculative position? Is the BHP holding a dividend play, a commodity-price bet, or an index-weight decision?
- Assess whether the opportunity cost has changed meaningfully. When risk-free yields cross thresholds that make income-producing alternatives genuinely competitive, non-yielding holdings need a stronger justification to retain.
- Check whether USD strength is affecting the specific demand channels relevant to that commodity. Not all commodities are equally exposed to the currency channel; base metals with large emerging-market buyer bases are typically more sensitive than domestically consumed agricultural commodities.
- Verify whether the equity valuation thesis for any miner depends heavily on long-duration cash flows. Projects with cash flows projected decades out are more sensitive to discount-rate changes than businesses delivering strong near-term earnings.
Resources exposure can still make sense in a higher-yield environment. But it requires a more active rationale than it did when bonds yielded near zero. The 2024-2025 precedent showed that investors who reviewed and adjusted positions deliberately, rather than reactively, were better positioned to articulate exactly why they owned what they owned. That deliberateness is the lasting lesson.
This article is for informational purposes only and should not be considered financial advice. Investors should conduct their own research and consult with financial professionals before making investment decisions. Past performance does not guarantee future results. Financial projections are subject to market conditions and various risk factors.
—
—