The S&P/ASX 200’s dividend yield currently sits at roughly 3.1 to 3.3 per cent, approximately 100 basis points below its 10-year average of 4.3 per cent. For investors trying to determine whether the market is cheap or expensive, that single number contains a signal worth understanding, one that becomes sharper when applied to individual stocks rather than the index as a whole.
With the RBA cash rate at 4.35 per cent as of May 2026, income investors face a straightforward competitive question: can dividend shares deliver an after-tax return that justifies the risk premium over a term deposit? How a stock’s yield compares to its own history offers a fast, practical way to start answering that question. Coles Group (ASX: COL) and Brambles (ASX: BXB) illustrate two contrasting situations playing out on the ASX right now, one where the yield signal suggests the market has priced in confidence, and another where it raises more questions than it answers.
What follows explains exactly how dividend yield comparison works as a valuation shortcut, walks through the mechanics behind yield movements, and uses COL and BXB as live examples so readers can apply the same logic to any ASX stock they are assessing.
Why investors use dividend yield as a quick valuation signal
Dividend yield is not just an income measure. It is a ratio that encodes information about price relative to the cash returns paid to shareholders, which makes it a valuation signal in disguise.
The mechanics are straightforward. Three things can move a stock’s yield:
- The share price rises while the dividend stays flat, compressing the yield downward.
- The share price falls while the dividend stays flat, pushing the yield upward.
- The dividend itself changes, moving the yield independently of price.
A single yield reading tells an investor what they would earn in income at today’s price. But comparing that yield to the stock’s own historical average tells them something different: whether today’s price and dividend combination looks unusual relative to the long-run norm. That comparison is where the valuation signal lives.
The valuation signal embedded in yield only makes sense once the underlying dividend mechanics are clear: when a company pays a dividend, its share price falls by approximately the same amount on the ex-dividend date, meaning the yield ratio is always measuring a moving numerator against a moving denominator.
The long-run average yield for the S&P/ASX 200 has historically sat at approximately 4.0 to 4.5 per cent. The index currently yields roughly 3.1 to 3.3 per cent, well below that benchmark.
This gap does not automatically mean the market is overvalued. It does mean the market is pricing stocks more generously relative to the dividends they pay than it has on average. In a rate environment where the RBA cash rate stands at 4.35 per cent, that context matters: the bar for dividend shares to compete with risk-free alternatives is higher than it has been in years, making yield-based valuation checks more useful, not less.
When big ASX news breaks, our subscribers know first
How the maths actually works: price, dividends, and the yield formula
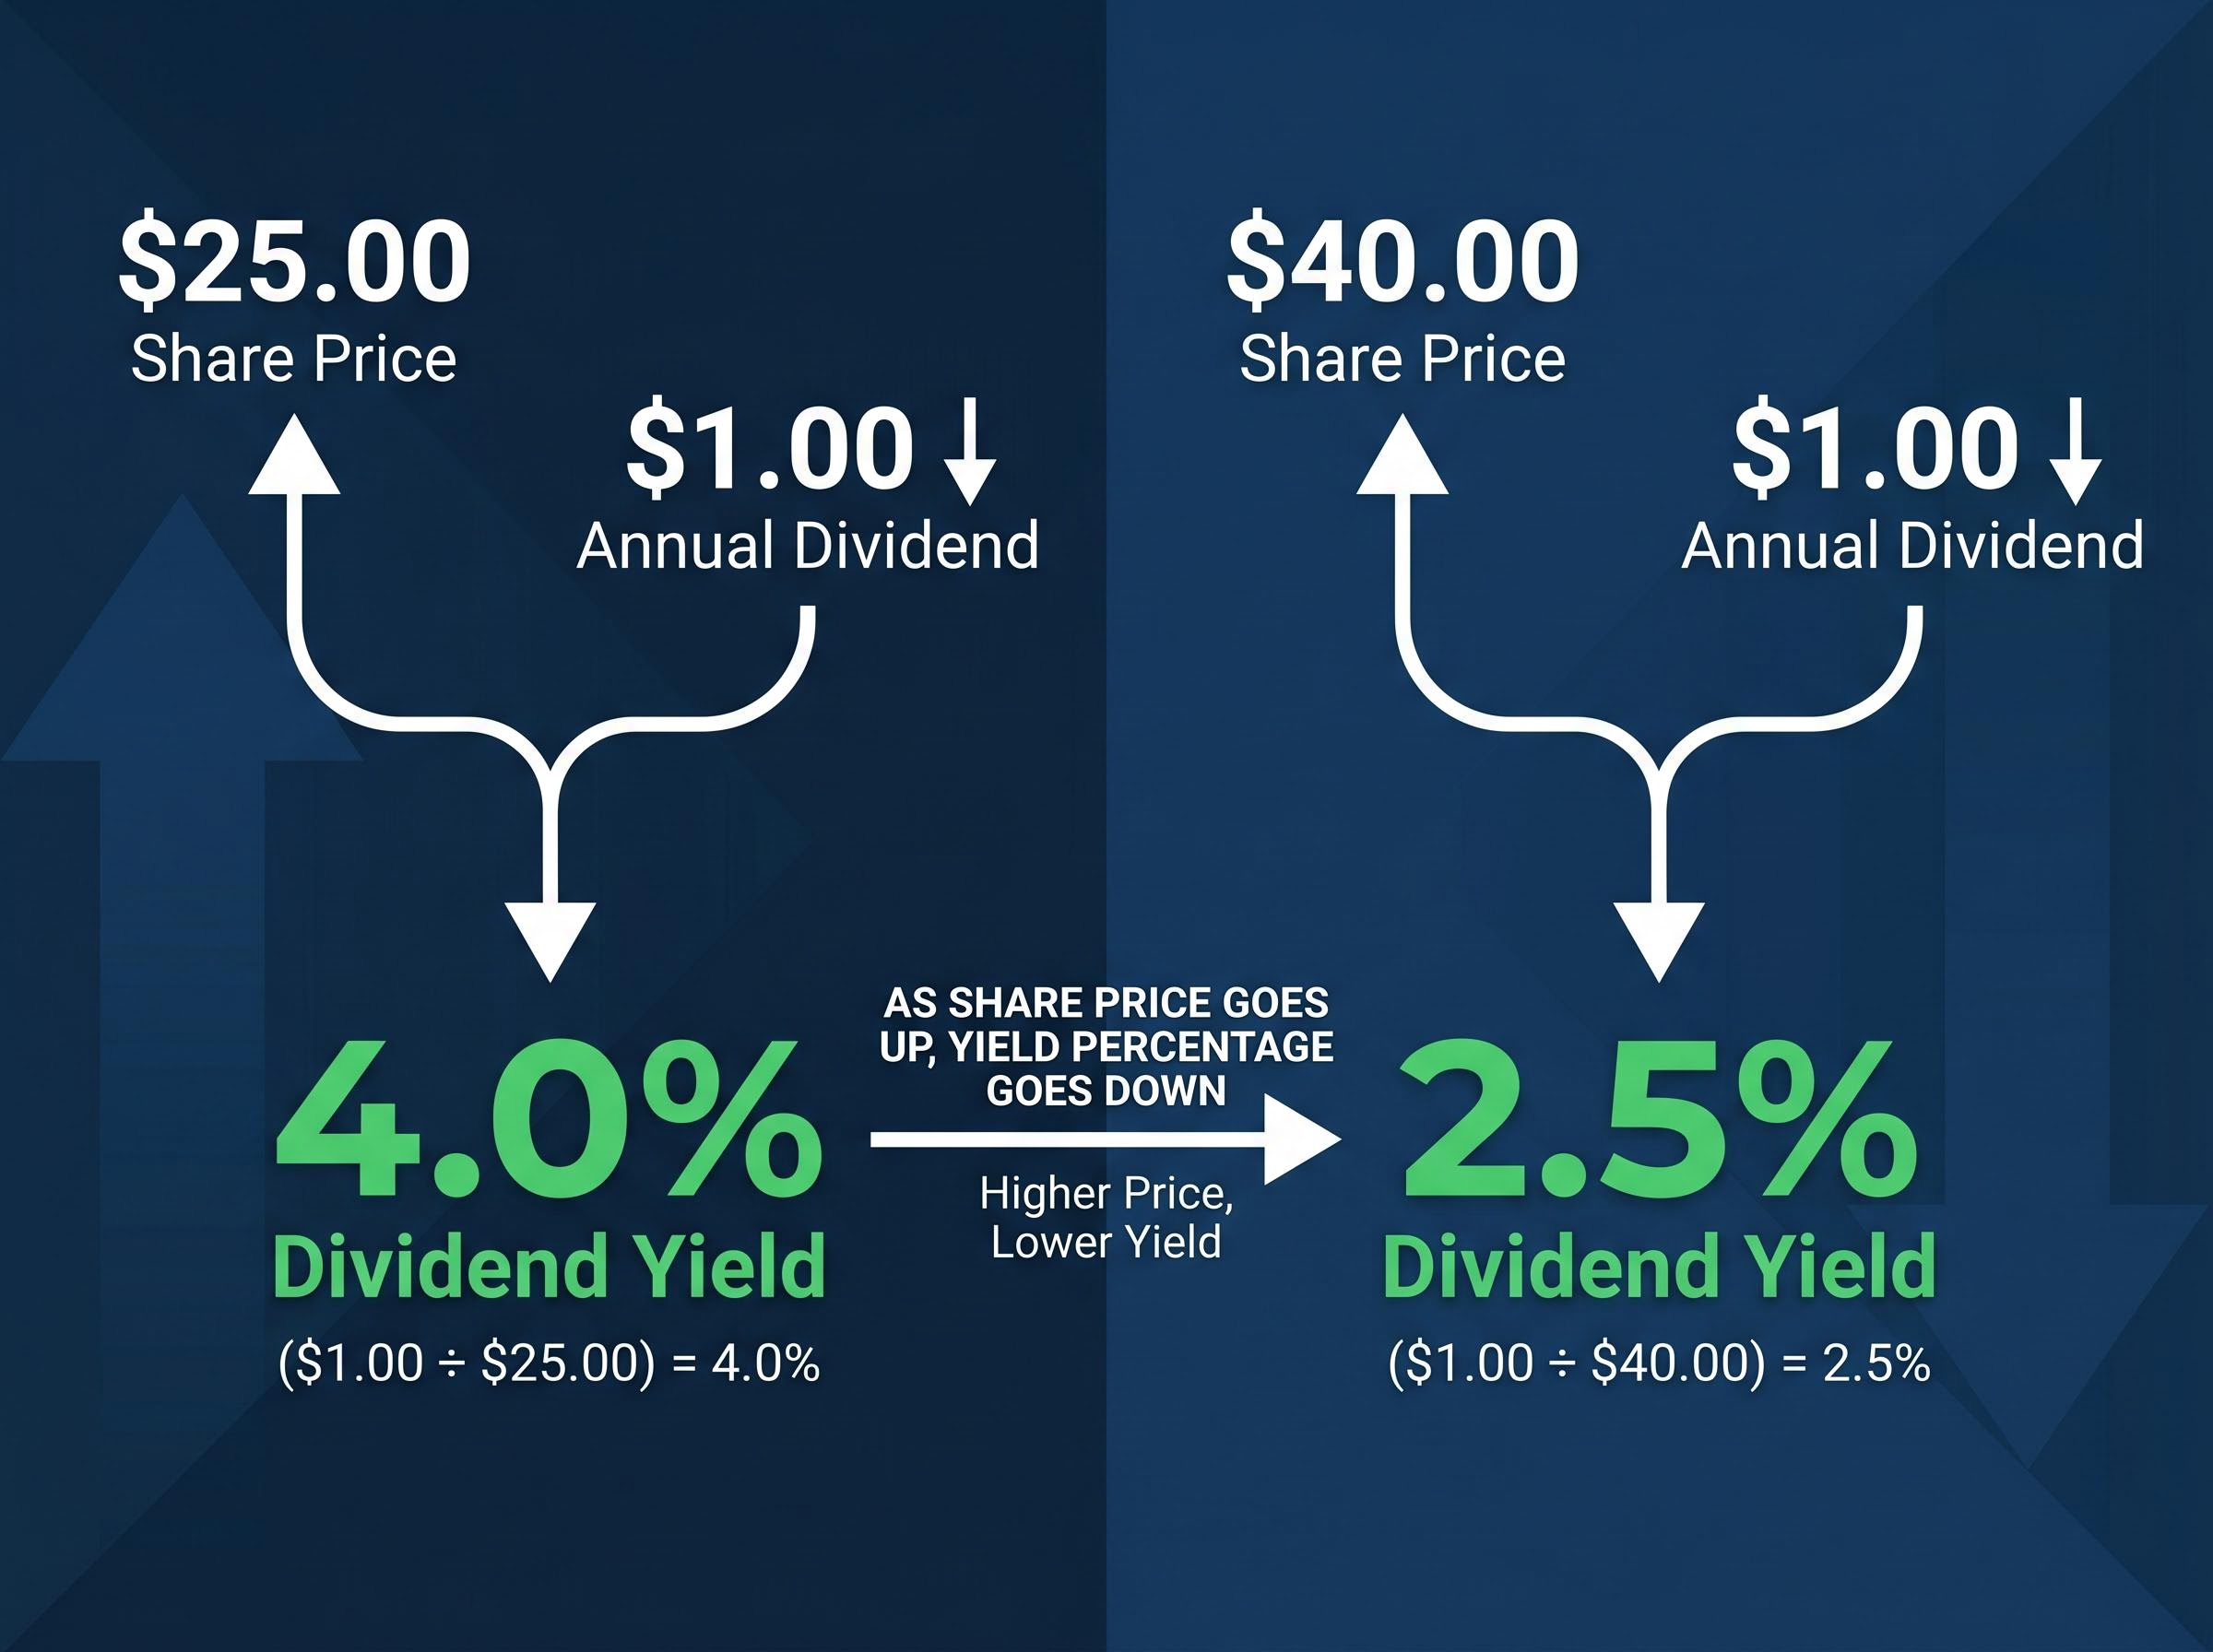
The formula is simple: annual dividend per share divided by the current share price, expressed as a percentage.
What makes the formula useful is how sensitive it is to price. A $1.00 annual dividend produces very different yields depending on where the stock is trading. The table below illustrates this directly.
| Share Price | Annual Dividend | Dividend Yield |
|---|---|---|
| $25.00 | $1.00 | 4.0% |
| $40.00 | $1.00 | 2.5% |
The dividend did not change. The price did all the work. This is why comparing a stock’s current yield to its historical average is implicitly a question about whether today’s price and dividend combination looks different from the long-run norm, and what that difference might mean.
The franking credit layer for Australian investors
For Australian resident investors, the headline yield is often not the full picture. Australia’s dividend imputation system means that when a company pays a fully franked dividend, it attaches a tax credit representing the corporate tax already paid on those profits. The investor effectively receives the cash dividend plus a credit that reduces their personal tax liability.
The ATO’s dividend imputation guidance sets out exactly how franking credits are attached to distributions and applied by shareholders as tax offsets, confirming that the corporate tax already paid on profits flows through to resident investors as a reduction in their personal tax liability.
This produces a grossed-up yield that is materially higher than the headline cash figure. The distinction matters when comparing stocks with different franking levels, a point that becomes directly relevant when examining COL and BXB.
What Coles’ yield is telling investors right now
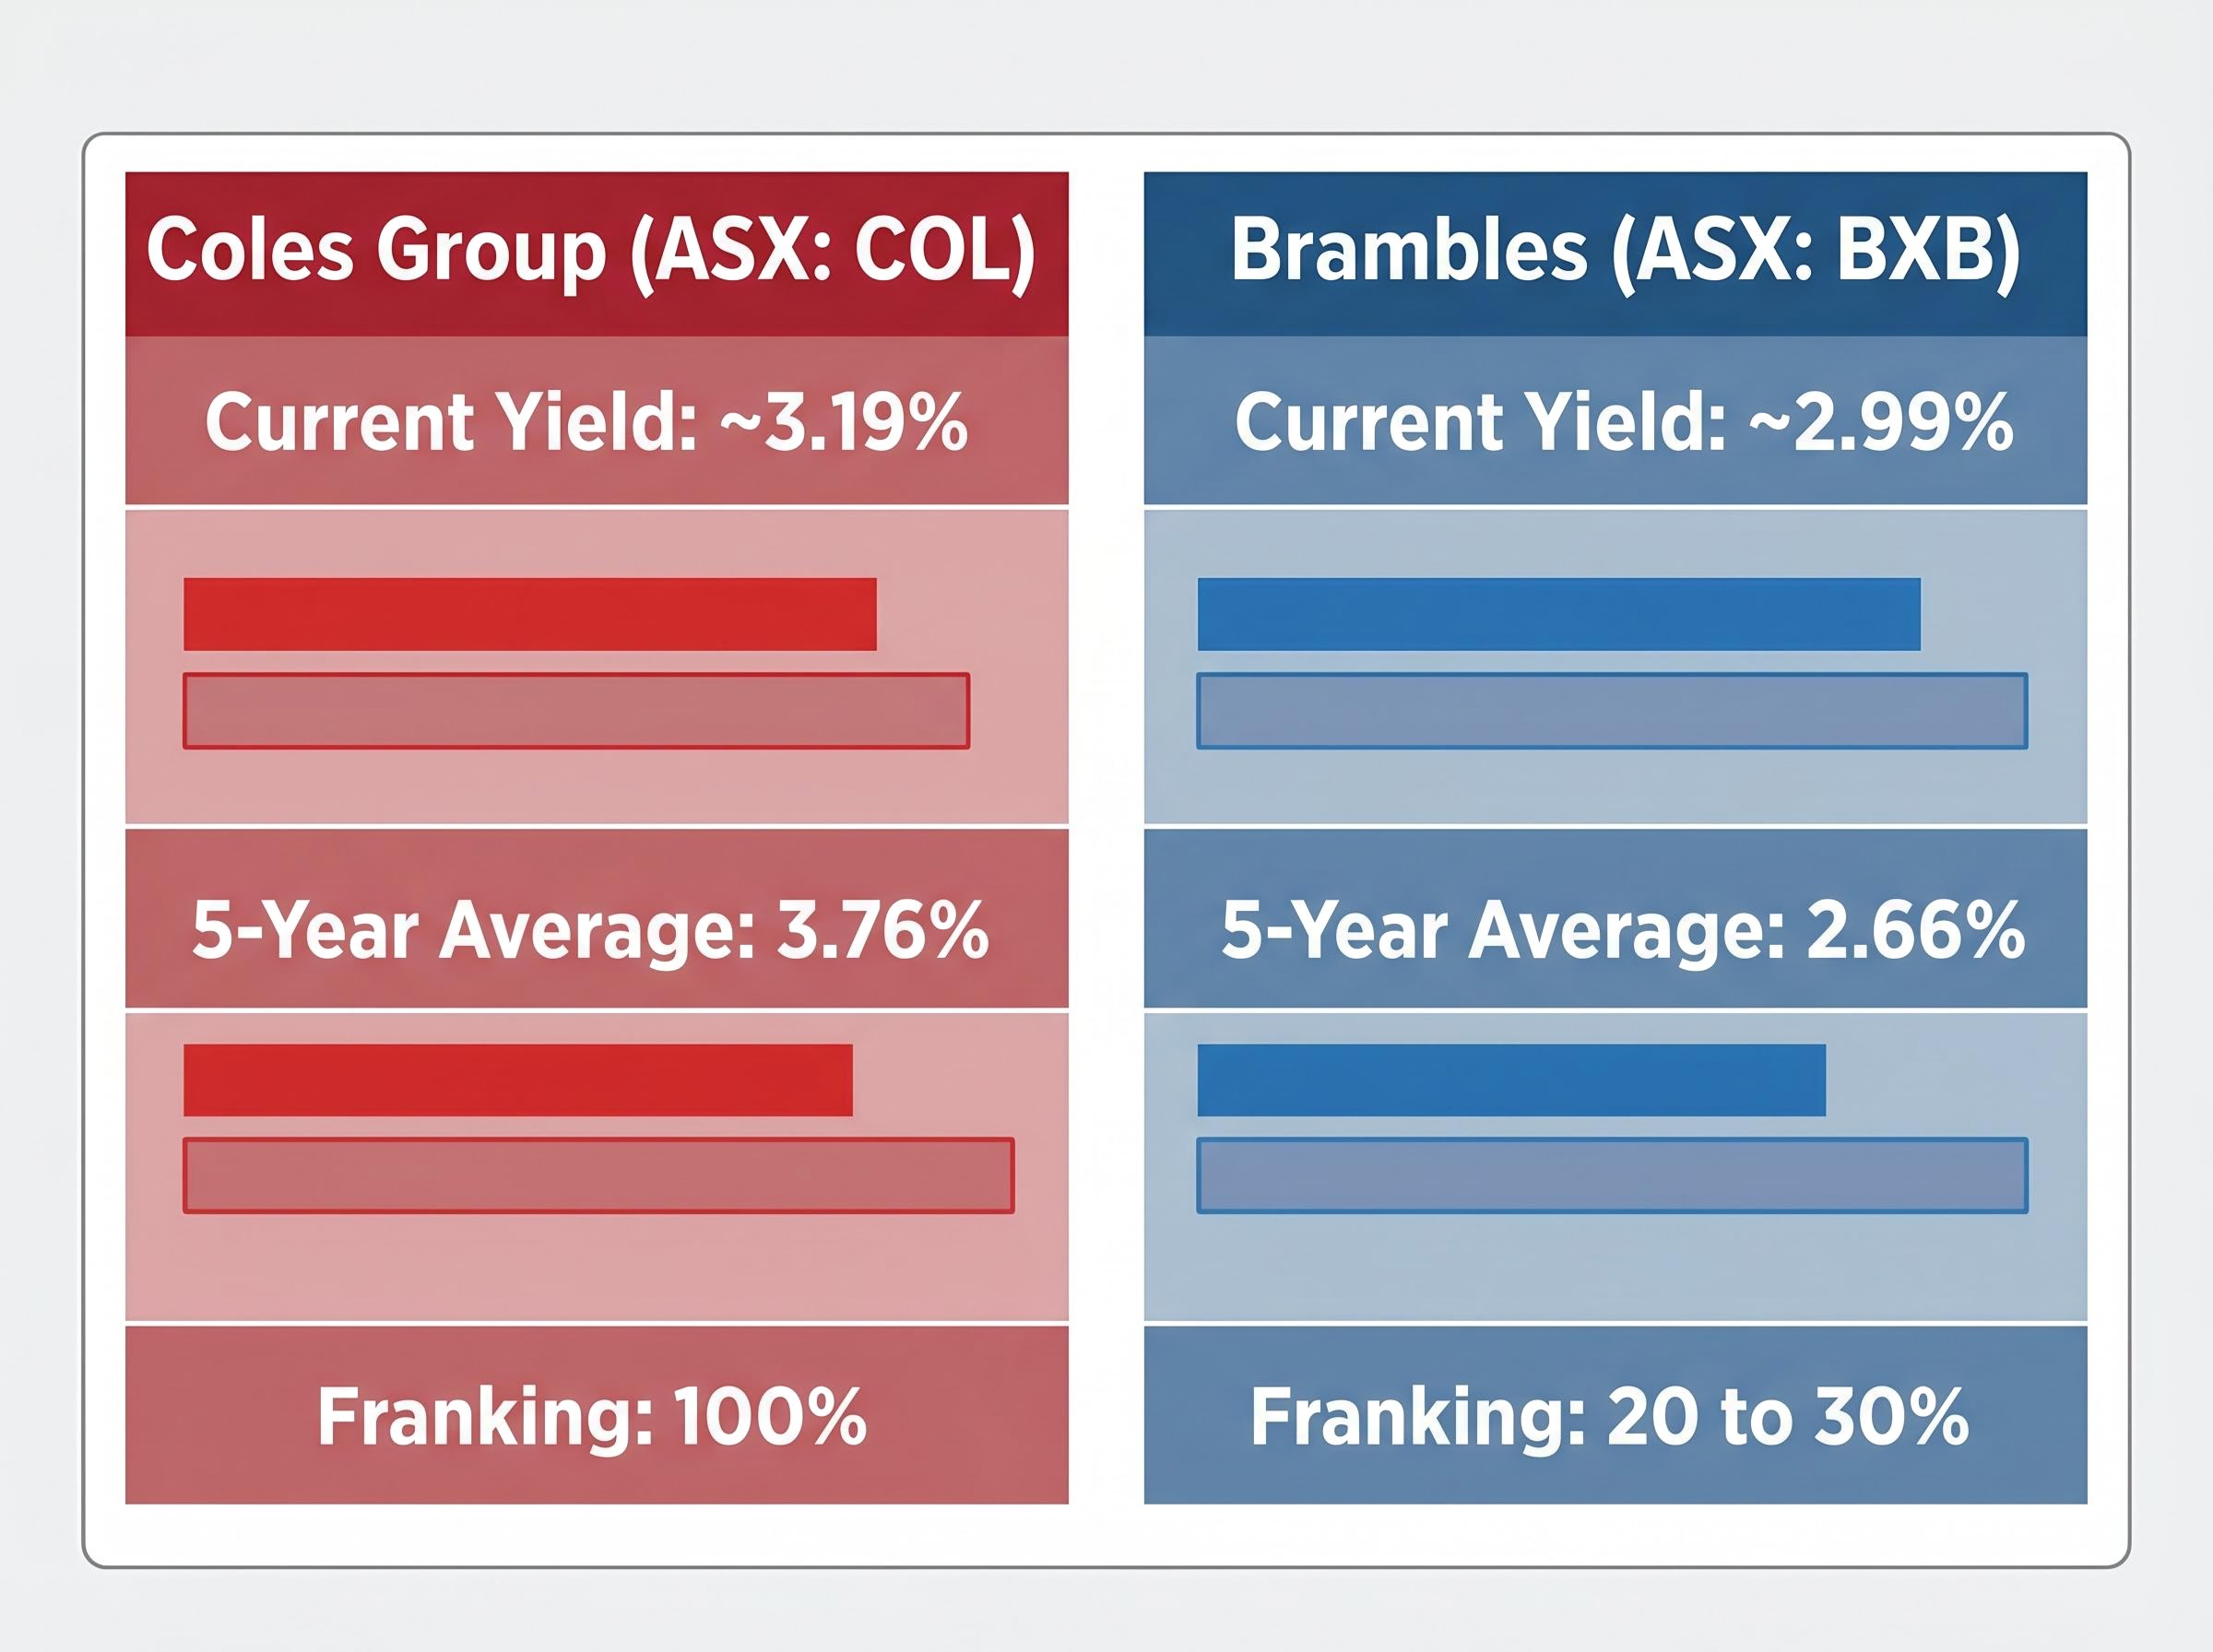
Coles Group presents a mild puzzle. The current dividend yield of approximately 3.19 per cent sits below its five-year historical average of 3.76 per cent. On the surface, a below-average yield might suggest the dividend has weakened. The dividend history tells a different story.
Valuation signal: COL’s current yield of ~3.19% sits below its five-year average of ~3.76%, a gap of roughly 57 basis points that points to price-driven compression rather than dividend deterioration.
| Financial Year | Interim Dividend | Final Dividend | Total | Franking |
|---|---|---|---|---|
| FY24 | 36 cents | 32 cents | ~68 cents | 100% |
| FY25 | 37 cents | 32 cents | ~69 cents | 100% |
The FY25 total dividend of approximately 69 cents per share exceeded the FY24 figure. The dividend has grown modestly. The yield compression, then, is price-driven: the COL share price has risen enough to push the yield below its historical average, even as the cash distributions have increased.
Because all Coles dividends are 100 per cent franked, the grossed-up yield for Australian resident taxpayers is meaningfully higher than the 3.19 per cent headline figure. At the corporate tax rate of 30 per cent, a fully franked dividend carries a tax credit that lifts the effective pre-tax return, a benefit that purely cash-based yield comparisons miss.
COL illustrates the most common interpretation challenge: a below-average yield does not automatically signal a weak dividend. It may simply reflect that the market has priced in growth or stability. Identifying which lever, price or dividend, is driving the yield movement is what separates a useful signal from a misleading one.
What Brambles’ yield is telling investors right now
Brambles offers the opposite signal. The current yield of approximately 2.99 per cent sits above its five-year historical average of 2.66 per cent, a spread of roughly 33 basis points in the other direction. Where COL’s below-average yield suggested confidence, BXB’s above-average yield raises a more open set of questions.
The answer is not simply that BXB is cheap. Three structural factors specific to Brambles complicate the reading:
- USD reporting currency: Brambles reports in US dollars but pays dividends in Australian dollars. The AUD amount shareholders receive fluctuates with the exchange rate, independent of the company’s underlying profit performance.
- Partial franking: Brambles’ predominantly offshore earnings base results in franking of approximately 20 to 30 per cent, significantly below the 100 per cent franking that domestic peers such as Coles deliver.
- Payout ratio variability: From FY24 onward, Brambles adopted a payout ratio target of 50 to 70 per cent of underlying profit after finance costs, introducing more dividend variability than a fixed-cents-per-share policy would.
The share price provides additional context. As of 27 May 2026, BXB was trading approximately 4.5 per cent above its 52-week low, suggesting the above-average yield is at least partly a function of price weakness rather than dividend strength. A recent half-year dividend of approximately AUD $0.3027 per share (paid in early 2025) illustrates the scale of individual payments.
Comparing COL and BXB on a like-for-like basis
The headline yields, ~3.19 per cent for COL and ~2.99 per cent for BXB, might suggest the two stocks offer broadly similar income returns. The franking differential tells a different story.
COL’s 100 per cent franking means the grossed-up yield for an Australian resident investor is materially higher than the headline figure. BXB’s 20 to 30 per cent franking provides a far smaller tax credit uplift. On a like-for-like after-tax basis, COL’s apparently lower headline yield may actually deliver a comparable or superior income return for resident taxpayers.
The grossed-up yield for a fully franked stock can exceed the headline cash yield by more than 40 per cent for eligible investors, a gap large enough to reverse a yield comparison conclusion when two stocks with different franking levels appear to offer similar headline returns.
This is precisely why yield comparisons across stocks require more care than yield comparisons within a single stock’s own history. Different franking levels, currency exposures, and payout policies can make headline yields misleading when read side by side.
The limits of yield comparison and what to check next
Yield comparison is a useful first filter. It is not a conclusion.
Yield trap warning: A high or rising yield can result from a falling share price driven by deteriorating business fundamentals. In these cases, the yield signal mimics cheapness while the underlying investment is weakening. The dividend may subsequently be cut, eliminating the very yield that attracted the investor.
The yield trap is more than a theoretical risk: in early 2026, the MSCI World High-Dividend Yield Index fell approximately 7.6 per cent peak to trough while the broader index recovered to all-time highs by mid-April, exposing the structural fragility of portfolios built on headline yield without earnings quality screening.
The ASX 200’s current yield of roughly 3.1 to 3.3 per cent sitting below its 10-year average of 4.3 per cent is itself an example of how index-level yield compression does not automatically indicate danger. It may reflect repricing toward growth, or it may reflect a structural shift in how Australian companies return capital to shareholders. The growing use of share buybacks as an alternative to dividends, for instance, can suppress the yield signal for companies that are returning substantial capital through a channel the yield formula does not capture.
After identifying an interesting yield signal, three follow-up checks help determine whether the signal is genuine:
- Check the payout ratio against earnings. A yield is only as durable as the earnings that fund it. A payout ratio above 80 to 90 per cent may indicate limited room for dividend growth or sustainability risk.
- Assess dividend stability. Has the dividend been maintained, grown steadily, or been cut in recent years? A history of cuts weakens the reliability of the historical average as a benchmark.
- Evaluate free cash flow coverage. The company needs to generate sufficient free cash flow (not just reported profit) to sustain the dividend through varying economic conditions.
Yield-based valuation also carries a structural bias toward mature, lower-growth industries where high payout ratios are common. Investors who rely on it heavily may systematically underweight companies that reinvest for growth or return capital through buybacks. More comprehensive valuation approaches, such as Discounted Cash Flow or Dividend Discount Models, exist for investors who want to move beyond the yield comparison starting point.
Yield comparison is a starting gate, not a finish line
Comparing a stock’s current yield to its historical average is a fast, accessible first filter that any investor can apply with publicly available data. COL and BXB demonstrate how the same framework produces two different analytical conversations: one where below-average yield reflects price-driven confidence, and another where above-average yield raises structural questions about currency, franking, and payout policy that require further investigation.
In the current Australian environment, with the RBA cash rate at 4.35 per cent, the bar for dividend shares to deliver a compelling after-tax return is higher than in low-rate periods. That makes rigorous yield analysis more important, not less.
Investors can apply this same yield comparison framework to other ASX stocks they follow. The natural next step is examining payout ratios and earnings sustainability, the two checks that determine whether a yield signal is a genuine starting point for further research or a number that flatters to deceive.
Investors wanting to see the same analytical framework applied to a third ASX blue-chip will find our full explainer on dividend yield history as a valuation signal, which uses Macquarie Group as a live case study and covers how to interpret a compressed yield against the RBA cash rate, the payout ratio ceiling, and a 200-basis-point gap to the 10-year government bond yield.
This article is for informational purposes only and should not be considered financial advice. Investors should conduct their own research and consult with financial professionals before making investment decisions. Past performance does not guarantee future results.