How Many Westpac Shares You Need for $10,000 in Income
11 hrs ago

Most investors react to economic news after it lands. Sector rotation strategy operates on a different premise: the market itself reveals where the economy is heading before official data confirms it. Capital flows between sectors in anticipation of shifts in growth, inflation, and interest rates, and that movement leaves a trail investors can learn to read.
With AI-related capital spending projected to reach $725 billion in 2026, according to JPMorgan Asset Management, and sector leadership increasingly concentrated in technology, U.S. investors face a market environment that both illustrates and complicates the traditional business-cycle playbook. The question is not whether sectors rotate; it is whether investors can detect the rotation early enough to act on it.
This guide explains the logic behind sector rotation, walks through the four business cycle phases and their associated sector leadership patterns, clarifies the distinction between cyclical and defensive sectors (including Energy’s genuinely ambiguous status), and introduces the analytical tools practitioners use to detect rotation in real time.
The core premise is counterintuitive. Markets are not mirrors that reflect economic conditions after the fact. They are forward-looking mechanisms in which institutional capital repositions ahead of changes that official statistics will only confirm weeks or months later. If an investor can read where that capital is flowing, the economy becomes visible before economists describe it.
Sector rotation is grounded in one observation: different sectors respond differently to changes in macroeconomic conditions. The five primary drivers that trigger sector leadership shifts are:
Cedric Thompson, a CMT and CFA charterholder who has employed this methodology for approximately 15 years, exemplifies the framework’s durability as a practitioner tool. The logic is straightforward: because large pools of capital reposition as participants anticipate changes in these five drivers, sector leadership shifts carry information about the direction of the economy.
Monitoring that leadership is a way to read market intelligence rather than simply react to headlines. The alternative, waiting for official confirmation, means entering a trade after institutional capital has already moved.
Interpreting GDP releases without overreacting to headline misses is a foundational skill for cycle-phase analysis, because advance GDP estimates carry average absolute revisions of approximately 0.6 percentage points, meaning a modest consensus miss can disappear entirely in subsequent data while equity markets have already repriced the expectation weeks earlier.
The economy moves through four broadly recognisable phases, and each creates conditions that structurally favour certain sectors over others. What makes the framework useful is that each phase follows logically from the one before it, forming a cycle rather than four disconnected states.
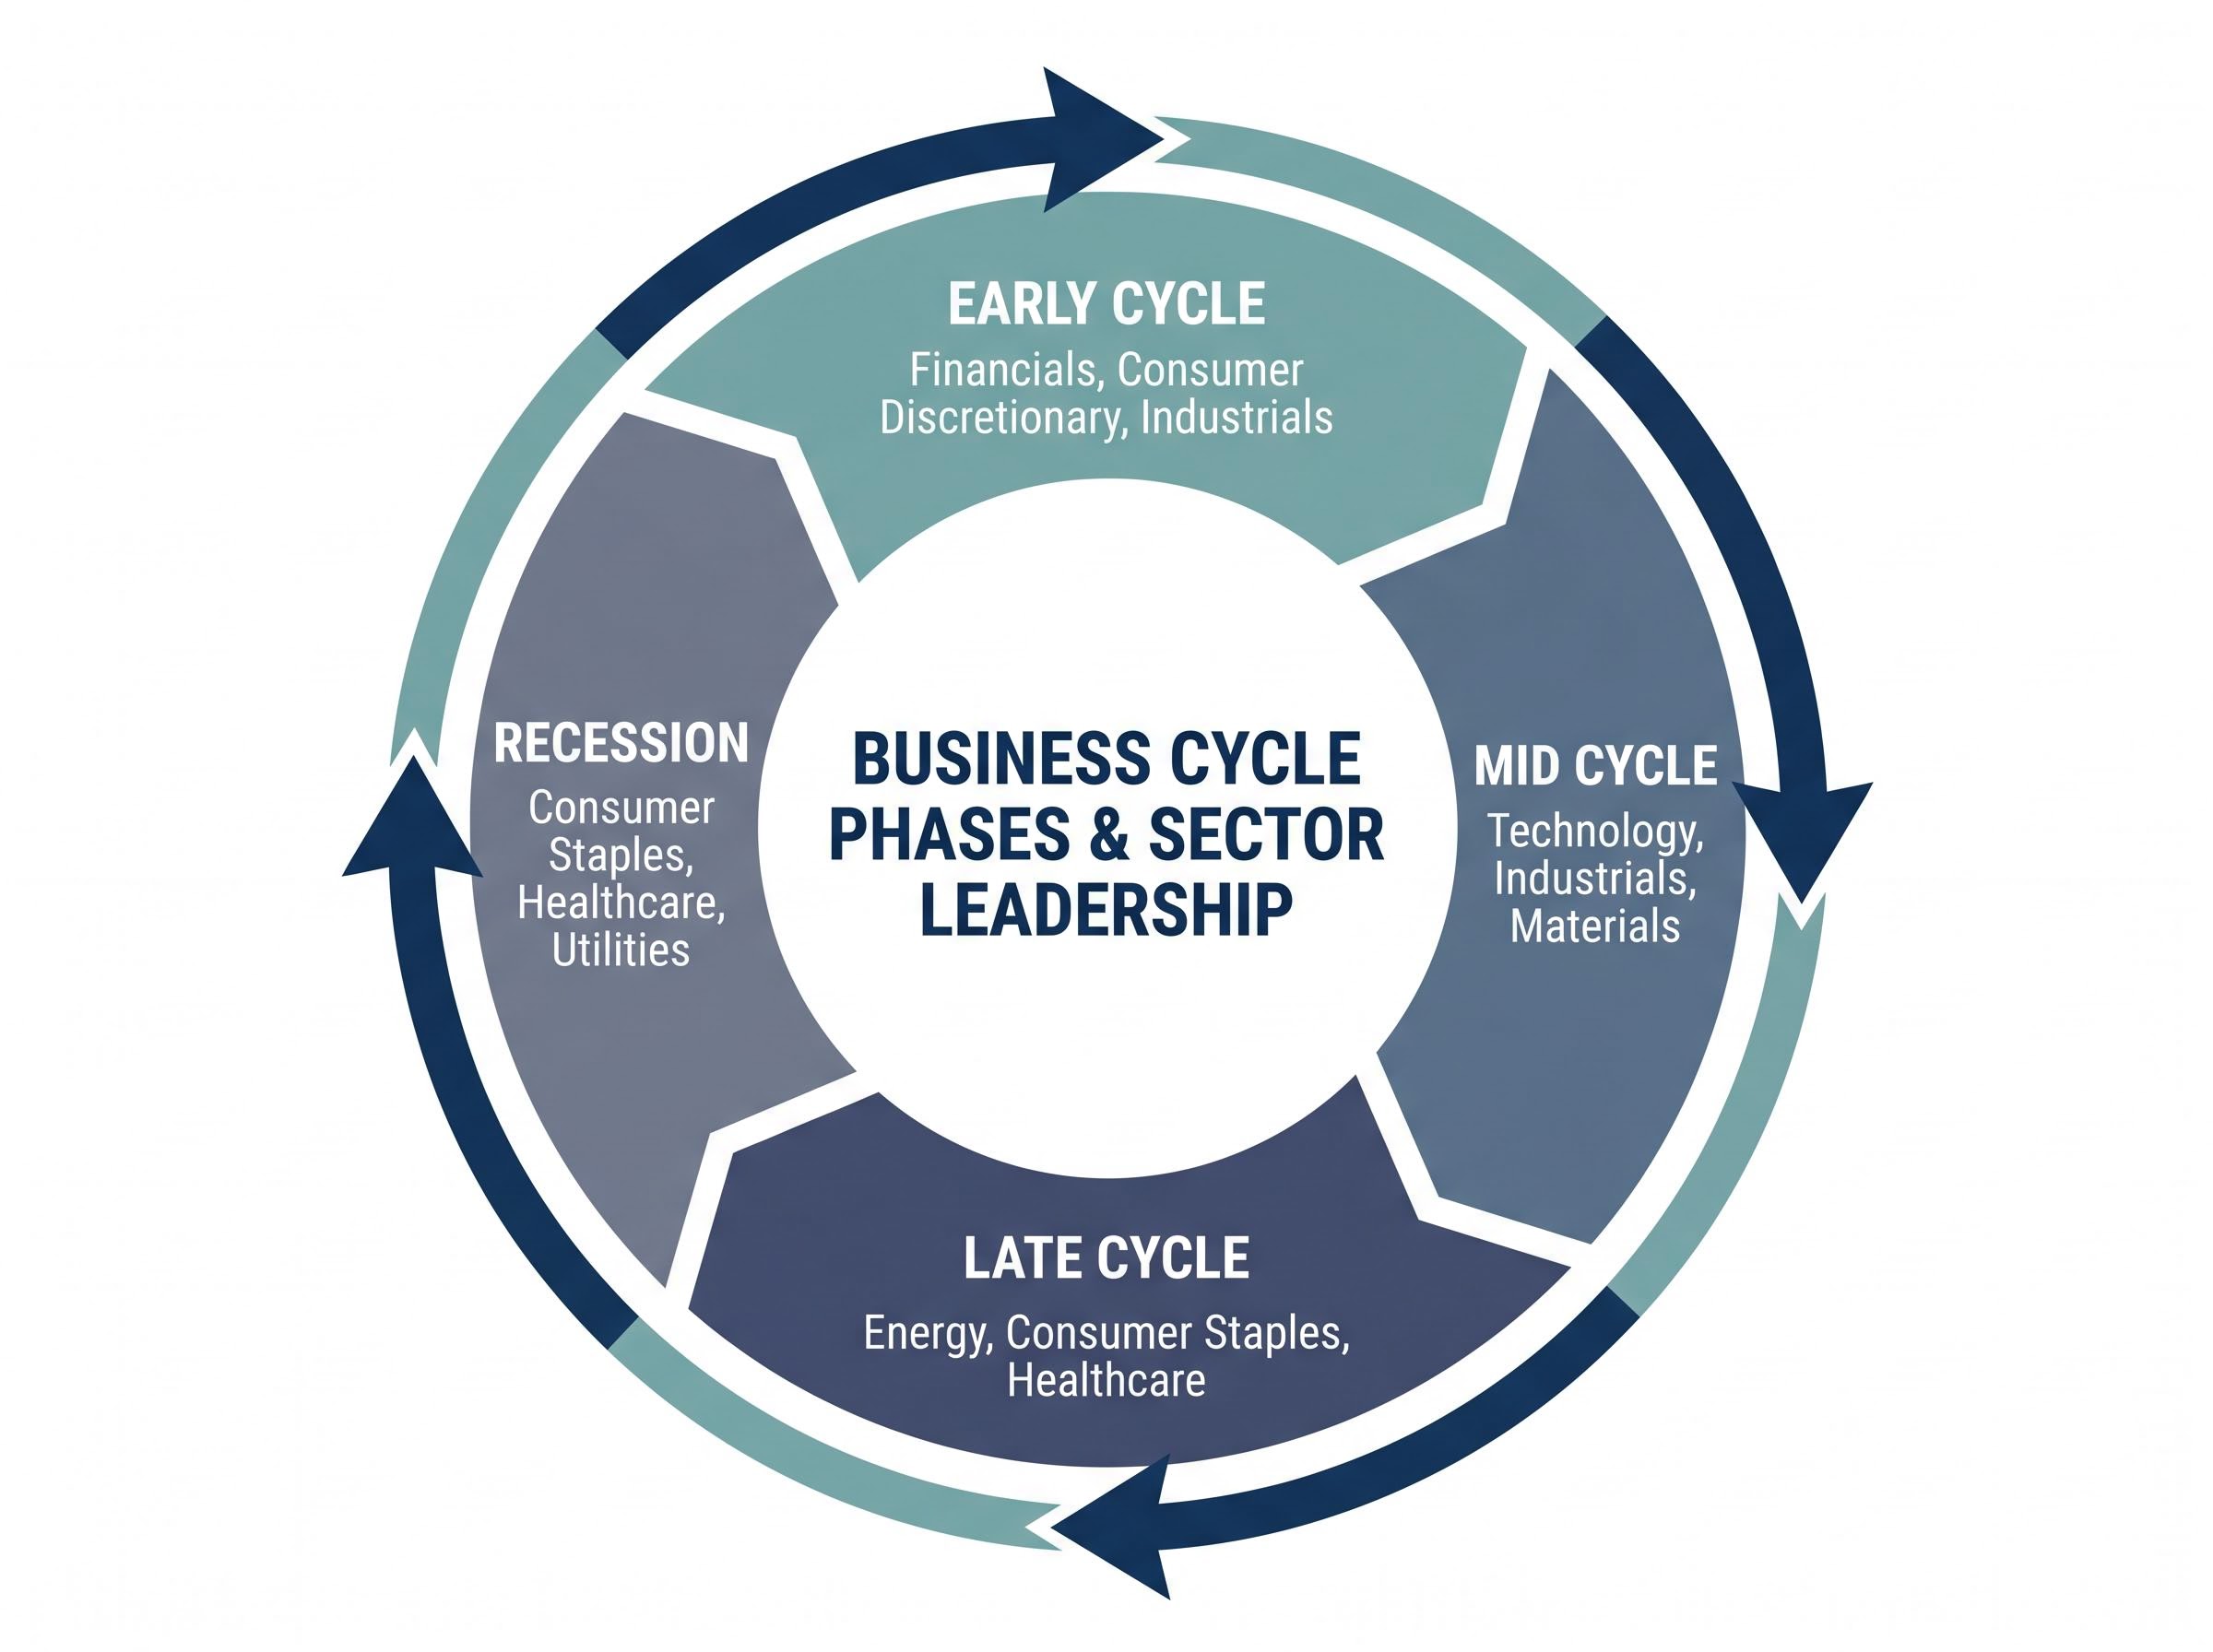
In the early cycle, monetary policy turns accommodative and credit conditions begin improving. Consumers start spending again. Financials, Consumer Discretionary, and Industrials tend to outperform because their earnings are most sensitive to the initial recovery in lending, spending, and business investment. Critically, early-cycle sector leadership typically emerges before headline indicators such as employment or GDP growth have visibly improved.
As expansion broadens into the mid cycle, earnings strength spreads across a wider set of industries. Technology, Industrials, and Materials benefit as businesses invest in capacity and markets price sustained growth. This is often the longest phase, and the one where investor confidence is highest.
The late cycle is where momentum begins to fade. Inflationary pressure builds, the central bank tightens, and the yield curve flattens. Sectors with stronger pricing power or more stable earnings, specifically Energy, Consumer Staples, and Healthcare, tend to hold up as margin compression hits more cyclically sensitive industries.
In recession, profits decline broadly, credit stress rises, and risk appetite contracts. Consumer Staples, Healthcare, and Utilities lead in relative terms because demand for groceries, medicine, and electricity persists regardless of the economic backdrop.
| Cycle Phase | Economic Conditions | Sector Leaders | What to Watch |
|---|---|---|---|
| Early Cycle | Accommodative policy, improving credit, initial recovery | Financials, Consumer Discretionary, Industrials | Lending activity, consumer confidence, yield curve steepening |
| Mid Cycle | Broadening earnings, sustained expansion, business investment | Technology, Industrials, Materials | Earnings breadth, capital expenditure growth, margin stability |
| Late Cycle | Tightening policy, yield curve flattening, inflationary pressure | Energy, Consumer Staples, Healthcare | Inflation readings, central bank rhetoric, margin compression signals |
| Recession | Declining profits, elevated credit stress, risk aversion | Consumer Staples, Healthcare, Utilities | Credit spreads, unemployment claims, earnings revision direction |
The value of this map is diagnostic. Recognising which phase characteristics are present in the current environment helps translate macro observations into sector-level positioning decisions.
The distinction between cyclical and defensive sectors determines how a portfolio responds to economic shifts. Getting the classification wrong leads to misreading what sector leadership is actually signalling.
Cyclical sectors derive their earnings from discretionary spending, business investment, and market confidence. When the economy expands, their revenues accelerate; when it contracts, they compress. The cyclical group includes:
Defensive sectors serve demand that persists regardless of economic conditions. People continue buying groceries, refilling prescriptions, and using electricity in recessions. The defensive group includes:
One of the most common errors in applying this framework is expecting defensive sectors to produce positive absolute returns during downturns. They do not reliably do so.
Defensive sectors offer relative resilience, meaning they tend to decline less than cyclical sectors during contractions. They do not guarantee positive returns in recessions. The distinction between “falling less” and “going up” matters significantly for portfolio construction.
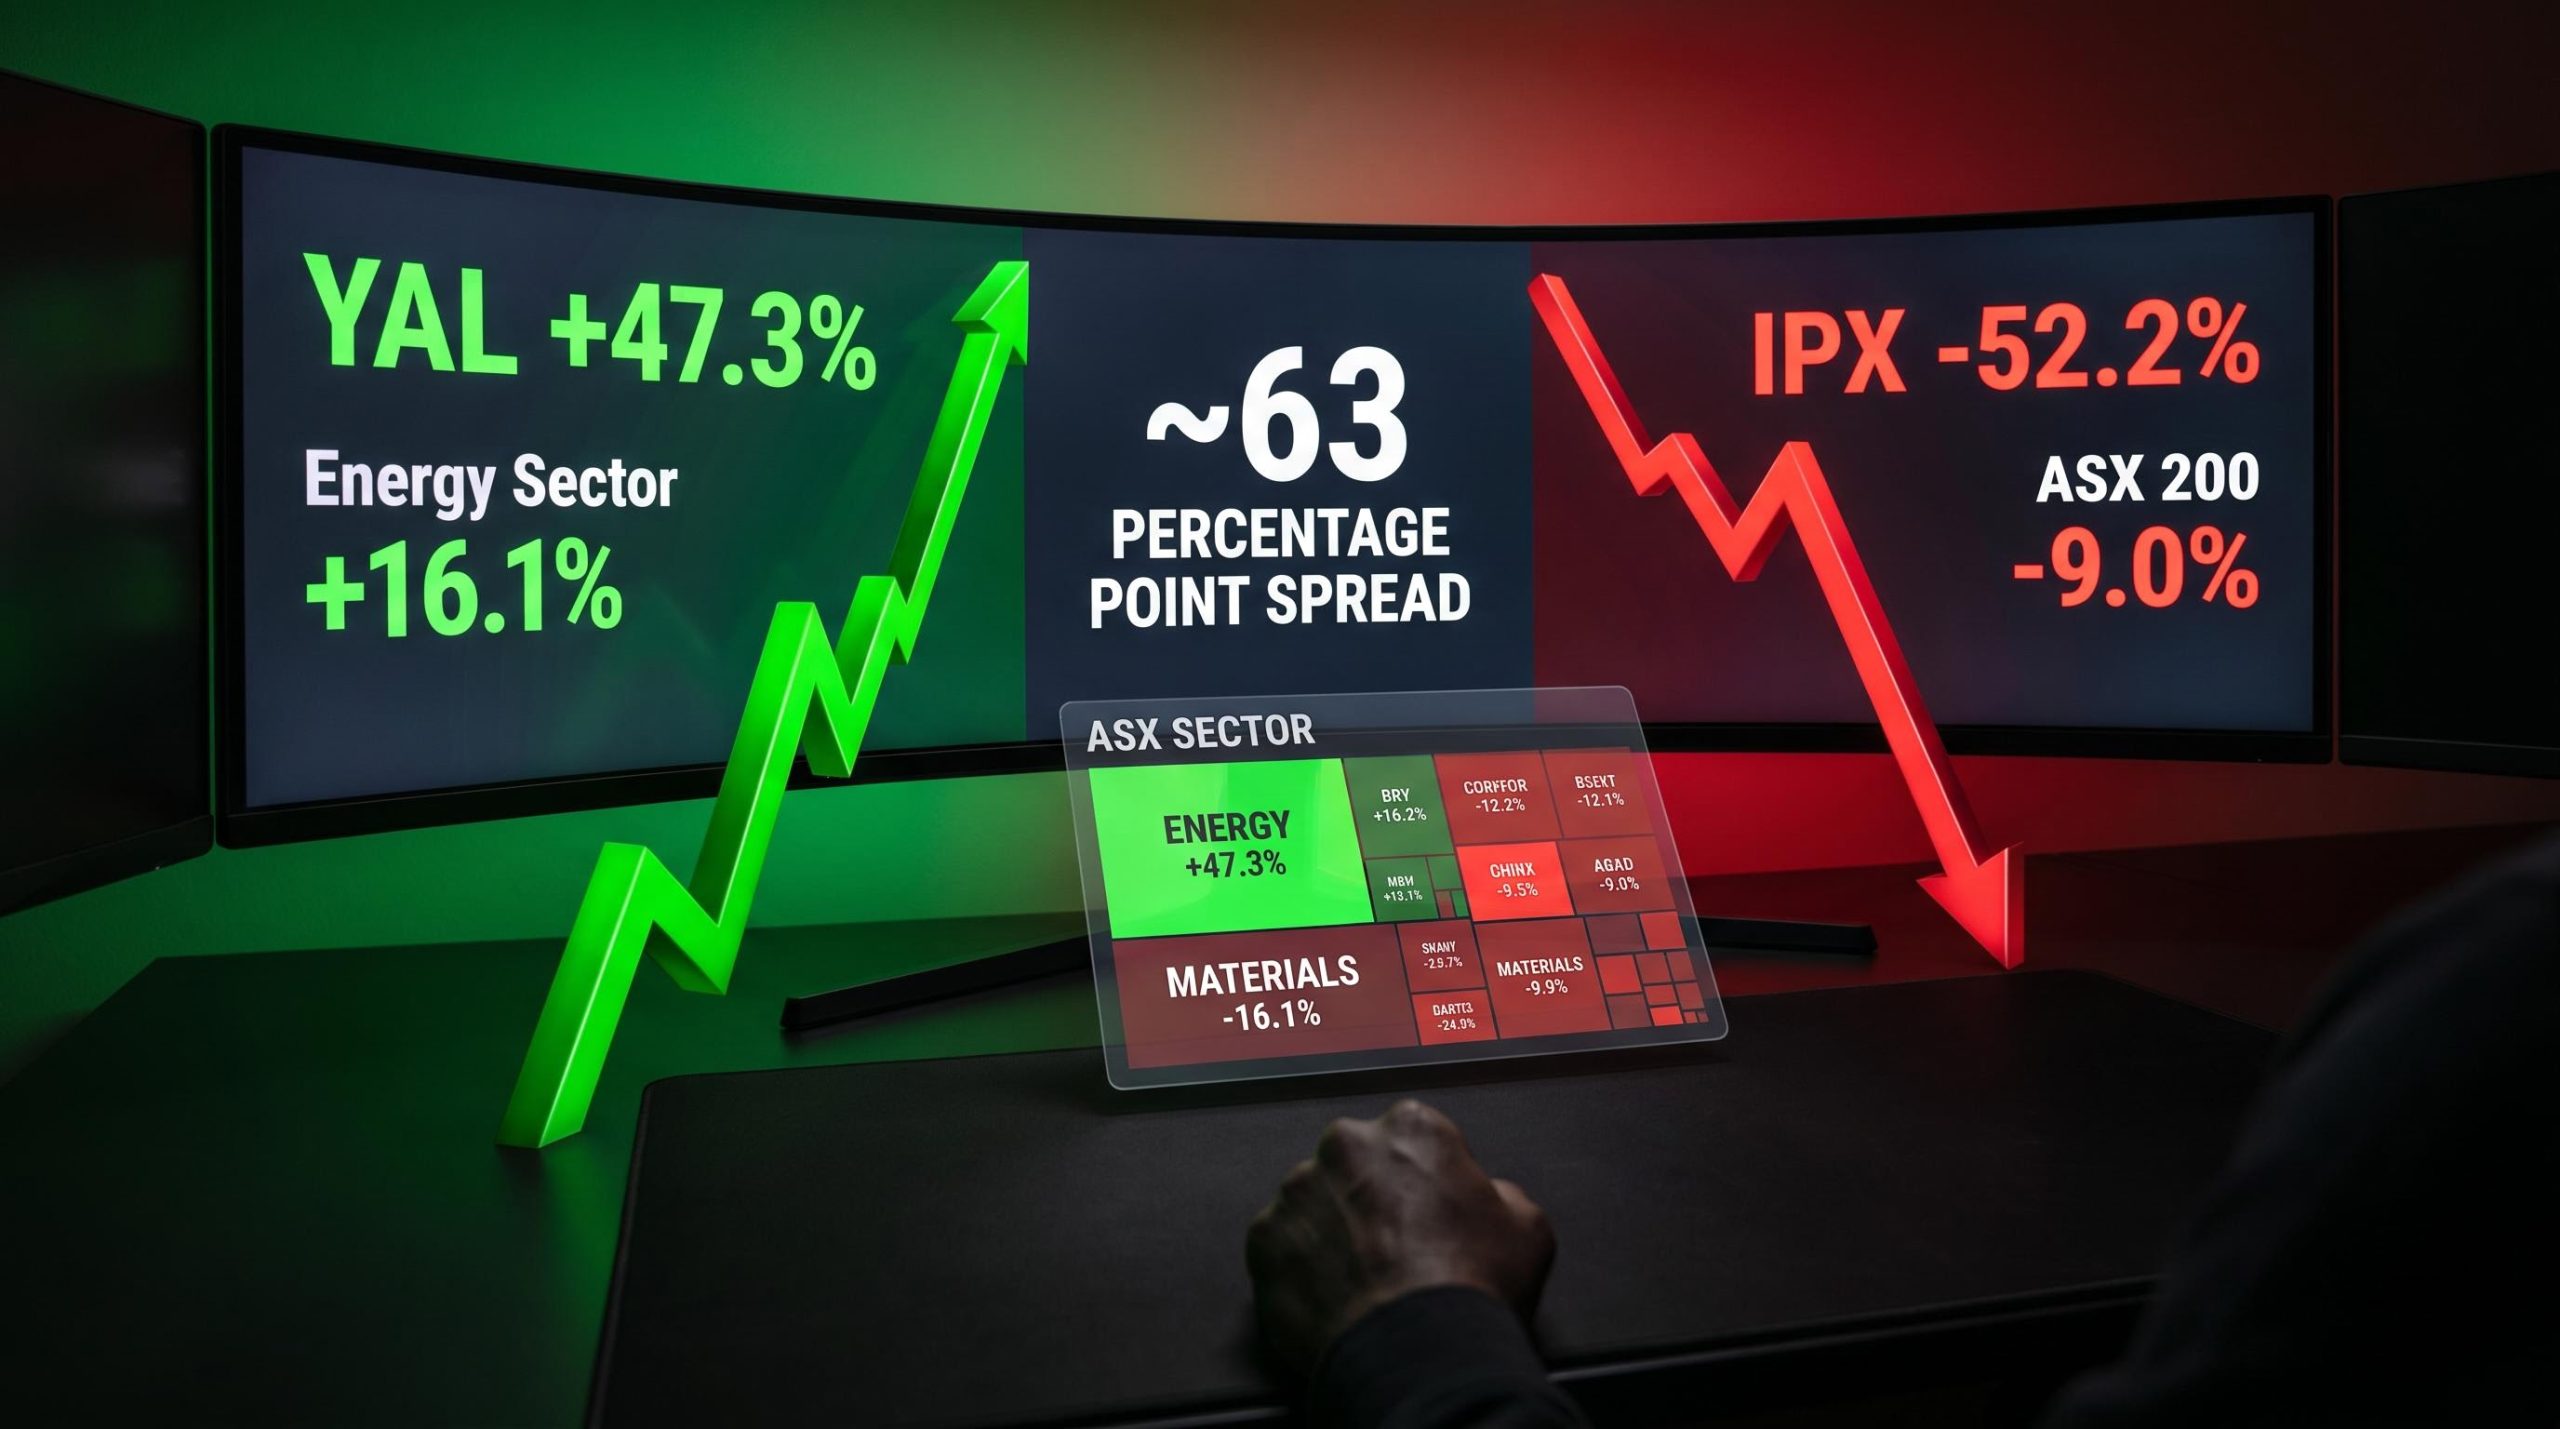
Defensive sector valuations have diverged sharply from growth benchmarks as AI enthusiasm has concentrated capital: consumer staples now trade at roughly 19-20x forward earnings versus Information Technology’s approximately 26x, a gap that contrarian managers argue prices in a permanently weak consumer unlikely to materialise, and that creates asymmetric positioning opportunities at late-cycle and recessionary entry points.
Energy resists clean classification because its performance can stem from fundamentally different drivers. In a growth environment, Energy behaves pro-cyclically: rising demand expectations push oil and gas prices higher alongside the broader economy. In an inflationary or supply-shock environment, Energy functions as a commodity-linked inflation hedge, potentially rising even as other sectors fall.
The practical implication is direct. Before drawing conclusions about what Energy leadership signals for the broader market, investors need to identify the driver behind it. Demand-driven Energy strength suggests mid-to-late-cycle expansion. Supply-shock-driven Energy strength may say nothing about the cycle at all.
The business cycle map identifies where sectors should lead. The tools in this section reveal where capital is actually moving, in real time, providing confirmation or contradiction of the cycle reading.
The Relative Rotation Graph (RRG) is a charting tool that measures two dimensions simultaneously for each sector relative to a benchmark (typically the S&P 500). The x-axis plots JdK RS-Ratio, where values above 100 indicate the sector is outperforming the benchmark. The y-axis plots JdK RS-Momentum, which measures whether that relative strength is accelerating or decelerating. Momentum often provides an earlier signal than the ratio itself.
As sectors move through the RRG, they trace a path through four quadrants:
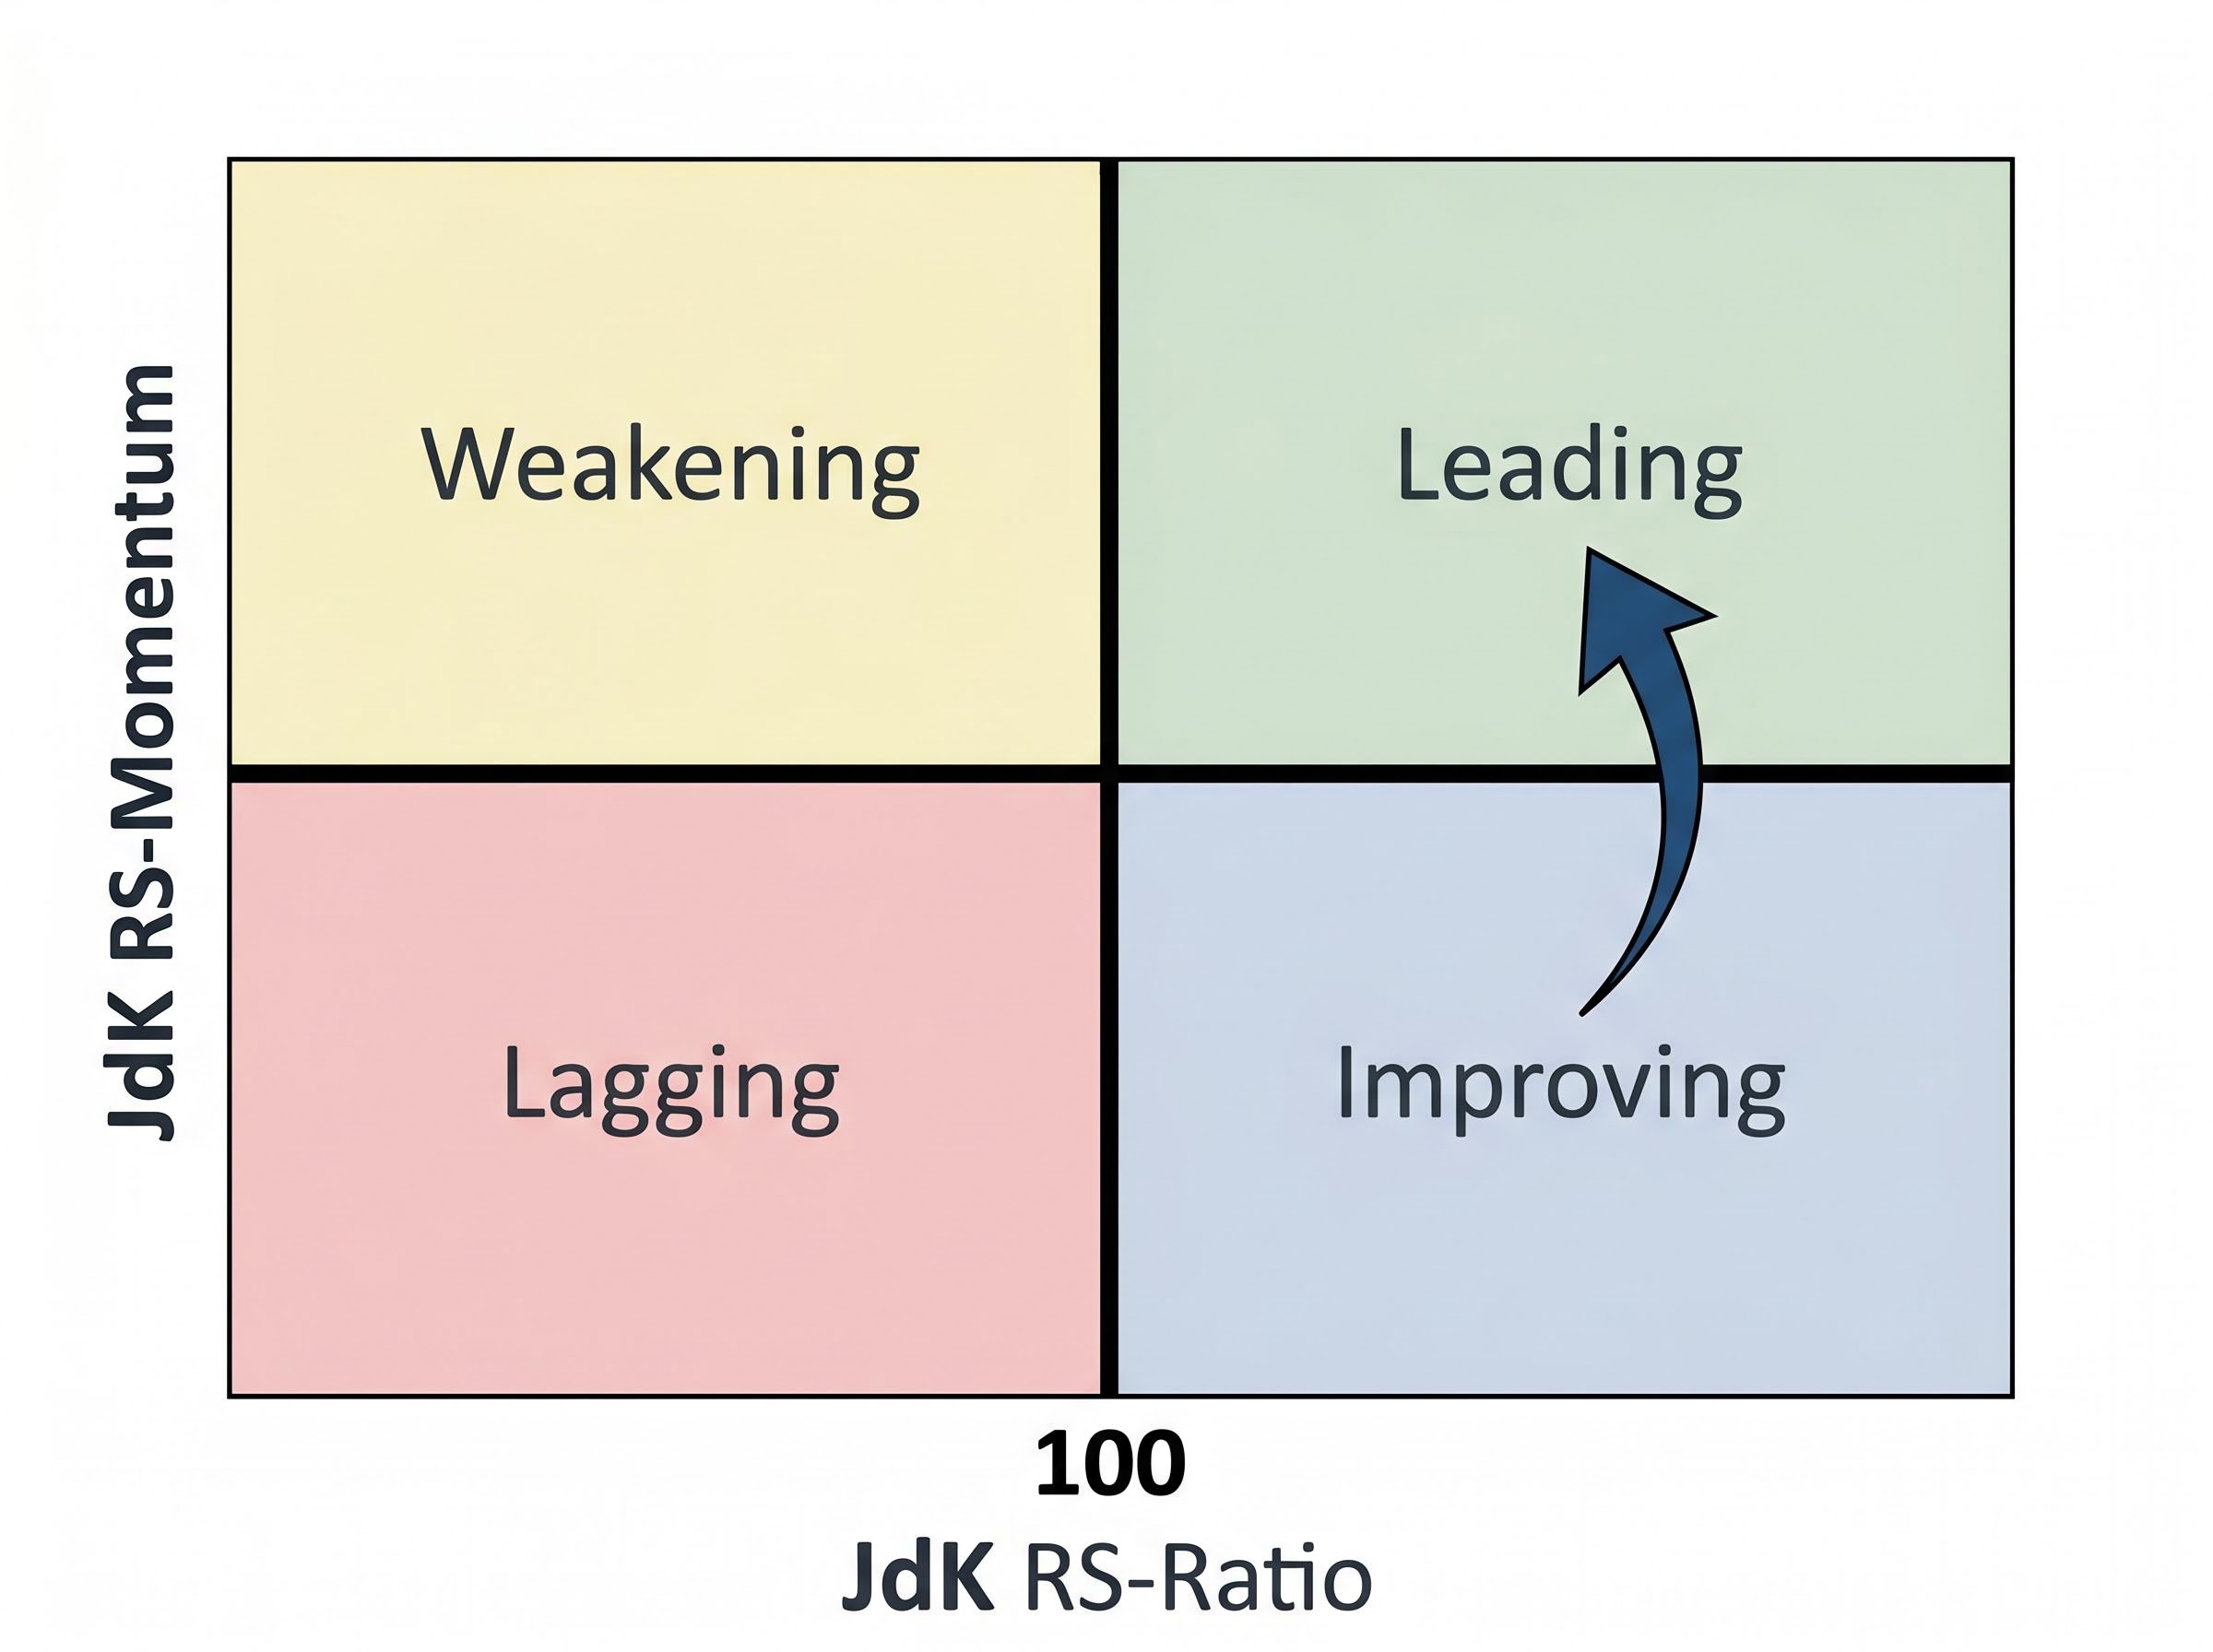
The transition from Improving to Leading is the signal practitioners watch most closely. It identifies sectors gaining strength before the move is obvious in headline performance.
Monitoring where capital is flowing provides an earlier signal than waiting for macro data to confirm a cycle-phase transition. By the time official indicators change, institutional capital has often already repositioned.
Price-based tools like RRG show where momentum is building. Fund flow tools show where money is actually entering and leaving.
EPFR (accessed via ISI Markets) tracks fund flows across asset classes, countries, industries, and individual securities. Its primary value for rotation analysis is identifying crowding, stress points, and early rotation signals before macroeconomic data confirms them. This is an institutional-grade platform, but the insight it provides, that capital movement leads economic data, is relevant to all investors.
For more accessible monitoring, ETF Database (etfdb.com) allows screening of ETF-level inflows and outflows by sector in near real time. This provides a practical retail complement to institutional flow tools and allows investors to observe where money is entering or exiting sector ETFs without requiring an institutional subscription.
JPMorgan’s Monthly Active ETF Monitor (most recently published April 2026) offers an example of how major asset managers integrate flow signals with fundamental reasoning. The April report identified flows rotating back toward growth, technology, and U.S.-centric strategies, a data point individual investors can use as a reference signal for institutional positioning direction.
The four-phase cycle map is a useful starting point. It is not a mechanical system, and the current environment illustrates precisely where it fails.
Three structural distortions weaken the predictive reliability of simple cycle-phase rules:
According to JPMorgan Asset Management’s April 2026 commentary, AI-related capital spending is projected to reach $725 billion in 2026, creating a structural demand driver for technology and related infrastructure that does not follow cyclical patterns.
The AI investment boom driving Technology’s current leadership is structurally different from prior tech cycles: combined hyperscaler CapEx commitments for 2026 sit in the $600-$805 billion range, and Goldman Sachs projects meaningful ROI from enterprise deployments emerging only by 2027-2028, a timeline that extends well beyond any single business cycle phase.
JPMorgan’s analysis reinforces a broader point: rising earnings dispersion within sectors means that even a correct cycle-phase call may produce disappointing results if the investor holds the wrong securities within the favoured sector. Active judgement within sectors matters as much as the sector call itself.
The business cycle can also skip phases or become distorted by fiscal policy interventions. The pandemic-era response compressed the recession and early-cycle phases into months rather than years. Investors who treated the cycle map as a mechanical system during that period were positioned for conditions that never fully materialised.
The EPFR/ISI Markets framework underscores a related limitation: because flows reveal rotation before macro data does, waiting for official cycle-phase confirmation means entering after institutional capital has already moved. The map is valuable as an orientation tool. It becomes dangerous when treated as the definitive answer.
Translating cycle reading into a portfolio decision requires sequencing multiple signals rather than relying on any single indicator. A practical framework follows four steps:
The most practical implementation vehicle for U.S. investors is the SPDR Select Sector ETF series, which provides low-cost exposure to each of the eleven GICS sectors. Both retail and institutional investors use these ETFs to express sector tilts relative to the S&P 500 benchmark.
For investors considering whether to implement sector tilts through thematic ETFs rather than broad SPDR sector funds, our dedicated guide to thematic ETF rotation risk documents how technology-themed products fell by up to 25% in 2026 while resources and energy ETFs returned triple digits, and examines why the behaviour gap between reported fund returns and actual investor returns is consistently widest in thematic products.
The magnitude of those tilts depends on conviction. Cedric Thompson’s RRG-based allocation model, as of May 2026, illustrates the difference between a conviction-driven framework and benchmark tracking:
| Sector | Approximate Benchmark Weight | Example Conviction Tilt |
|---|---|---|
| Technology | ~35% | ~49.4% |
| Energy | ~3.5% | ~13.2% |
Price action, relative strength, momentum, and volatility determine the final allocation conclusions. The business cycle serves as a macro map, not the sole decision input.
Rotation strategies generate portfolio turnover, and turnover creates tax consequences. In taxable accounts, short-term capital gains (on positions held less than one year) are taxed at ordinary income rates, which can meaningfully erode the net benefit of a correctly timed rotation.
Tax-advantaged accounts such as IRAs and 401(k)s reduce this friction substantially, making them more suitable vehicles for higher-frequency rebalancing. For investors implementing rotation in taxable accounts, the timing and frequency of rebalancing decisions should factor in the after-tax cost of each trade, not just the pre-tax signal.
The SEC investor guidance on asset allocation reinforces that diversification across industry sectors is a foundational risk management principle, not merely a return-enhancement strategy, which is relevant context for any investor sizing rotation tilts relative to a benchmark.
For readers seeking detailed implementation guidance with specific rebalancing rules and tax-optimisation strategies, ETF provider white papers and FINRA/SEC investor education resources on sector allocation offer more granular coverage.
Sector rotation works because capital moves in anticipation of economic change. Monitoring that movement provides a forward-looking signal unavailable in official data. That is the framework’s core value, and it holds.
What does not hold is the assumption that the business cycle alone provides a mechanical answer. Cycle phases can be distorted or skipped. Defensive sectors offer resilience, not guaranteed gains. Energy requires contextual interpretation before it signals anything useful about broader conditions.
The most effective application combines three confirmation layers:
Each signal is used to confirm or challenge the others. No single layer substitutes for the full picture.
This article is for informational purposes only and should not be considered financial advice. Investors should conduct their own research and consult with financial professionals before making investment decisions. Past performance does not guarantee future results, and the business cycle framework described here is subject to structural distortions and market conditions that may limit its predictive reliability.
Sector rotation strategy is an investment approach that shifts capital between different economic sectors based on where the economy is in the business cycle. Because institutional capital repositions in anticipation of economic changes, monitoring sector leadership reveals forward-looking signals before official data like GDP or employment figures confirms them.
Consumer Staples, Healthcare, and Utilities tend to lead in relative terms during recessions because demand for groceries, medicine, and electricity persists regardless of economic conditions. These defensive sectors typically decline less than cyclical sectors during contractions, though they do not guarantee positive absolute returns.
A Relative Rotation Graph (RRG) is a charting tool that plots each sector's relative strength against a benchmark on one axis and the momentum of that relative strength on the other, allowing investors to see which sectors are gaining or losing leadership in real time. The transition from the Improving quadrant to the Leading quadrant is the signal practitioners watch most closely, as it identifies sectors building strength before the move is visible in headline performance data.
Three structural distortions weaken the traditional cycle-phase playbook: AI-driven secular demand that does not follow cyclical patterns, heavy market concentration in a small number of large-cap technology names, and rising earnings dispersion within sectors that means a correct cycle-phase call can still produce poor results if the investor holds the wrong securities. JPMorgan Asset Management projects AI-related capital spending will reach $725 billion in 2026, creating a multi-year demand driver that extends beyond any single business cycle phase.
Individual investors can monitor ETF-level inflows and outflows by sector in near real time using ETF Database (etfdb.com), which provides a practical retail alternative to institutional platforms like EPFR. JPMorgan's Monthly Active ETF Monitor also offers publicly available flow analysis that individual investors can use as a reference signal for institutional positioning direction.