
The 2026 Software Selloff Is a Selectivity Test, Not a Sector Call
12 mins ago

National Australia Bank shares closed at $36.52 on 15 May 2026. Two standard valuation methods applied to that same price produce estimates of $40.23 and anywhere from $35.74 to $51.66. That gap is not a mistake. It is the question this article unpacks. With the Reserve Bank of Australia (RBA) having lifted the cash rate three times in 2026 to reach 4.35%, the assumptions that underpin any bank valuation have shifted materially from even twelve months ago. Discount rates are higher, deposit competition is intensifying, and the credit cycle is no longer operating from historically benign conditions. For dividend-focused investors holding or considering NAB, the timing matters. What follows applies both a price-to-earnings (P/E) ratio method and a Dividend Discount Model (DDM) directly to NAB’s current reported data, explains what each output means in plain terms, identifies where each method is likely to mislead, and synthesises a practical view of whether the $36 price level reflects fair value or leaves room for either concern or opportunity.
Before applying any valuation methodology, the raw inputs deserve attention on their own terms. NAB’s recent financial data provides the baseline that both models draw from:
These figures anchor every calculation that follows. The share price is stable within a narrow band. The interim dividend confirms the payout remains fully franked, which carries specific implications for Australian resident investors that the DDM section will address.
Commonwealth Bank commands the highest P/E and price-to-book ratio in the Big Four, a structural premium that has persisted across multiple reporting cycles rather than reflecting any short-term anomaly. NAB sits in the mid-pack alongside ANZ and Westpac on earnings multiples, trading at a discount to CBA. At current prices, NAB’s fully franked dividend yield is more attractive than CBA’s, positioning it as an income story rather than a growth story. That distinction matters for the valuation methods ahead.
The P/E method divides the current share price by earnings per share to derive a multiple, then applies the sector average multiple to the same EPS to produce a sector-adjusted price estimate. It answers one question: is this stock cheap or expensive relative to its peers?
| Input | Value | Implication |
|---|---|---|
| FY24 EPS | $2.26 | Base for both methods |
| NAB PE | 16.1x | Below sector average |
| Sector PE | 18x | Applied to derive target |
| PE-implied price | $40.23 | 10.8% above current price |
NAB’s implied PE of 16.1x sits below the banking sector average of 18x. Multiplying the sector average by NAB’s FY24 EPS of $2.26 produces a sector-adjusted price of $40.23, roughly 10.8% above where the stock closed last week.
That looks like a discount worth investigating. It may also be a trap.
The 2022-2025 period delivered ultra-low bad debts and net interest margin (NIM) expansion from rising rates. Those conditions inflated bank earnings across the sector. If current EPS represents a cyclical peak rather than a sustainable run-rate, the denominator in the PE calculation flatters the stock. Share buybacks can further boost EPS mechanically without improving underlying profitability, and one-off items can distort reported figures.
The NIM tailwind from the rate-hike cycle has largely played out across the sector, and investors who extrapolate that expansion forward risk overstating future EPS, which directly inflates the denominator in any PE-based target price calculation.
“A P/E ratio built on peak earnings is not a margin of safety.”
Many Australian investors hold bank stocks primarily for income. The DDM formalises that intuition into a price estimate. It says: the fair value of a share equals the present value of all the dividends it will pay in the future.
In its simplest form, the model has three inputs:
Banks suit this model because they are stable, high-payout businesses with predictable (if cyclical) dividend histories, unlike growth companies that retain most of their earnings.
The franking credit adjustment is where the Australian context changes the arithmetic materially. NAB’s most recent full-year cash dividend of $1.69 per share becomes $2.44 once franking credits are factored in for eligible Australian resident investors.
“NAB’s fully franked $1.69 cash dividend becomes $2.44 once franking credits are factored in for eligible Australian investors.”
That grossed-up figure is not a bonus. It is a structural input. Using the cash dividend alone understates the effective yield that a domestic investor receives, which in turn understates the DDM’s implied fair value.
The DDM’s strength is also its limitation. Small changes in the discount rate or growth rate assumption produce dramatically different outputs.
Using a blended range of growth rates (2%-4%) and discount rates (6%-11%), the averaged DDM valuation comes to approximately $35.74. Using the grossed-up franked dividend of $2.44, the model produces $51.66. An adjusted dividend figure of $1.71 yields $36.16, broadly in line with the current share price.
The sensitivity grid below illustrates the range:
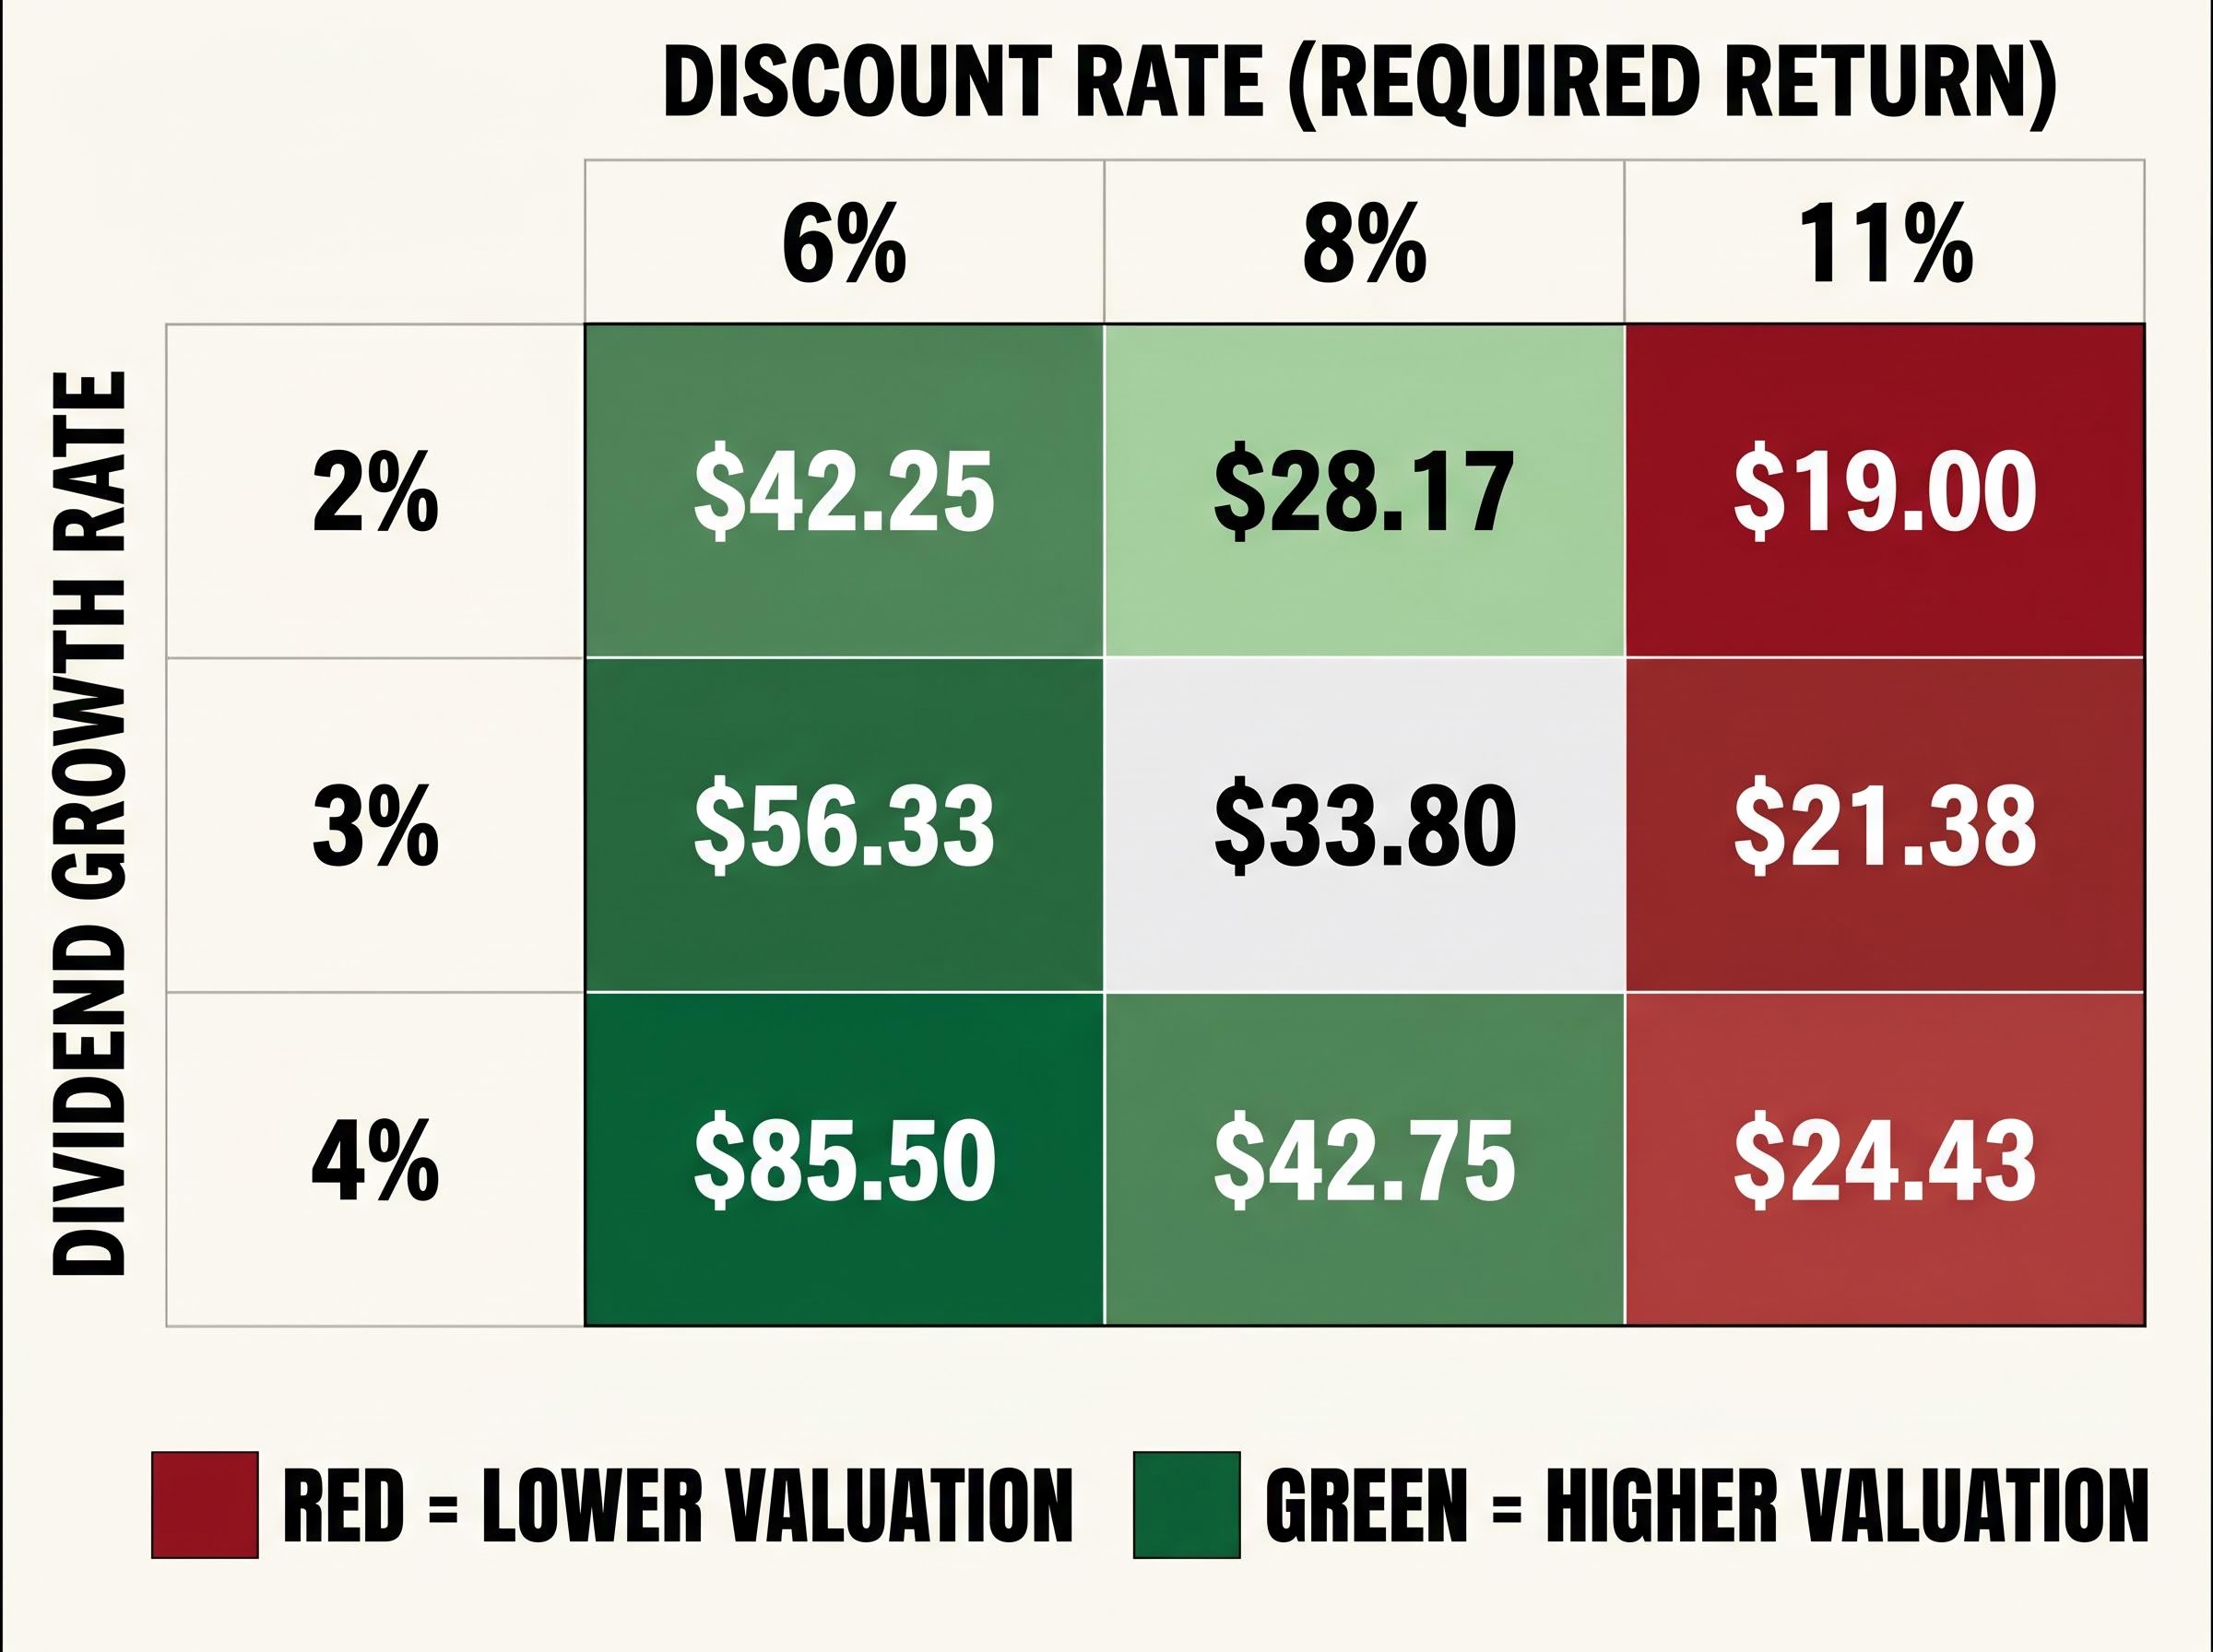
| Growth Rate / Discount Rate | 6% | 8% | 11% |
|---|---|---|---|
| 2% | $42.25 | $28.17 | $19.00 |
| 3% | $56.33 | $33.80 | $21.38 |
| 4% | $85.50 | $42.75 | $24.43 |
The extremes are instructive. At an 11% discount rate with 2% growth, NAB is worth $19.00. At a 6% discount rate with 4% growth, it is worth $85.50. Neither extreme is likely, but the spread forces explicit choices.
“At 4.35%, the RBA cash rate is now a material input to discount rate assumptions. DDM calibrations from the low-rate era need revisiting.”
The RBA raised the cash rate by 25 basis points on 4 February, 18 March, and 6 May 2026, bringing it to 4.35%. Each of those decisions pushed the appropriate discount rate higher. A DDM calibrated to the near-zero rate environment of 2020-2022 would materially overstate fair value today. The width of the range is not a failure of the model; it is the model forcing transparency about the assumptions that matter most.
Three consecutive rate hikes through February, March, and May 2026 were supported by eight of nine Board members at the final meeting, a near-unanimous margin that reflects the persistence of trimmed mean inflation at 3.3%, well above the RBA’s 2-3% target band.
Both models accept their inputs as given. Neither interrogates whether those inputs are about to change. Three macro variables deserve attention because each one feeds directly into the earnings, dividends, or discount rates the models depend on:
NAB’s significant small-to-medium enterprise (SME) and business banking book means credit losses may prove more sensitive to unemployment and rate fatigue in the SME sector than for a purely mortgage-focused peer. Provision levels remain benign by historical standards, but a normalisation of bad debts from the unusually low levels of 2021-2023 represents a credible downside scenario heading into the second half of 2026. NAB’s CET1 ratio of 11.65% provides a buffer against provisioning stress and surplus capital context for ongoing buybacks, but it does not eliminate the risk that forward earnings fall below the trailing figures both models rely on.
APRA capital adequacy standards set the minimum CET1 ratio at 4.5% with an additional capital conservation buffer, meaning NAB’s reported 11.65% CET1 ratio sits well above the regulatory floor and provides measurable headroom for maintaining the current dividend payout.
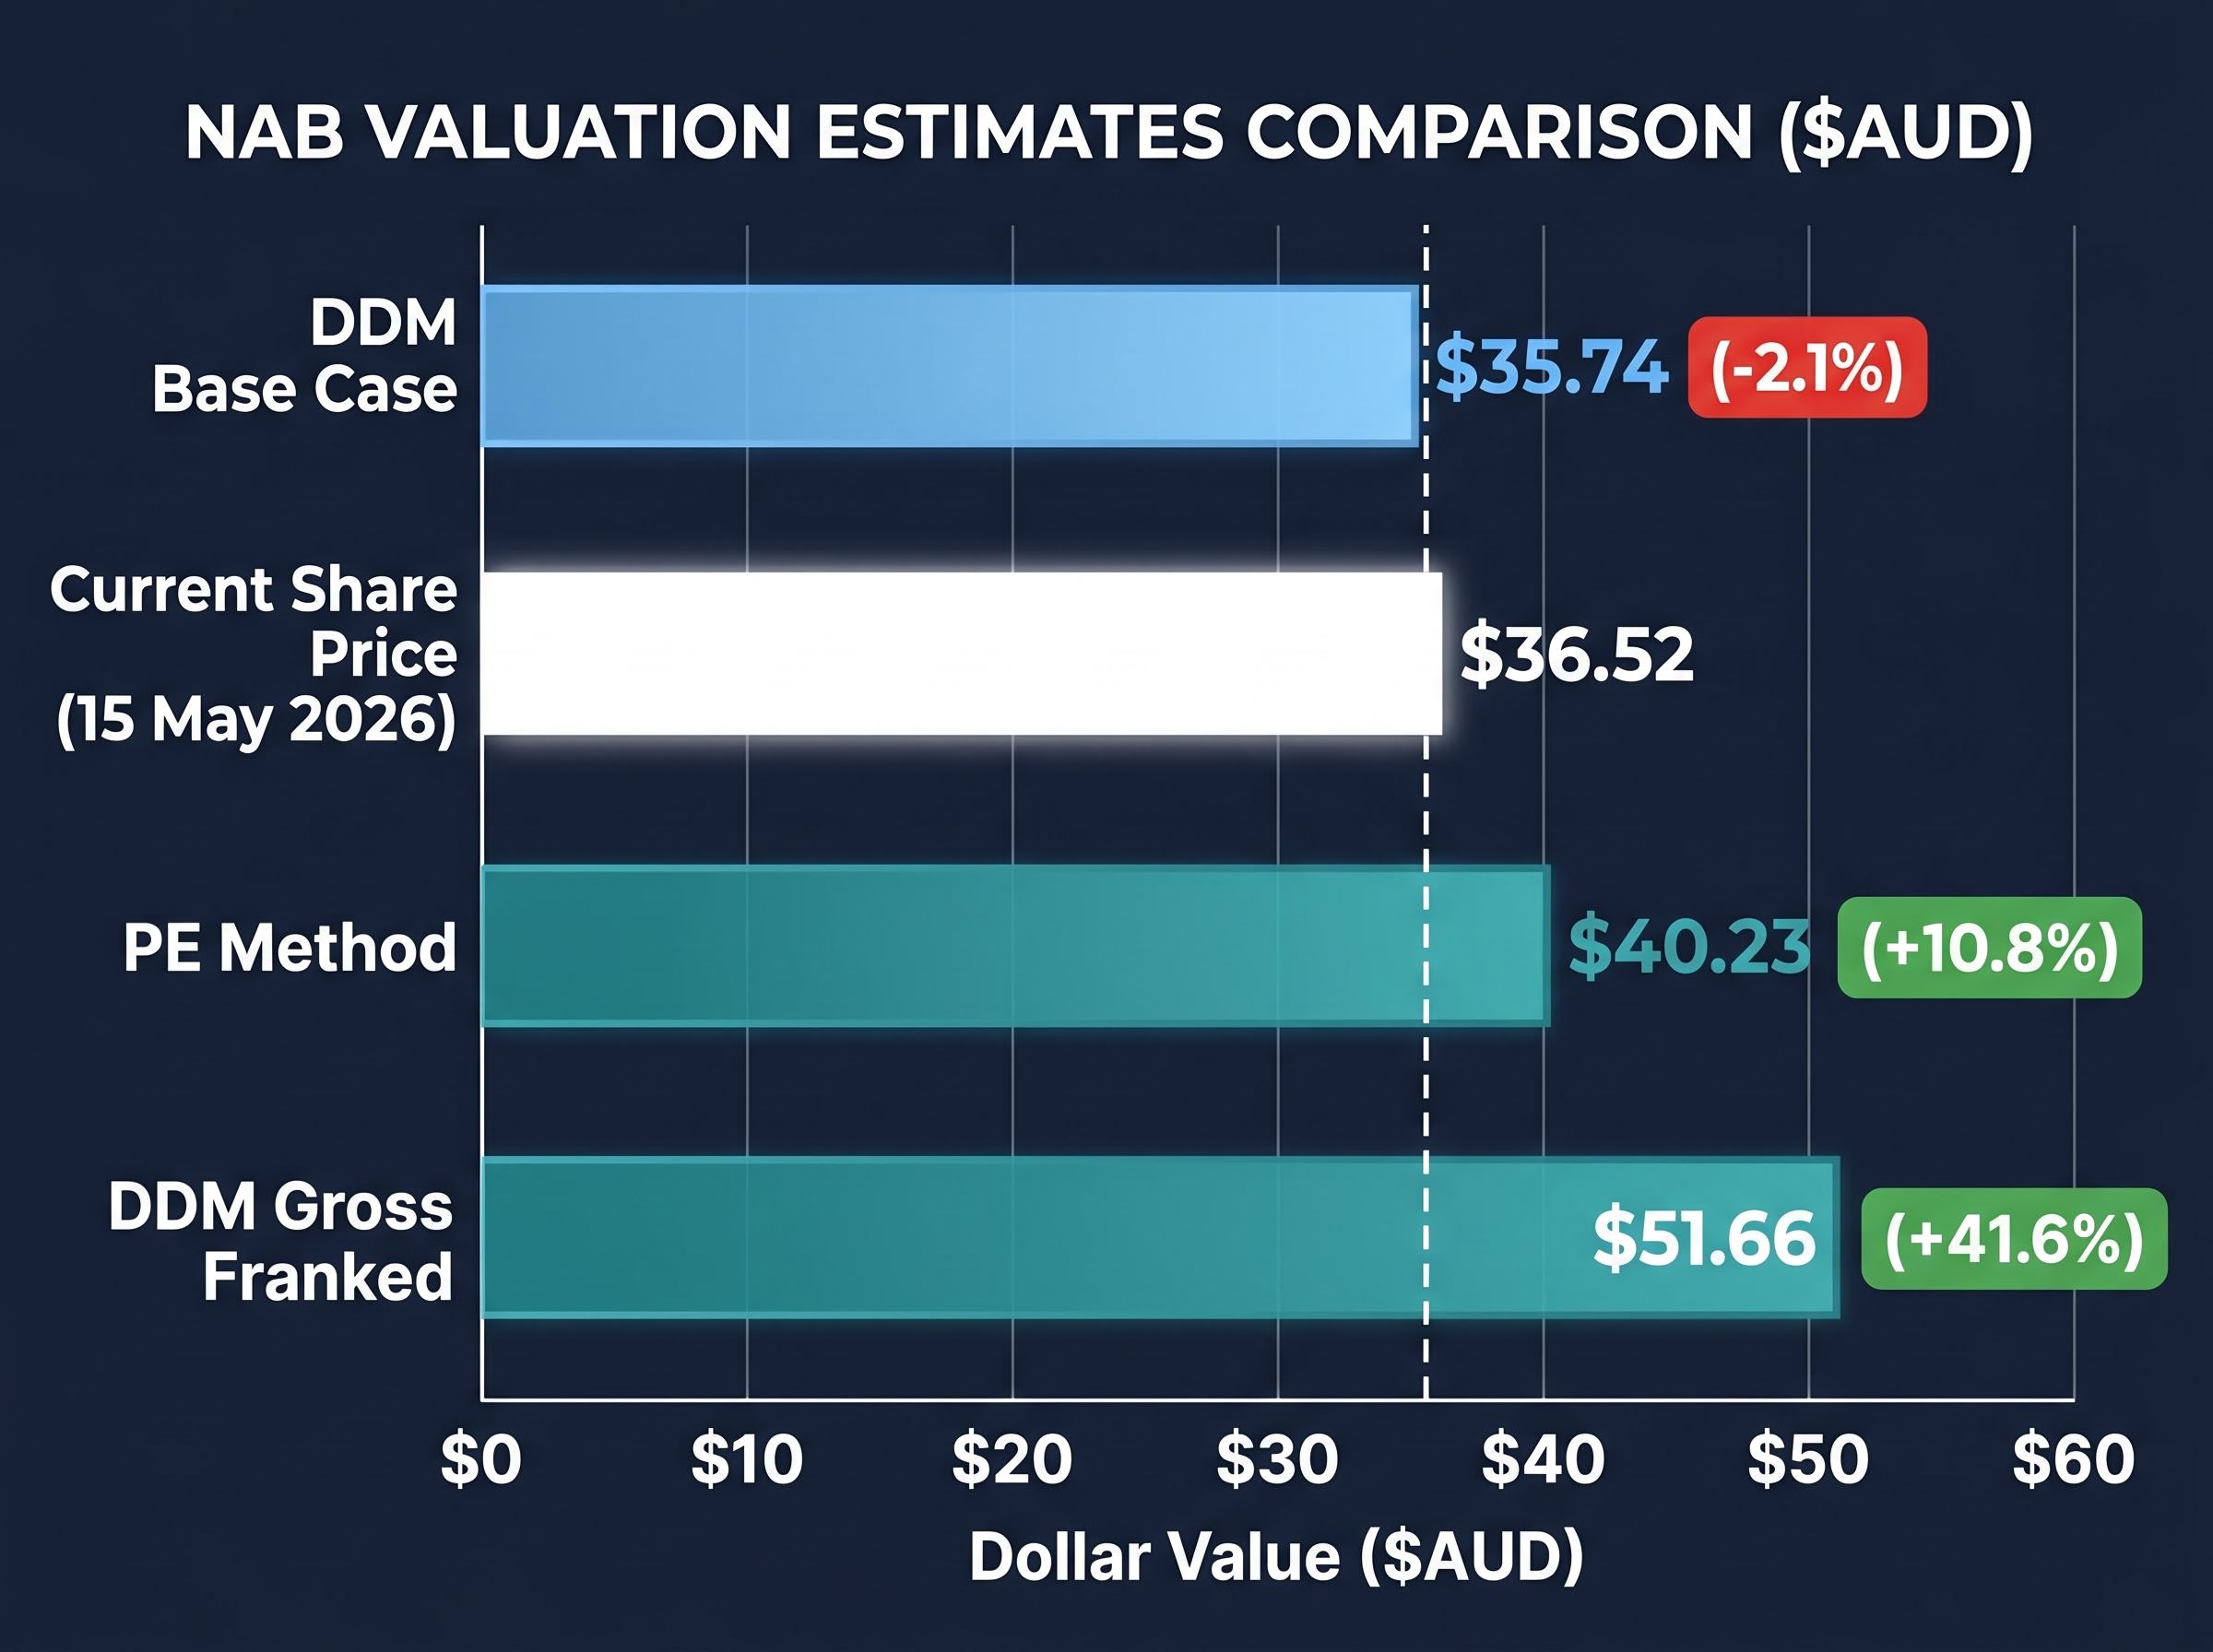
| Method | Implied Value | Premium / Discount to $36.52 |
|---|---|---|
| PE method | $40.23 | +10.8% |
| DDM base case | $35.74 | -2.1% |
| DDM gross franked | $51.66 | +41.6% |
The PE analysis implies modest upside. The DDM base case suggests the current price is broadly in line with fair value. The franking-adjusted DDM implies material upside, but only if the growth and discount rate assumptions behind it hold under scrutiny.
Taken together, the range places NAB near or at the lower bound of reasonable fair value estimates. For income investors specifically, the fully franked yield at current prices represents the primary investment thesis. Capital growth depends on earnings not deteriorating from here.
Grossed-up yield comparisons across the Big Four sharpen the income argument: ANZ’s confirmed raw yield of 4.58% grosses up to approximately 5.95%, while CBA’s grossed-up yield of approximately 4.10% currently matches the RBA cash rate, illustrating why NAB’s fully franked yield at $36 represents a more competitive income proposition than the raw dividend figures alone suggest.
For the more optimistic DDM estimate of $51.66 to be valid, dividend growth would need to sustain at least 3-4% annually while the appropriate discount rate remains moderate, a combination that three consecutive rate hikes make harder to defend. For the current price to prove expensive, earnings would need to fall materially as NIMs compress and provisions normalise, a scenario that the macro backdrop makes plausible though not yet evident in reported results.
“Both models place NAB somewhere between ‘fairly priced’ and ‘modestly undervalued’ at $36. The distance between those conclusions depends almost entirely on which dividend and discount rate assumptions you are prepared to defend.”
PE and DDM outputs are analytical anchors, not buy or sell signals. The wide DDM sensitivity range is itself the most instructive output of this exercise, because it reveals which assumptions carry the most weight.
Three inputs matter most for updating any NAB valuation from here: future RBA decisions, which directly affect the appropriate discount rate; NAB’s next full-year results, which will reveal whether trailing EPS remains a reliable baseline or is beginning to normalise lower; and any shift in SME credit quality trends, which would alter both the earnings and dividend trajectories both models depend on.
Investors who have worked through both methods with real NAB data are now equipped to reassess their position as conditions change, rather than reacting to price movements alone.
For investors wanting to layer additional frameworks on top of PE and DDM outputs, our full explainer on ASX bank valuation methods covers price-to-book ratios, DCF approaches, and the qualitative checks on management, APRA capital requirements, and loan book quality that quantitative models cannot capture on their own.
This article is for informational purposes only and should not be considered financial advice. Investors should conduct their own research and consult with financial professionals before making investment decisions. Past performance does not guarantee future results. Financial projections are subject to market conditions and various risk factors.
The Dividend Discount Model (DDM) estimates a share's fair value by calculating the present value of all future dividends. Applied to NAB, it produces a wide range of $35.74 to $51.66 depending on the discount rate and dividend growth assumptions used, reflecting how sensitive the model is to small input changes.
Franking credits represent tax already paid by NAB at the corporate level, which eligible Australian resident investors can use to offset their own tax liability. NAB's $1.69 cash dividend grosses up to $2.44 once franking credits are included, materially changing the DDM's implied fair value compared to using the raw cash figure alone.
NAB's implied PE ratio based on its $36.52 share price and FY24 EPS of $2.26 is 16.1x, below the banking sector average of 18x. Applying the sector average PE to NAB's EPS produces a sector-adjusted price estimate of $40.23, approximately 10.8% above the current share price.
The RBA raised the cash rate three times in 2026 to reach 4.35%, which directly increases the appropriate discount rate used in DDM calculations. Higher discount rates reduce the present value of future dividends, meaning DDM valuations calibrated to the low-rate era of 2020-2022 would materially overstate NAB's fair value today.
The key risks include net interest margin compression as deposit competition intensifies, a normalisation of bad debts from historically low levels, and potential deterioration in SME credit quality if unemployment rises as rate hikes feed through the economy. Any of these factors would reduce the trailing EPS and dividend figures that both the PE and DDM methods rely on.