
The Memo That Halved Meta’s AI Infrastructure Cost Estimate
4 hrs ago

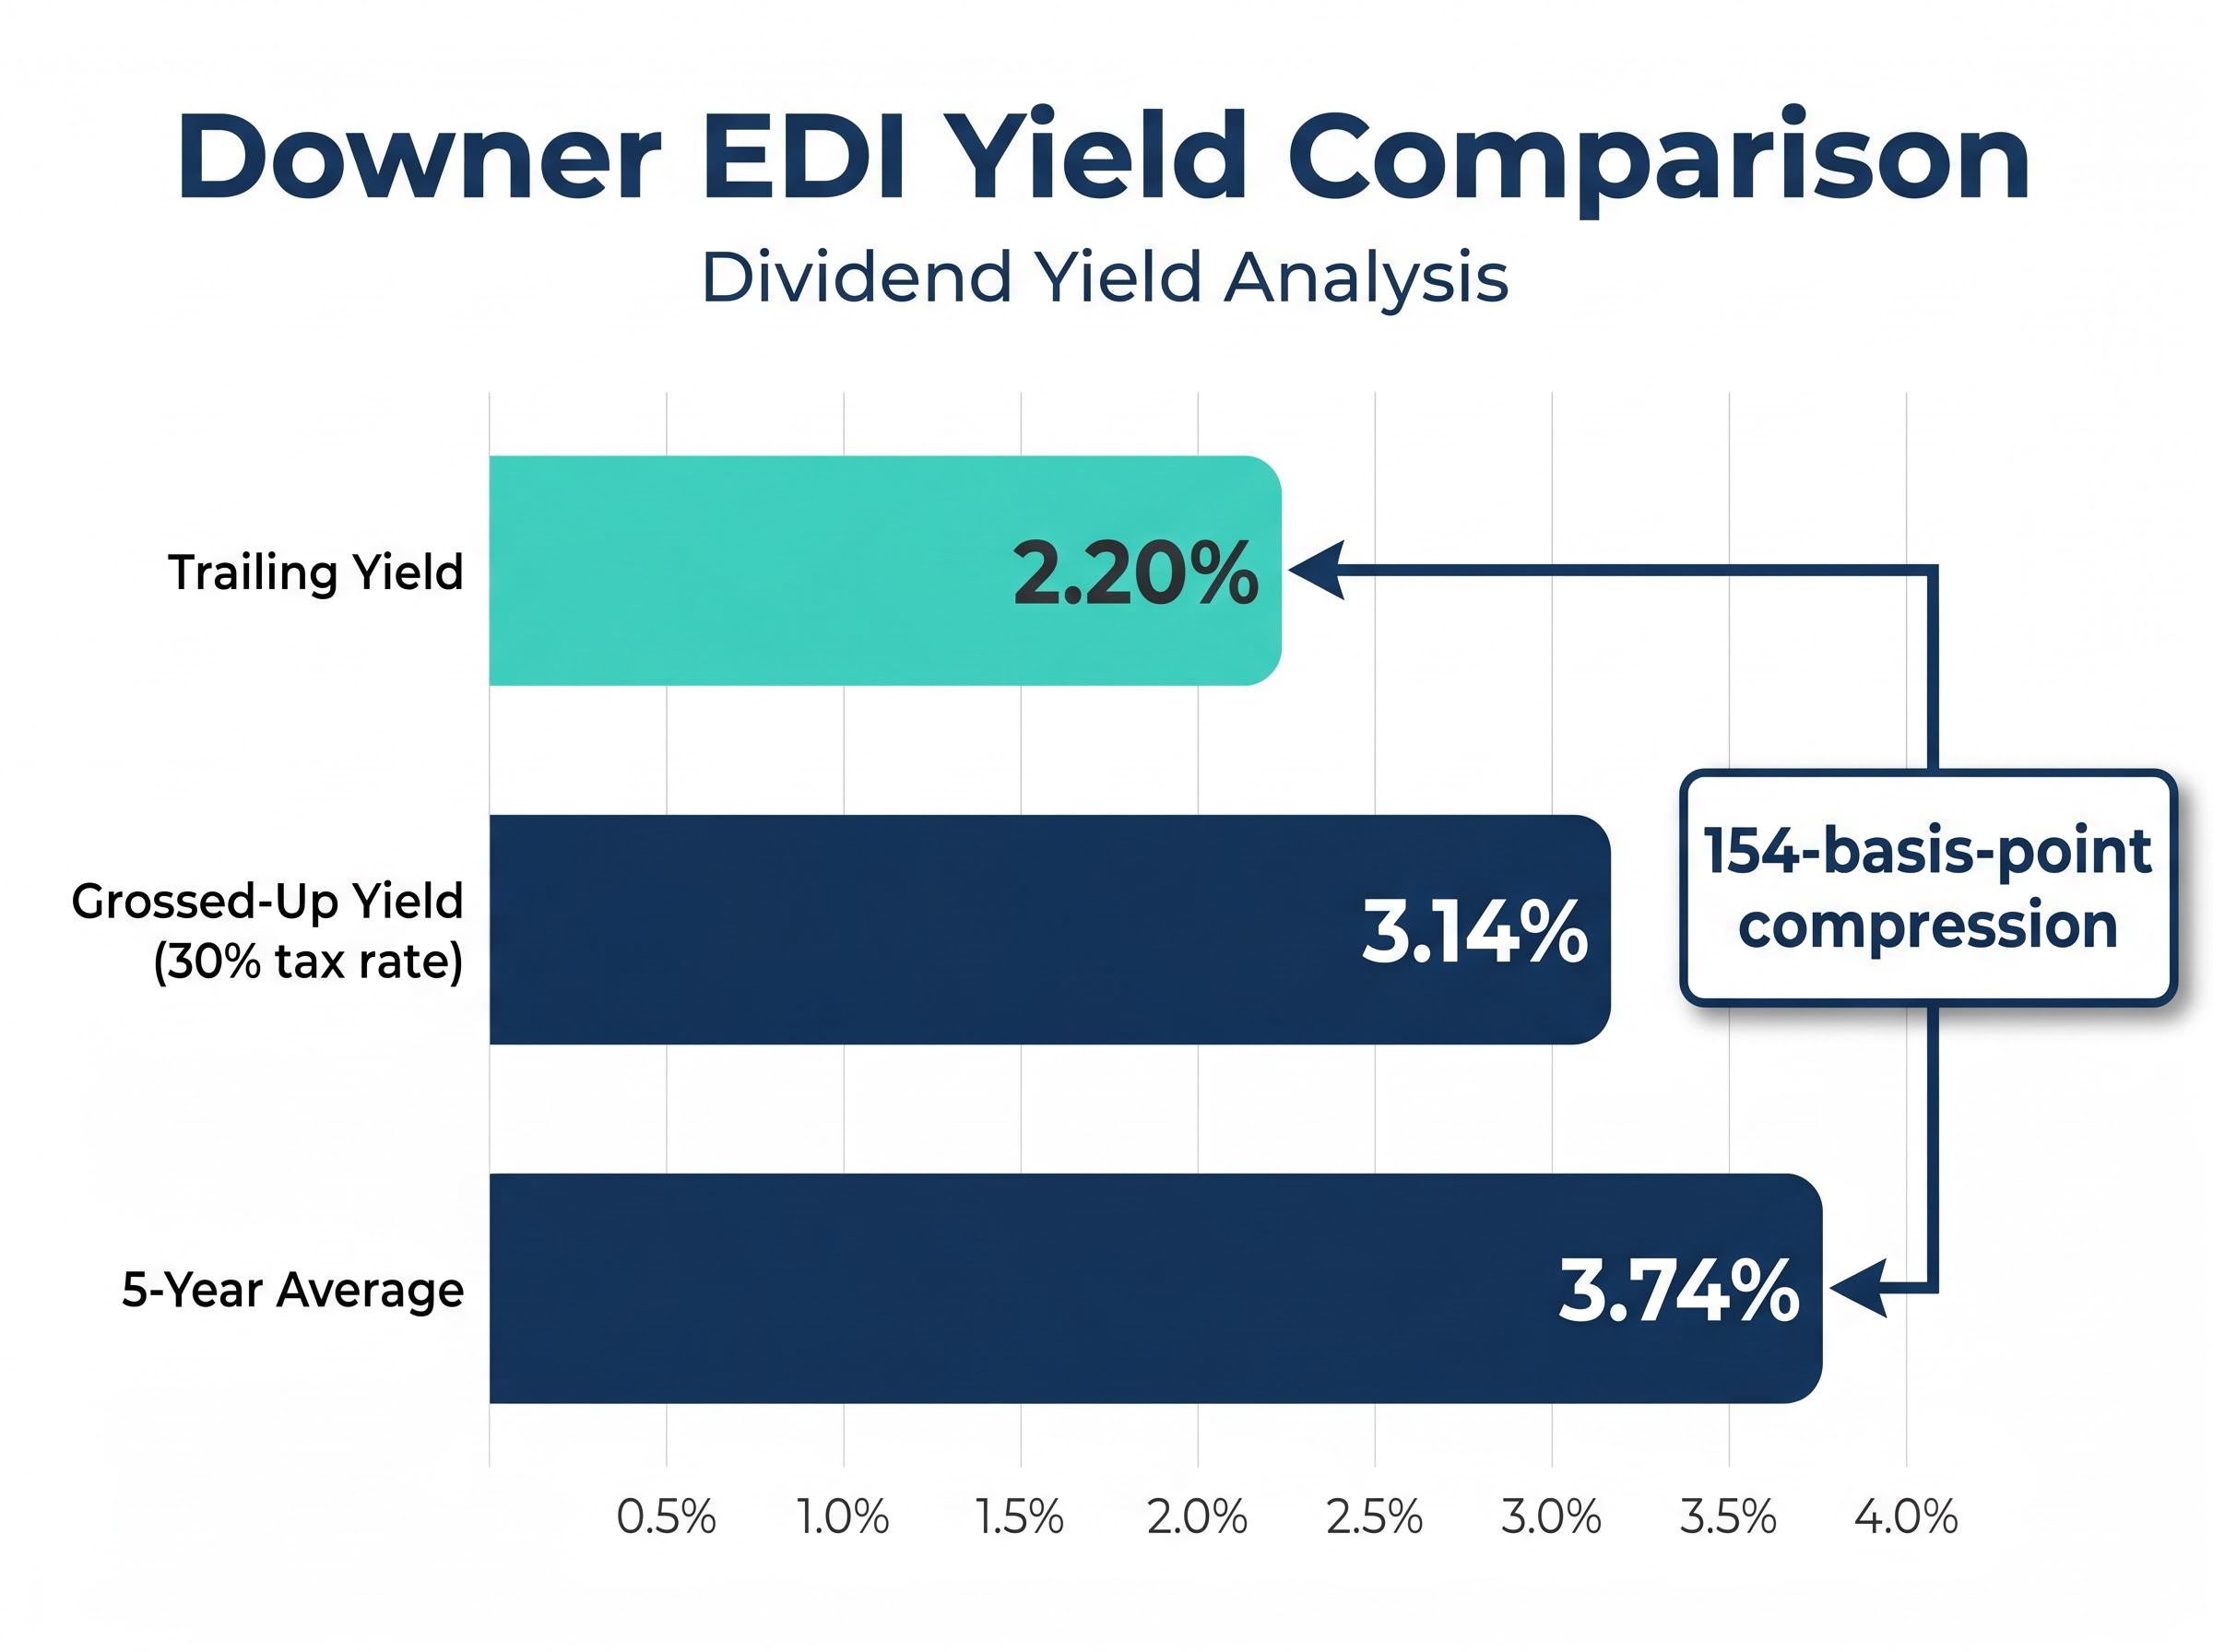
Downer EDI’s trailing dividend yield sits at 2.20% today, against a five-year average of 3.74%. That 154-basis-point compression is not noise. For income-focused investors in ASX blue chips, it raises a question worth answering carefully: has the market repriced a genuinely better business, or has the stock simply run ahead of its fundamentals?
Dividend yield compression in mature infrastructure and services stocks is one of the most common valuation signals Australian investors encounter, yet it is routinely either over-interpreted as automatic over-valuation or dismissed as irrelevant to a growing business. Downer EDI, Australia and New Zealand’s leading integrated infrastructure services provider, offers a timely case study because the compression coincides with a genuine operational turnaround, not just share price drift.
This analysis unpacks what Downer’s compressed yield actually signals, how to use dividend yield as one lens within a broader valuation framework, and what income-focused investors on the ASX should weigh before drawing conclusions.
Most Australians interact with Downer EDI’s work without knowing it. The company operates Yarra Trams in Melbourne, produces passenger rail rolling stock across multiple states, maintains power distribution networks, and manages government facilities from defence bases to hospitals. Its services are everywhere; its brand recognition, among retail investors at least, is not.
Downer operates across three core service segments:
The nature of this work matters for valuation. Downer’s revenue base is anchored in long-term government and essential-services contracts, the kind of commitments that are structurally difficult to cancel. Yarra Trams, state rail maintenance programmes, defence facility operations: these are not discretionary spending items.
That contract base is growing. As at the 1H FY26 results announcement on 19 February 2026, work-in-hand stood at $38.2 billion, up 8.9% on the prior period. The share price of approximately A$7.62-$7.64 in mid-May 2026 places DOW roughly 29.3% above its 52-week low, reflecting a market that has steadily re-rated the stock as the operational turnaround has taken shape.
The Facilities segment contract pipeline has been a key driver of work-in-hand growth, with the $500 million Stockland integrated facilities management partnership announced in March 2026 adding approximately $100 million in annual recurring revenue and a potential decade of visibility if extension options are exercised.
Downer’s trailing yield of 2.20% sits 154 basis points below its five-year average of 3.74%, a compression that demands a specific explanation.
Dividend yield compression occurs when a stock’s current yield falls materially below its long-run average. Mechanically, this happens for one of two reasons: the share price has risen faster than dividends, or dividends have been cut relative to history. In Downer’s case, dividends are growing. The most recent interim dividend of 12.9 cents per share, fully franked, announced on 19 February 2026, represented a 19% increase on the prior corresponding period. The compression is price-driven.
Two competing interpretations apply. The first: the market has re-rated the business upward because earnings quality has improved, and the lower yield reflects a permanently higher valuation baseline. The second: the stock has become expensive relative to its income-generating history, and the yield will eventually revert toward its long-run average, either through price correction or accelerating dividend growth.
| Metric | Current / Most Recent | Historical Comparison |
|---|---|---|
| Trailing Dividend Yield | 2.20% | 3.74% (5-year average) |
| Interim DPS (1H FY26) | 12.9 cents, fully franked | 10.8 cents (1H FY25) |
Distinguishing between these two readings requires examining the operational evidence behind the re-rating, and understanding how yield functions as a valuation tool in the first place.
For a business with stable, predictable dividends, the market’s long-run yield tolerance reflects a collective view of risk and growth expectations. When a stock consistently trades at a yield of 3.5-4.0% for years and then compresses to 2.2%, the market is either pricing in lower risk, higher growth, or both. This makes the historical yield average a useful mean-reversion reference, a benchmark against which the current price can be tested.
Yield-based valuation works best for mature, low-growth businesses with consistent payout policies. It is the most accessible starting point for retail investors evaluating ASX blue chips because the inputs are straightforward: share price and dividends per share. Before drawing conclusions from a yield signal, four inputs need checking:
Franking credit mechanics eliminate the double-taxation of corporate dividends by passing corporate tax already paid at the company level through to shareholders as a direct offset against personal tax liability, which is why fully franked dividends carry materially more value than their headline cash figure for most Australian resident investors.
Discounted Cash Flow (DCF) analysis, which estimates a company’s value based on projected future cash flows discounted back to present value, is more appropriate when terminal value and growth assumptions drive the investment case. The Dividend Discount Model (DDM), which values a stock as the sum of all future dividend payments discounted to today, suits businesses with stable, predictable dividend streams.
For a turnaround like Downer, DCF carries higher model risk because margin assumptions are still in flux. Full-year FY26 NPATA guidance of $295 million-$315 million provides a range, not a certainty. That makes yield-relative-to-history a useful cross-check: it does not require forecasting specific margin outcomes, only comparing the market’s current pricing against its own historical norms.
The operational evidence behind Downer’s re-rating is substantial. Over several years, management has exited capital-intensive mining and construction contracts and pivoted toward recurring urban services, transport, utilities, and facilities management. The financial results reflect that shift.
| Metric | 1H FY26 Result | Significance |
|---|---|---|
| EBITA Margin | 4.6% | Highest in over a decade; above 4.5% target |
| Net Debt/EBITDA | 0.8x | Strong balance sheet; well below 1x |
| Work-in-Hand | $38.2 billion | Up 8.9%, driven by Energy & Utilities and Facilities |
| Free Cash Flow | $105 million | Normalised cash conversion above 90% |
An EBITA margin of 4.6% represents Downer’s strongest half-year margin performance in more than a decade.
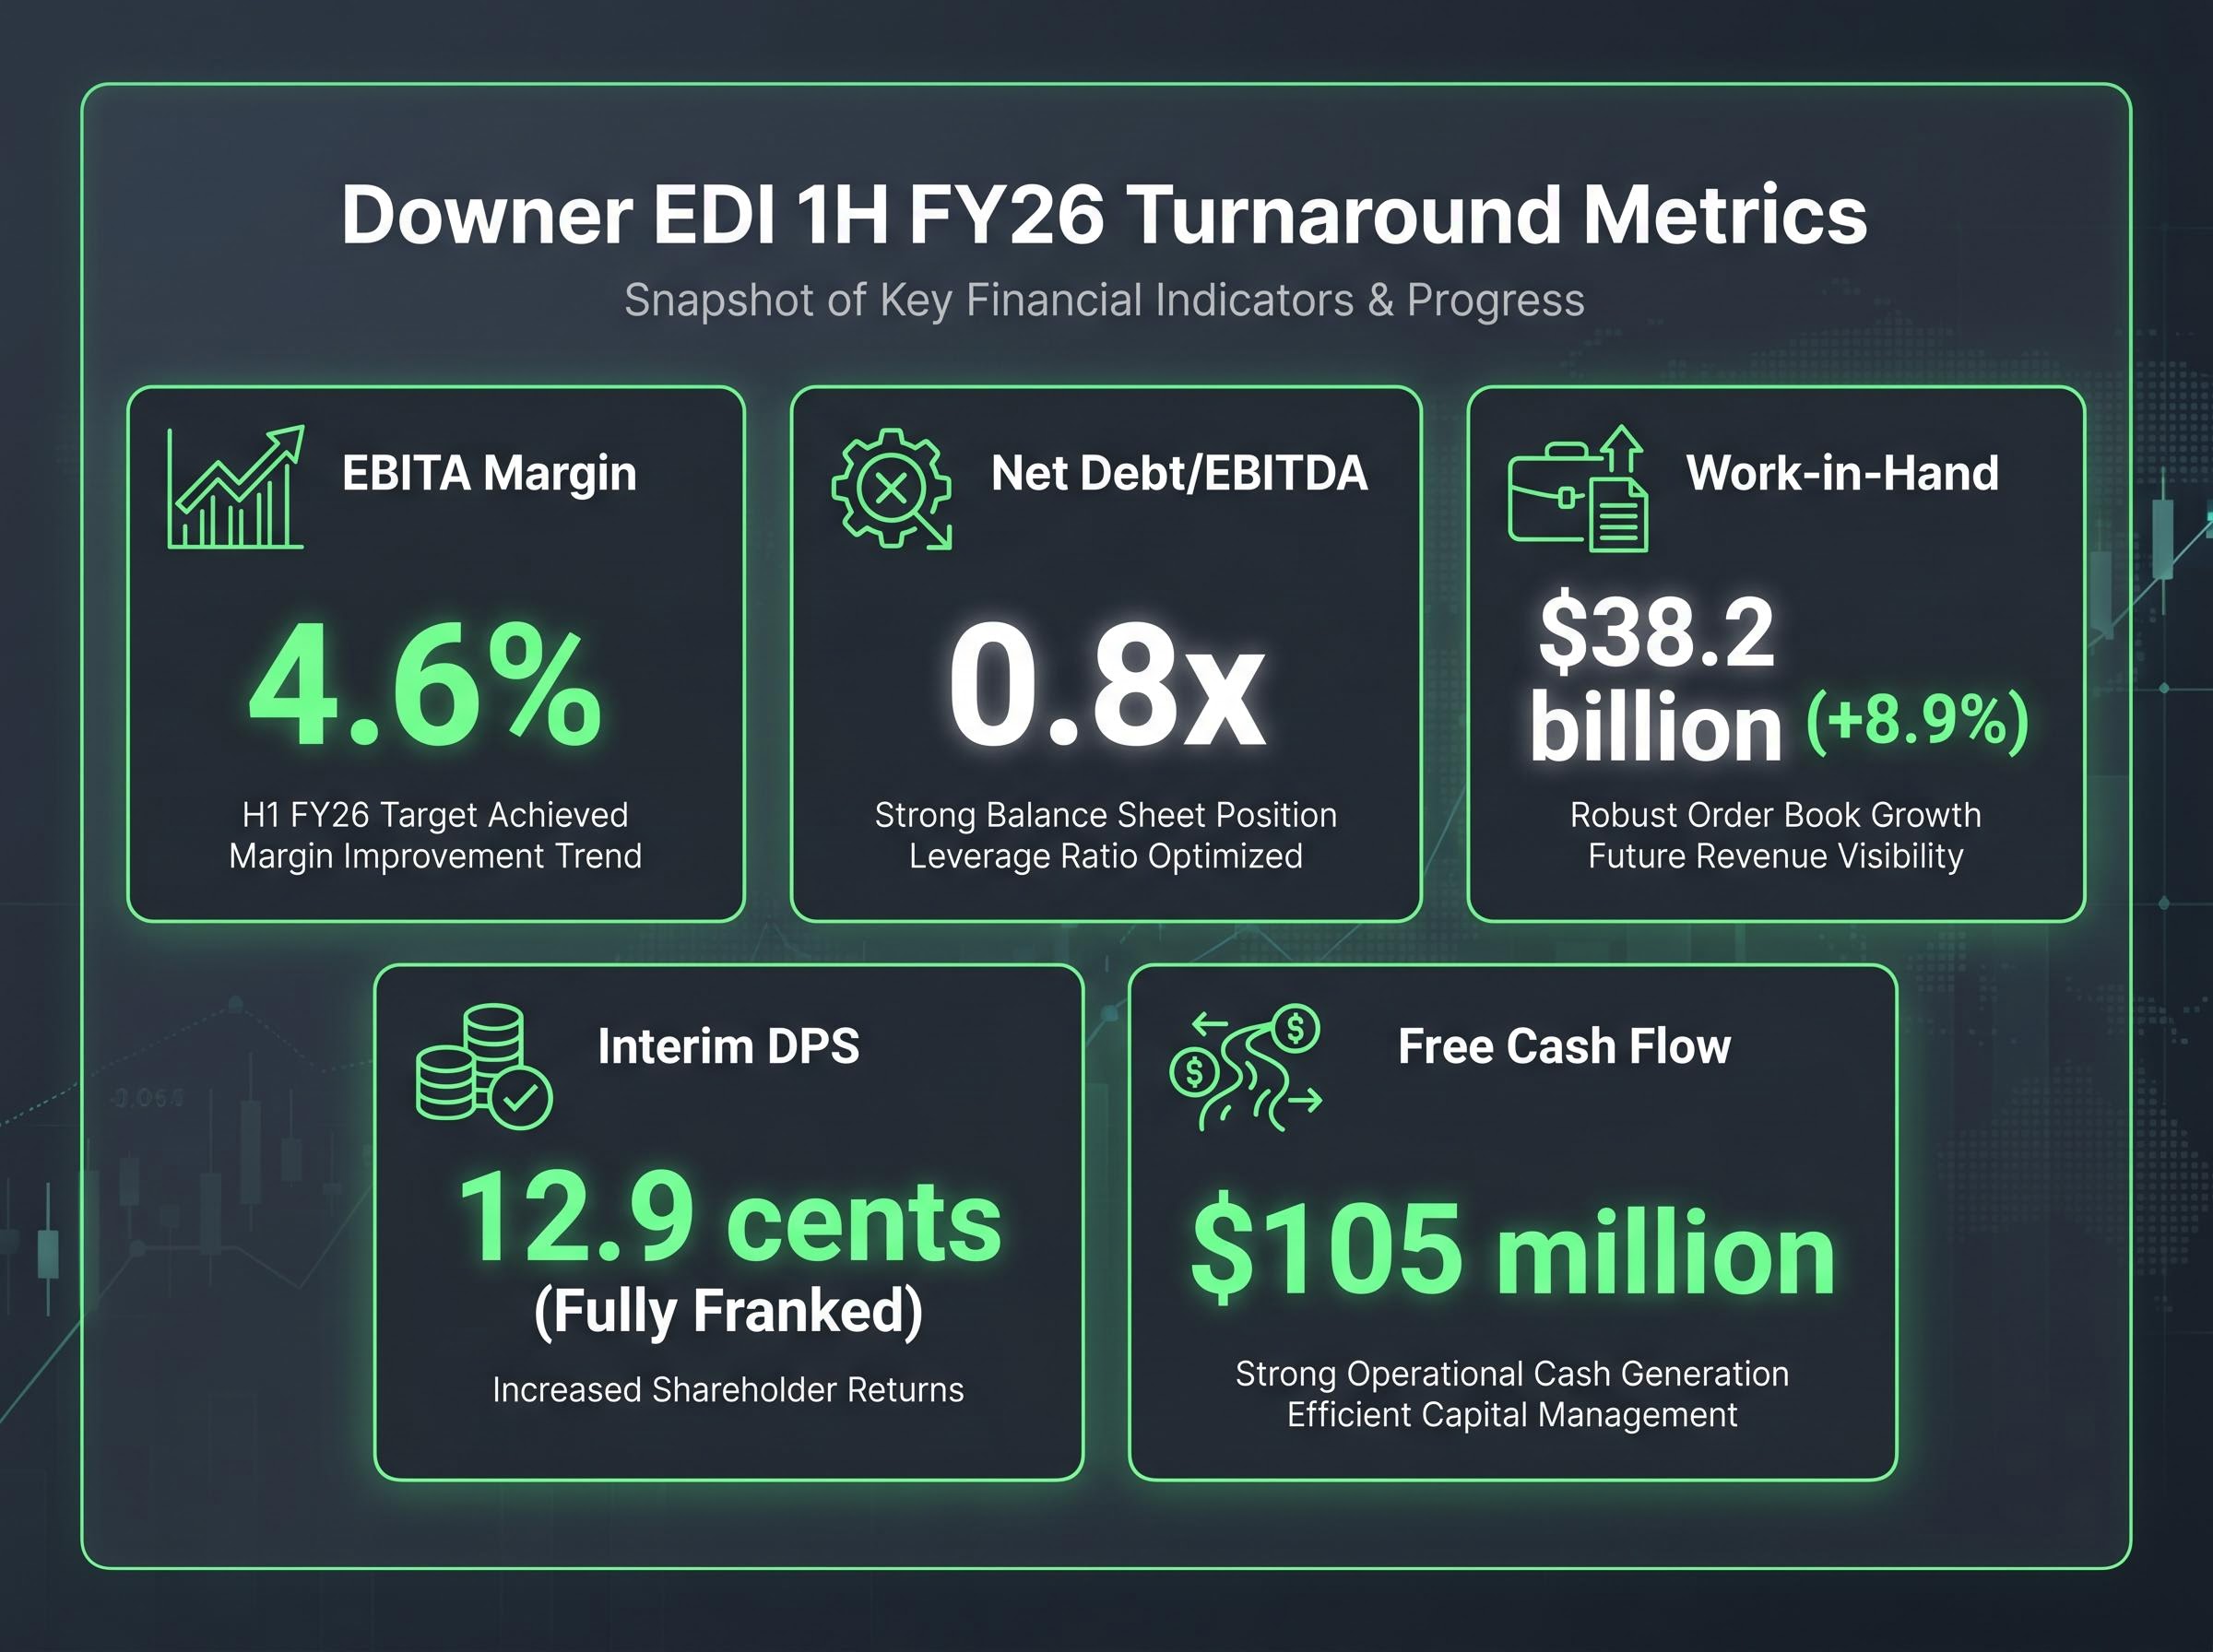
The balance sheet tells a complementary story. Net debt/EBITDA of 0.8x gave management enough confidence to announce an on-market share buyback of up to 5% of issued capital on 19 February 2026, a signal that the board considers the stock undervalued even at current prices.
The counter-tension is real, however. FY26 guidance implies slightly lower revenue than FY25, meaning earnings growth must come from margin expansion and cost control rather than top-line acceleration. The market is pricing in execution on that margin story. If revenue declines exceed expectations and margins do not compensate, the yield compression would look less justified in retrospect.
A fuller Downer EDI valuation analysis places those margin gains in a broader context: net profit margins remain thin at approximately 1.59% and return on equity of around 7.8-9.26% still falls below the 10% threshold typically associated with blue-chip industrials, a tension that broker consensus pricing at around A$8.18 does not fully resolve.
Yield compression is a signal, not a verdict. The market’s re-rating may prove correct, partially correct, or premature, and yield analysis alone cannot distinguish between these outcomes.
Three specific risk factors warrant monitoring:
Brokers have described Downer’s margin targets as “ambitious but increasingly credible,” a characterisation that captures both the progress and the residual uncertainty.
One factor often overlooked by retail investors comparing ASX and international income options is the impact of franking credits. Downer’s fully franked dividends carry additional value for Australian taxpayers.
The ATO guidance on franking credits confirms that for eligible Australian resident shareholders, the imputation credit attached to a fully franked dividend offsets income tax liability and can generate a refund where the credit exceeds the tax otherwise payable, a mechanism that materially increases the effective income return relative to the headline yield figure.
For an investor on a 30% marginal tax rate, a 2.20% fully franked yield grosses up to approximately 3.14% once the franking credit (calculated at the 30% corporate tax rate) is included. That narrows the gap with the 3.74% five-year average considerably.
This grossed-up yield does not eliminate the valuation question, but it does change the income comparison materially for domestic investors in higher tax brackets.
The grossed-up yield calculation changes materially depending on the investor’s tax rate and entity structure: an SMSF in pension phase faces a 0% tax rate and can claim the entire franking credit as a cash refund from the ATO, meaning the after-tax value of a fully franked dividend can exceed the face cash amount by more than 40% compared with a taxable investor’s outcome.
Downer’s 154-basis-point yield compression reflects a genuine operational re-rating. The margin recovery, balance sheet repair, and growing work-in-hand pipeline are real. The premium implied by that compression is only justified, however, if margin expansion and cash conversion hold through the second half of FY26 and into FY27. The NPATA guidance range of $295 million-$315 million is the near-term test.
The transferable principle is straightforward. When encountering yield compression in a mature, government-backed services business, investors should ask:
If the on-market buyback is fully executed, it would reduce share count and support future EPS and DPS growth, adding another variable to the forward picture.
Yield compression is a diagnostic starting point, not a buy or sell trigger. It identifies when a stock’s pricing has shifted relative to its own history. What it cannot do is tell the investor whether that shift is permanent.
This article is for informational purposes only and should not be considered financial advice. Investors should conduct their own research and consult with financial professionals before making investment decisions. Past performance does not guarantee future results. Financial projections are subject to market conditions and various risk factors.
Dividend yield compression occurs when a stock's current yield falls materially below its long-run average, either because the share price has risen faster than dividends or because dividends have been cut. For investors, it signals that the market has re-rated the stock upward, prompting the question of whether that re-rating reflects genuine business improvement or stretched valuation.
Dividend yield valuation compares a stock's current yield against its historical average to assess whether the market is pricing in lower risk, higher growth, or both. For mature, government-backed services businesses like Downer EDI, the long-run yield average acts as a mean-reversion benchmark, helping investors identify when pricing has shifted relative to the stock's own history.
For an investor on a 30% marginal tax rate, Downer's 2.20% fully franked yield grosses up to approximately 3.14% once the franking credit is included, which narrows the gap with the five-year average of 3.74% considerably. Investors in an SMSF in pension phase face a 0% tax rate and can claim the entire franking credit as a cash refund, making the after-tax value even higher.
Downer reported an EBITA margin of 4.6% in 1H FY26, its highest in over a decade, alongside net debt/EBITDA of 0.8x, free cash flow of $105 million, and work-in-hand of $38.2 billion, up 8.9% on the prior period. Management also announced an on-market share buyback of up to 5% of issued capital, signalling board confidence in the stock's valuation.
Key risks include margin target execution, as revenue declines could pressure the earnings base supporting the dividend if margin expansion stalls; government contract renewal concentration, since Downer's revenue depends heavily on a small number of long-duration government clients; and the impact of the share buyback, which supports future earnings per share only if total earnings hold steady or grow.


