How the US Government Became Intel’s Investor and Deal Broker
5 mins ago
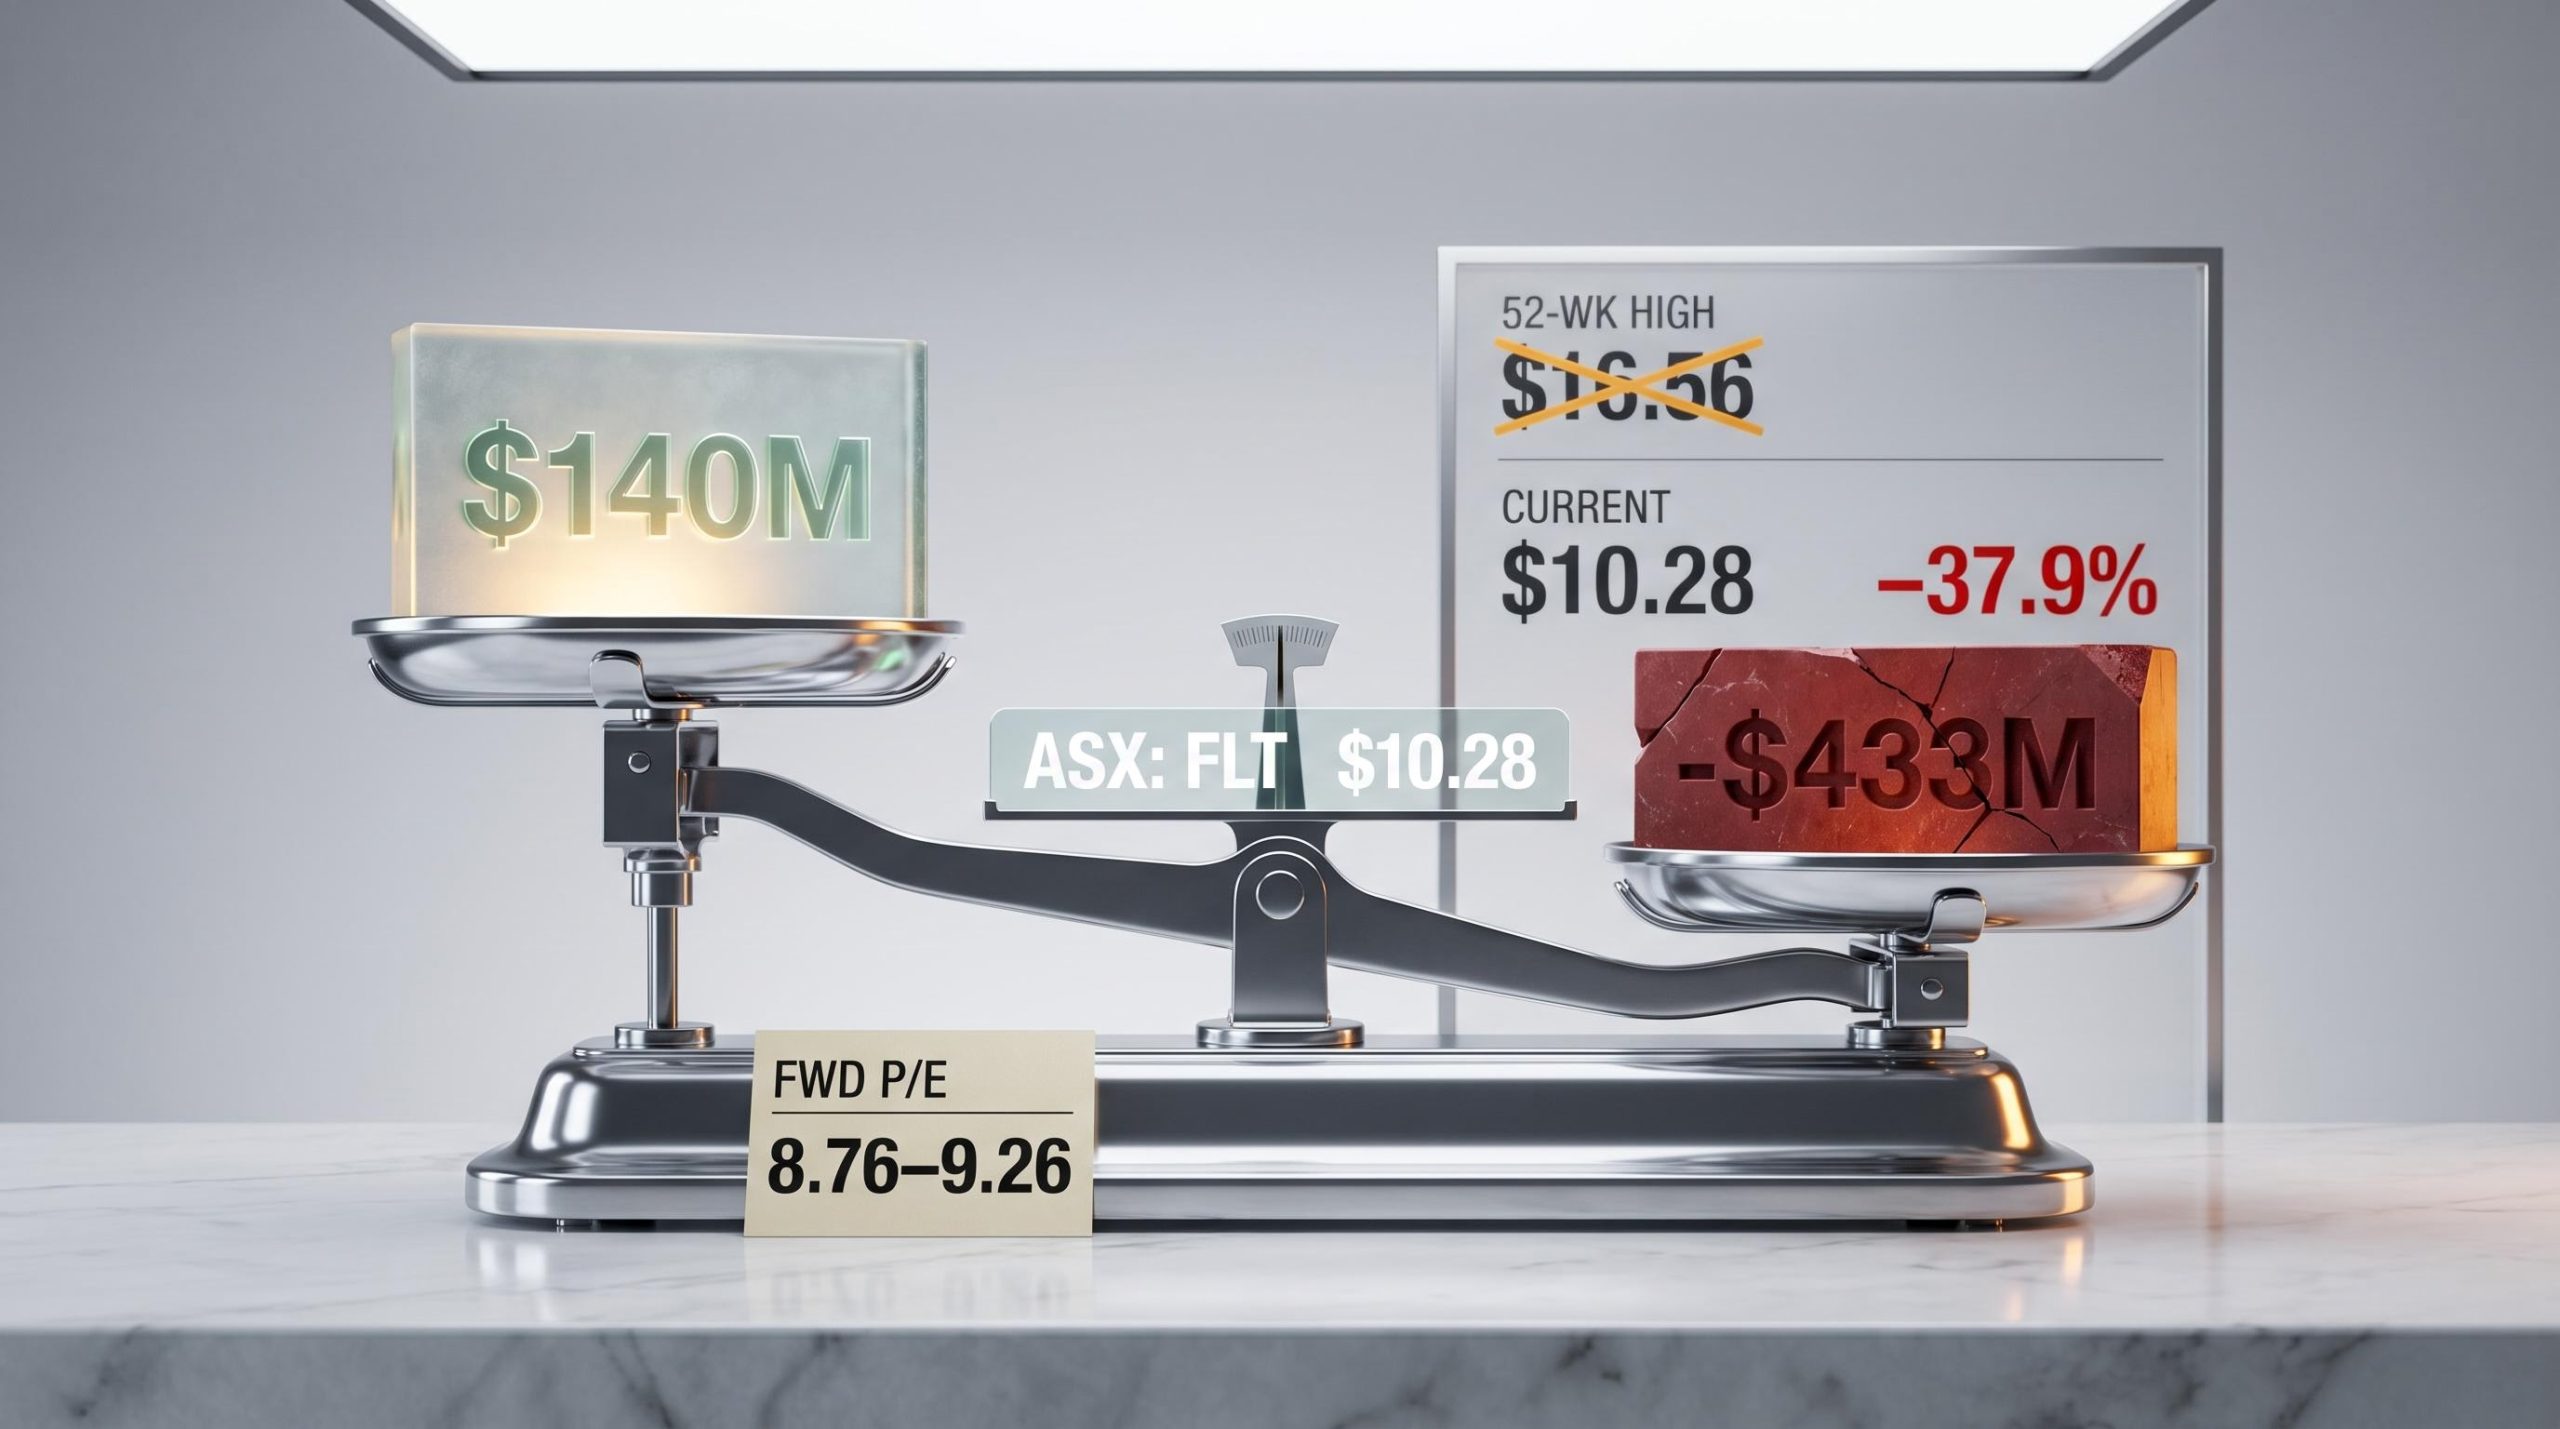
Flight Centre Travel Group (ASX: FLT) has shed 37.9% from its 52-week high, yet the underlying business has swung from a $433 million net loss to a $140 million profit in three years. That gap between price and fundamentals is precisely the tension this analysis unpacks. As of mid-May 2026, Flight Centre trades at approximately $10.28 on the ASX, carrying a forward P/E of roughly 8.76 to 9.26. For Australian investors scanning for recovery plays in the travel sector, that combination of compressed valuation and improving earnings trajectory is either a compelling entry point or a value trap signal. What follows works through the financial recovery case, the metrics that matter most for a growth-oriented travel company, the structural risks that explain the market’s hesitation, and what an investor would need to believe for FLT to be worth buying at current prices.
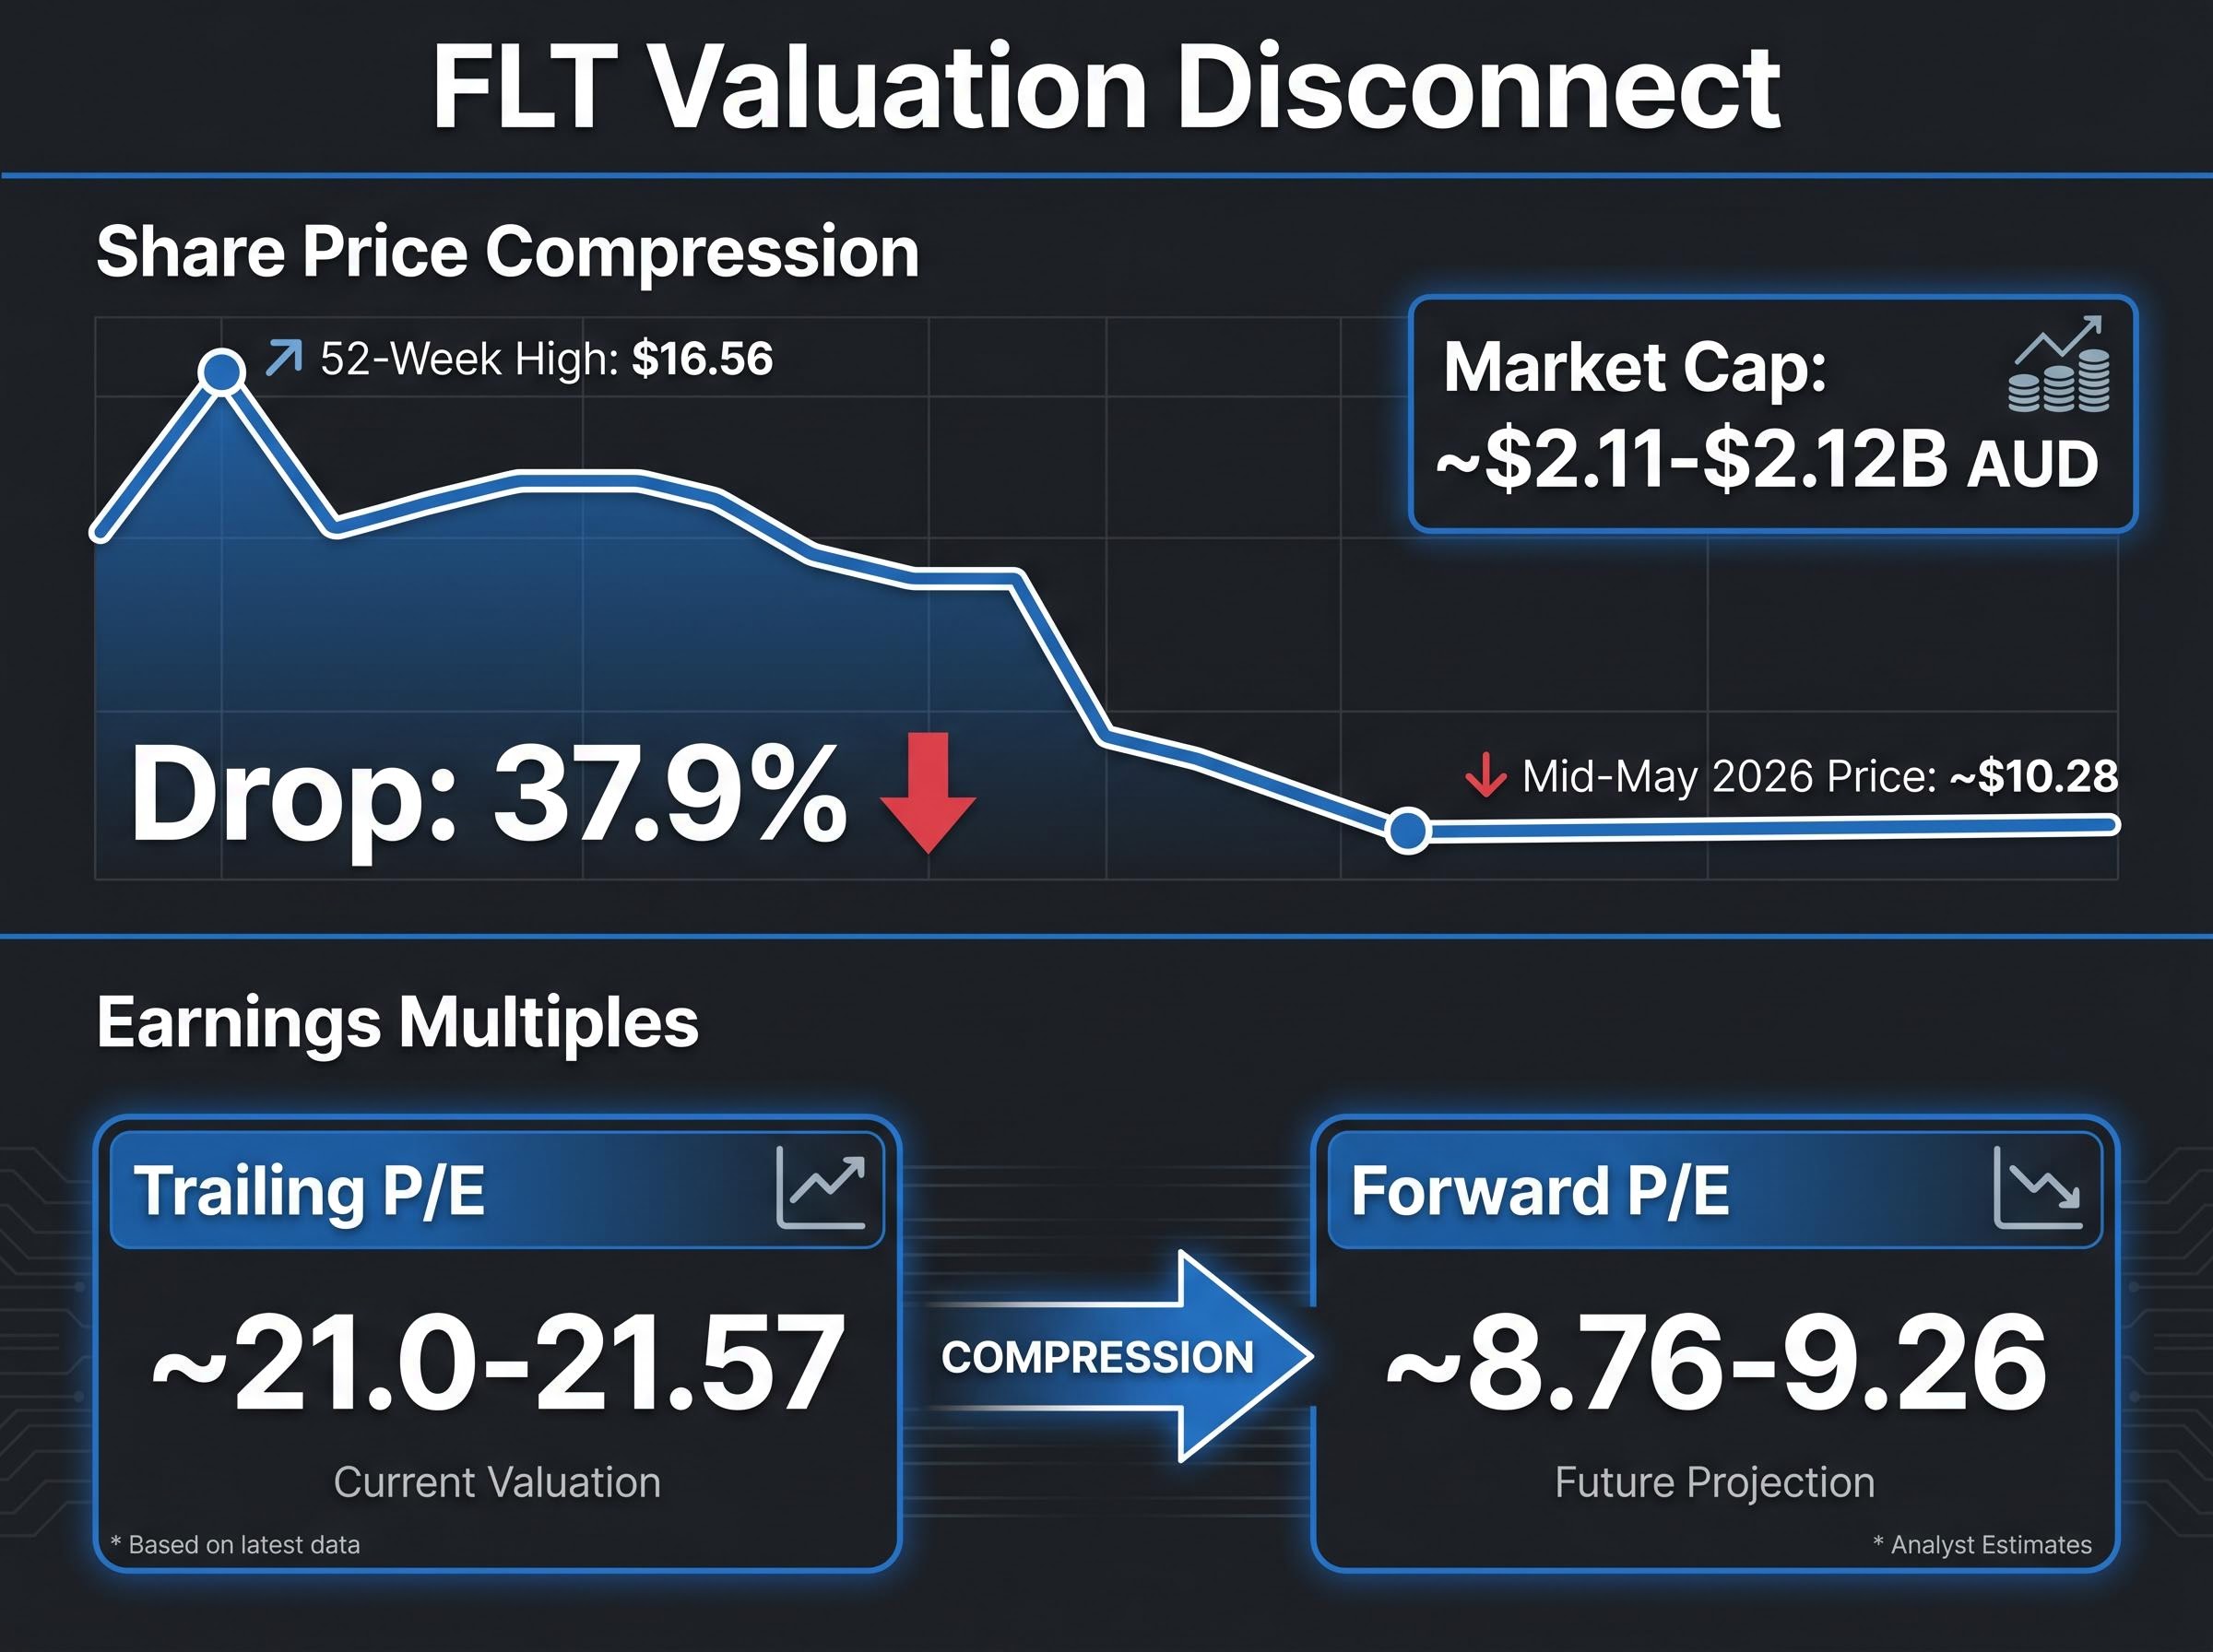
FLT closed at approximately $10.28 in mid-May 2026. That figure sits 37.9% below the $16.56 52-week high and gives the company a market capitalisation of roughly $2.11 to $2.12 billion AUD. Earlier 2024 media references to a $4 billion market cap are now materially outdated.
A discount from a 52-week high is not, on its own, meaningful. Plenty of stocks trade below recent peaks for entirely rational reasons. What makes FLT’s gap worth interrogating is the pairing: the share price has compressed while the business has been reporting improving fundamentals.
The trailing P/E sits at approximately 21.0 to 21.57, while the forward P/E compresses to roughly 8.76 to 9.26 on FY26/FY27 forecasts. That spread implies the market expects meaningful earnings growth but assigns significant risk to whether that growth materialises.
The analytical question is straightforward. Does the market’s reluctance to re-rate FLT reflect rational pricing of structural risk, or does it represent an overshoot that informed investors can exploit? The rest of this analysis provides the data to form a view.
A multi-method valuation framework applied to FLT specifically, covering P/S, P/E, DCF, and DDM with worked scenarios, reveals that a 1-2 percentage point shift in net margin assumptions moves the DCF output by $5-8 per share, which explains why four analysts using similar inputs can arrive at fair value estimates ranging from $12.60 to $25.41.
Misreading FLT starts with applying the wrong valuation framework. This is a growth-oriented business, not a mature blue-chip. Dividend yield and debt-to-equity ratios are secondary metrics here. Revenue trajectory, profit swing, and return on equity trend carry the analytical weight.
Founded in Sydney in 1982, Flight Centre now operates globally across multiple brands. Its consultant-led, personalised service model generates loyalty and repeat business, but it also creates a structurally higher cost base than pure online travel agencies like Booking.com or Expedia. That trade-off, service quality against cost efficiency, is the permanent tension in FLT’s business model.
For investors assessing FLT as a potential investment, three metrics deserve primary focus:
FLT operates across two distinct segments. The leisure division faces structural pressure from online travel agencies as consumers grow more comfortable arranging complex itineraries independently. The corporate division, operated through FCM and Corporate Traveller, carries structurally higher margins and more recurring revenue characteristics.
Corporate total transaction value (TTV), a measure of the total value of travel bookings processed, reached record levels in FY24. The internal split matters: corporate growth can partially offset leisure headwinds, but the ratio of that mix shift will shape the long-term thesis. An FLT where corporate increasingly dominates the revenue mix is a fundamentally different investment proposition from one still dependent on leisure storefronts.
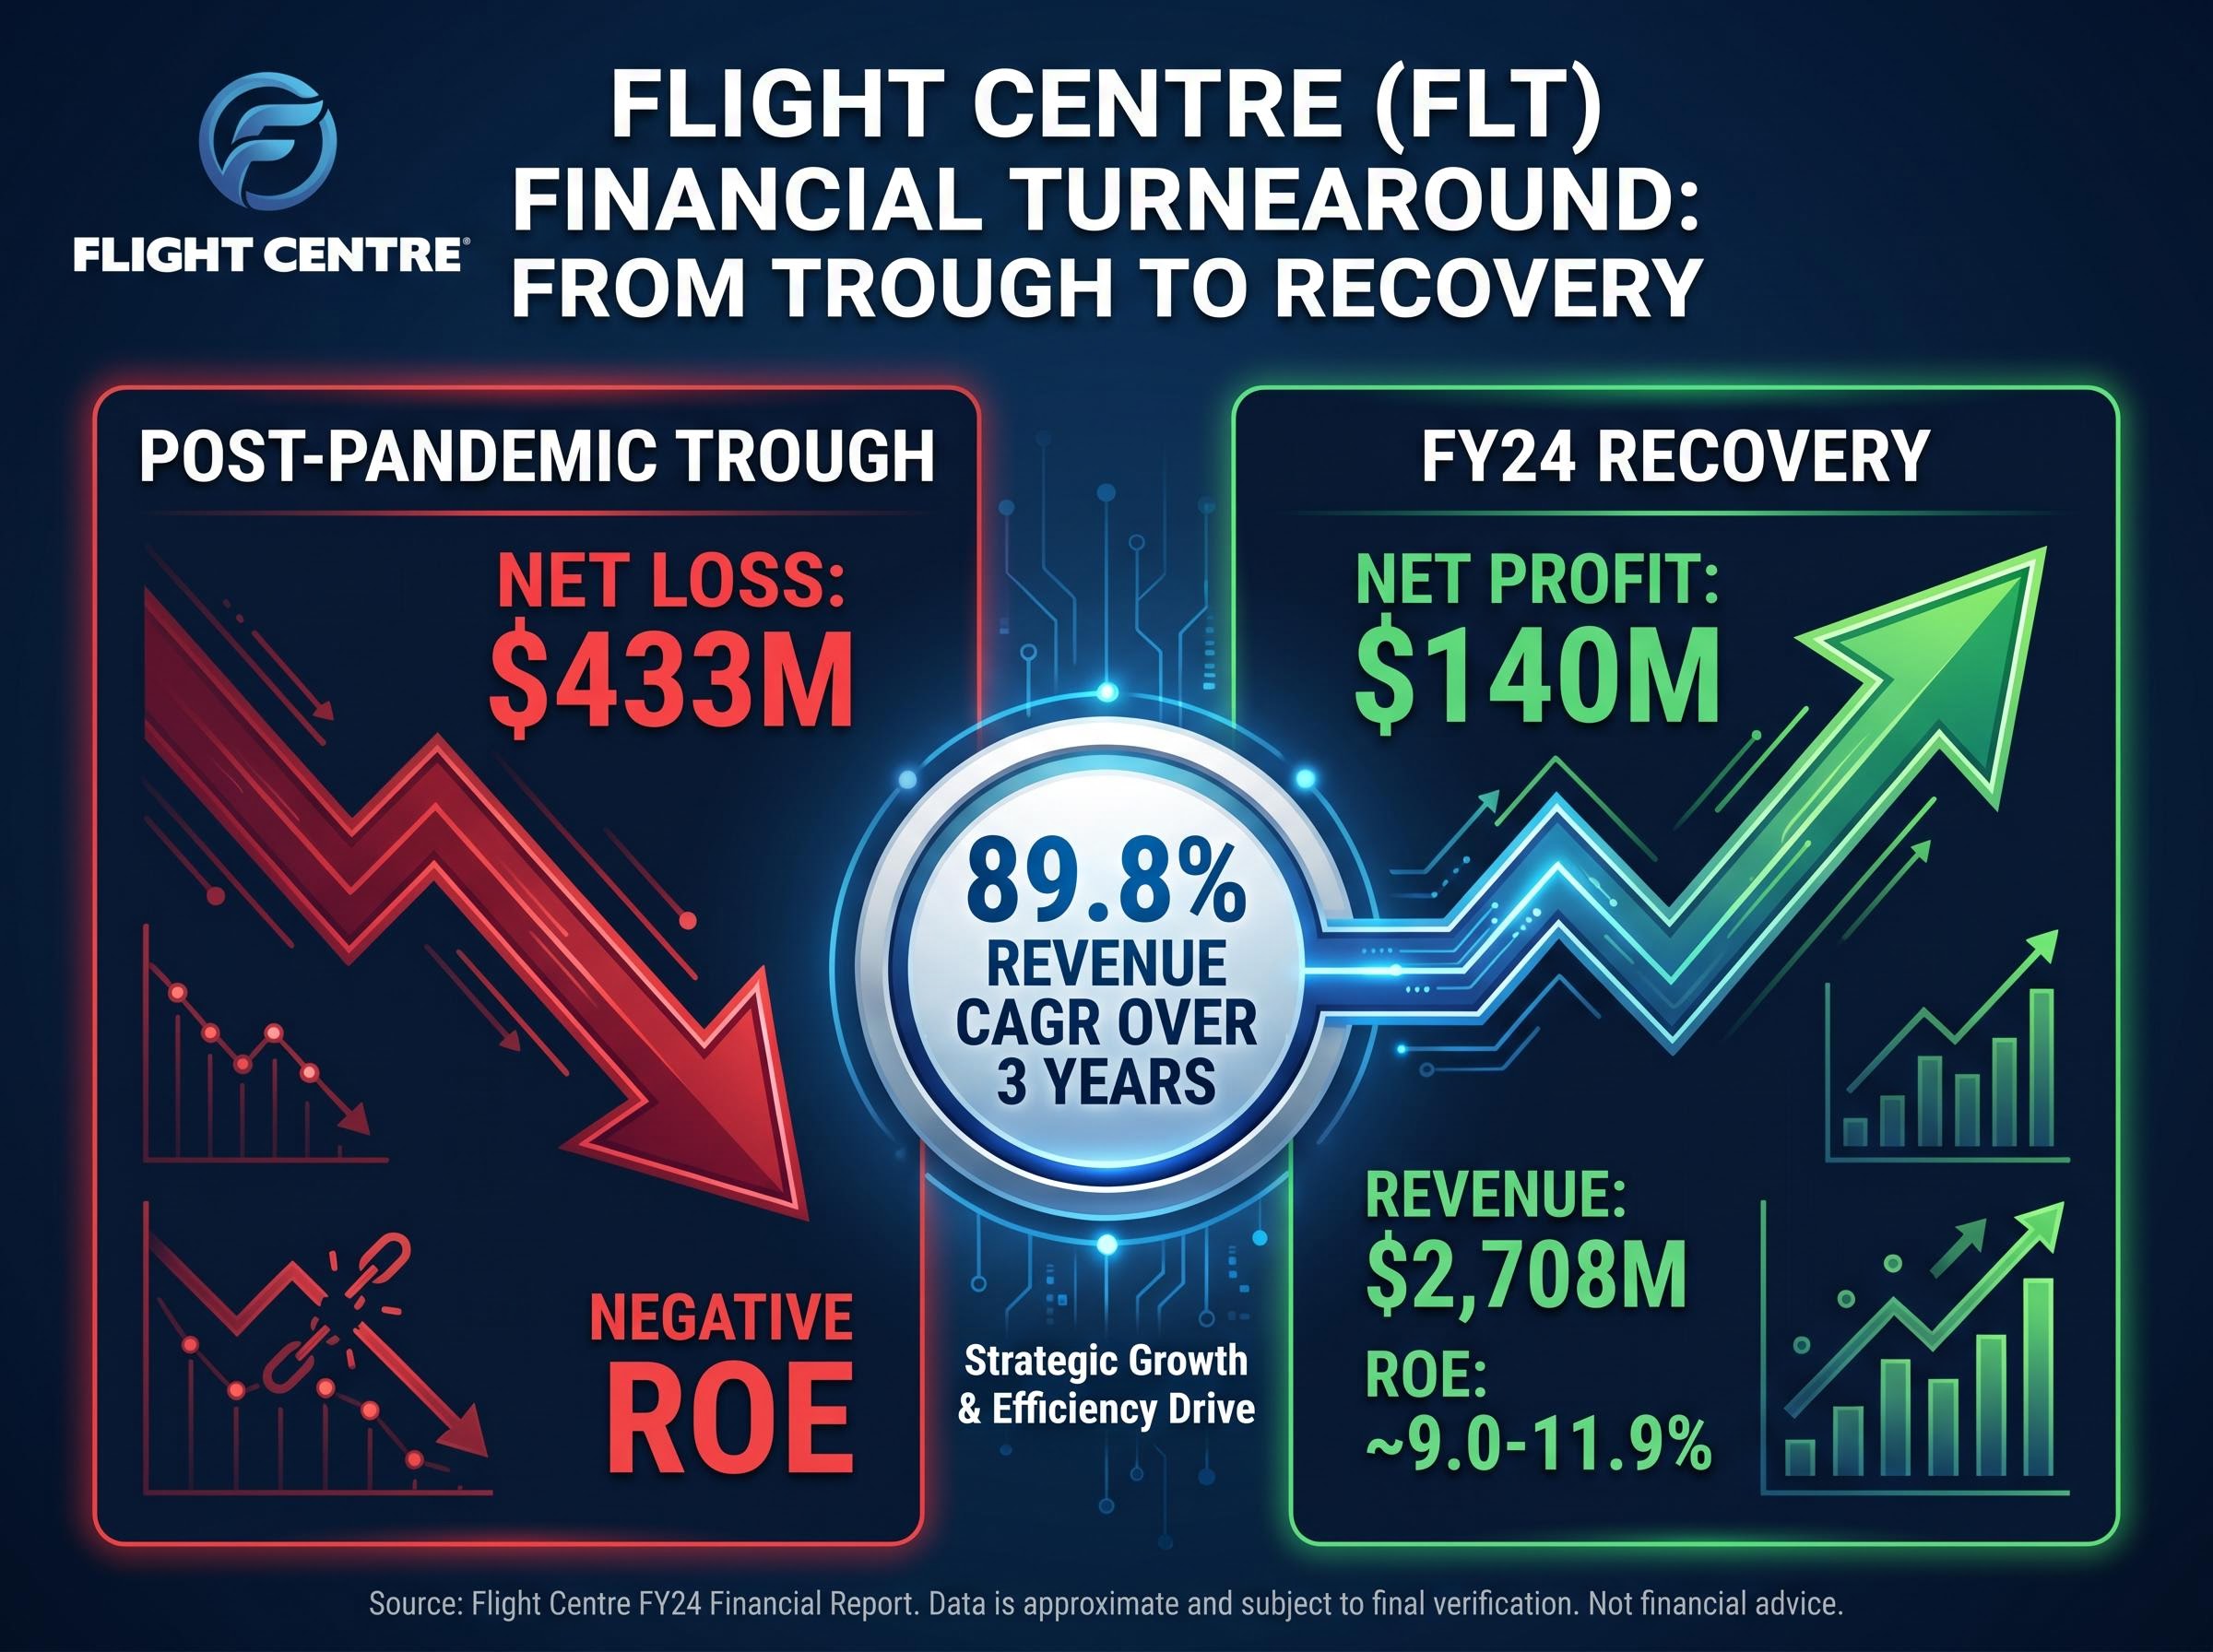
Start with the profit swing. In the years immediately following the pandemic, FLT reported a net loss of $433 million. By FY24, the company posted a net profit of $140 million. That is not a modest improvement. It is a complete financial transformation.
Revenue tells a similar story. FLT achieved $2,708 million in revenue in FY24, reflecting compound annual growth of 89.8% over the three years to that result. Some of that figure reflects post-COVID normalisation rather than purely organic business momentum; the travel industry was rebuilding from a near-zero base. Even so, the scale of the rebound is difficult to dismiss.
| Metric | FY21/FY22 (loss period) | FY24 | Direction |
|---|---|---|---|
| Net profit/loss | -$433M | $140M | Positive swing |
| Revenue | Severely depressed | $2,708M | 89.8% CAGR to FY24 |
| ROE | Negative | ~9.0-11.9% | Recovering toward benchmark |
ROE requires closer attention because two different data points circulate. Source themes report 11.9% for the most recently reported annual period, while trailing twelve-month data from Yahoo Finance and Wisesheets indicates approximately 9.0 to 9.02%. The discrepancy reflects different measurement windows. What matters is the direction of travel: ROE has moved from deeply negative to approaching or exceeding the 10% threshold, depending on the period referenced.
ROE above 10% signals a business generating meaningful returns on shareholder capital.
For an investor assessing whether the recovery is real or inflated by base effects, the ROE trajectory is the single most important signal. It suggests the business is generating genuine returns on deployed capital, not simply reporting nominal profits from a low base. Corporate TTV at record levels in FY24 reinforces this, and management flagged further profit growth expected in FY25 without providing a precise numeric guidance band.
The market’s hesitation is not irrational. The bearish case deserves genuine intellectual respect.
Broker consensus has been described as generally “Hold” across 2024 to 2025 Australian media coverage. At least one broker maintained an “Outperform/Buy” rating based on corporate growth, while at least one other adopted a more cautious “Neutral/Hold” stance. Morningstar has historically flagged structural pressure on shopfront leisure, though its current fair value estimate remains behind a paywall.
The April 2026 guidance cut and net debt position of approximately $283 million are two data points the current price-to-sales compression does not fully capture: the withdrawn UPBT range of $315-350 million removed a forward anchor for institutional positioning, and the $85 million capex commitment to AI and digital tools means free cash flow generation remains constrained even as operating profit improves.
Not all risks carry the same investment implication. Cyclical risks, such as cost-of-living pressure and elevated interest rates, resolve as macro conditions improve. An investor who enters near the bottom of a cyclical downturn positions for the recovery.
Structural risks operate differently. If online travel agencies are permanently eroding the store-based leisure model, that headwind does not reverse with economic recovery. The question for timing is direct: if FLT’s discount is primarily cyclical, entry at current prices could prove well-timed. If it is primarily structural, a low multiple may not be low enough.
The investment implication of any share price decline turns almost entirely on classifying a sector selloff correctly before applying a valuation multiple: a stock trading at 9 times forward earnings is genuinely cheap if the decline is cyclical and the earnings base holds, but that same multiple is dangerously misleading if the underlying industry is undergoing permanent structural disruption.
A forward P/E of approximately 9 times is only cheap if earnings continue to grow. Should structural and cyclical headwinds combine to compress margins or slow TTV growth, that multiple expands quickly, and the “cheap” thesis unravels.
For the forward P/E of approximately 8.76 to 9.26 to represent a genuine margin of safety, an investor would need to believe three things:
The ROE trajectory is the single most important ongoing signal. If ROE continues toward 12% to 15%, the current price is pricing in excessive pessimism. If it stalls below 10%, the broker consensus of “Hold” is vindicated.
FLT’s post-COVID cost base is leaner than its pre-pandemic structure. Headcount remains below peak levels, supplemented by technology-driven productivity. If TTV grows without proportional headcount growth, margins expand, and the forward multiple compresses further.
FLT’s stated medium-term ambition, according to its FY24 investor presentation, is to exceed pre-COVID TTV on a sustainable basis. Network rationalisation, focused on more productive store locations and corporate hubs, provides the operating leverage mechanism. This is the section that converts a passive reading of the investment thesis into an active decision filter. An investor who agrees with these conditional beliefs has a coherent case for entry; one who does not has a coherent case for the sidelines.
Both the bullish and bearish cases are internally coherent. The bull case rests on corporate growth momentum, operating leverage from a leaner cost base, and a forward P/E that appears to price in significant pessimism. The bear case rests on structural leisure erosion, cyclical macro risk, a technology investment programme that has not yet proven its margin impact, and a trailing ROE that has not yet decisively cleared 10%.
Two data points will resolve this tension over the next twelve months:
The broker consensus of broadly “Hold” reflects genuine uncertainty, not analyst inattention. FLT’s own forward guidance remains limited; no precise numeric NPAT or EPS guidance band has been published for FY25 or FY26 as of mid-May 2026. The market capitalisation of approximately $2.11 billion against FY24 revenue of $2,708 million offers a proportion check, but revenue alone does not resolve the earnings quality question.
One underweighted bearish data point is FLT’s negative free cash flow history across a six-year average, a figure that sits alongside the improving NPAT trajectory and raises the question of whether the earnings improvement is converting into actual cash generation at the rate the profit line implies.
The ASX continuous disclosure obligations under Listing Rules 3.1, 3.1A, and 3.1B set the framework governing when and how companies like FLT must disclose material information to the market, including earnings guidance, which explains why the absence of a precise numeric NPAT or EPS guidance band carries regulatory rather than purely strategic significance.
For Australian investors, FLT at current prices is a thesis stock rather than a set-and-forget position. The opportunity is real, but so is the risk that the market’s “Hold” verdict reflects better information than it appears. This is an investment that requires active monitoring of segment-level TTV disclosures and margin data, and investors comfortable with that level of engagement are better positioned to benefit from any re-rating.
This article is for informational purposes only and should not be considered financial advice. Investors should conduct their own research and consult with financial professionals before making investment decisions. Past performance does not guarantee future results. Financial projections are subject to market conditions and various risk factors.
Flight Centre trades at a forward P/E of approximately 8.76 to 9.26 based on FY26/FY27 forecasts, which is considerably lower than its trailing P/E of around 21, suggesting the market expects meaningful earnings growth but is pricing in significant risk around whether that growth will materialise.
Flight Centre swung from a net loss of $433 million in the years immediately following the pandemic to a net profit of $140 million by FY24, representing a complete financial transformation over roughly three years.
The main risks include structural pressure on the leisure segment from online travel agencies, cyclical sensitivity to consumer spending and interest rates, technology execution risk from its AI and digital investment programme, and a net debt position of approximately $283 million following an April 2026 guidance cut.
The corporate division, operated through FCM and Corporate Traveller, carries structurally higher margins and more recurring revenue than the leisure segment, so an increasing share of corporate revenue in the overall mix would represent a fundamentally stronger and more defensible business model.
The two most important signals are whether return on equity moves sustainably above 10% to 12%, confirming genuine capital returns, and whether corporate total transaction value continues to grow faster than leisure headwinds across FY25 and FY26 results.