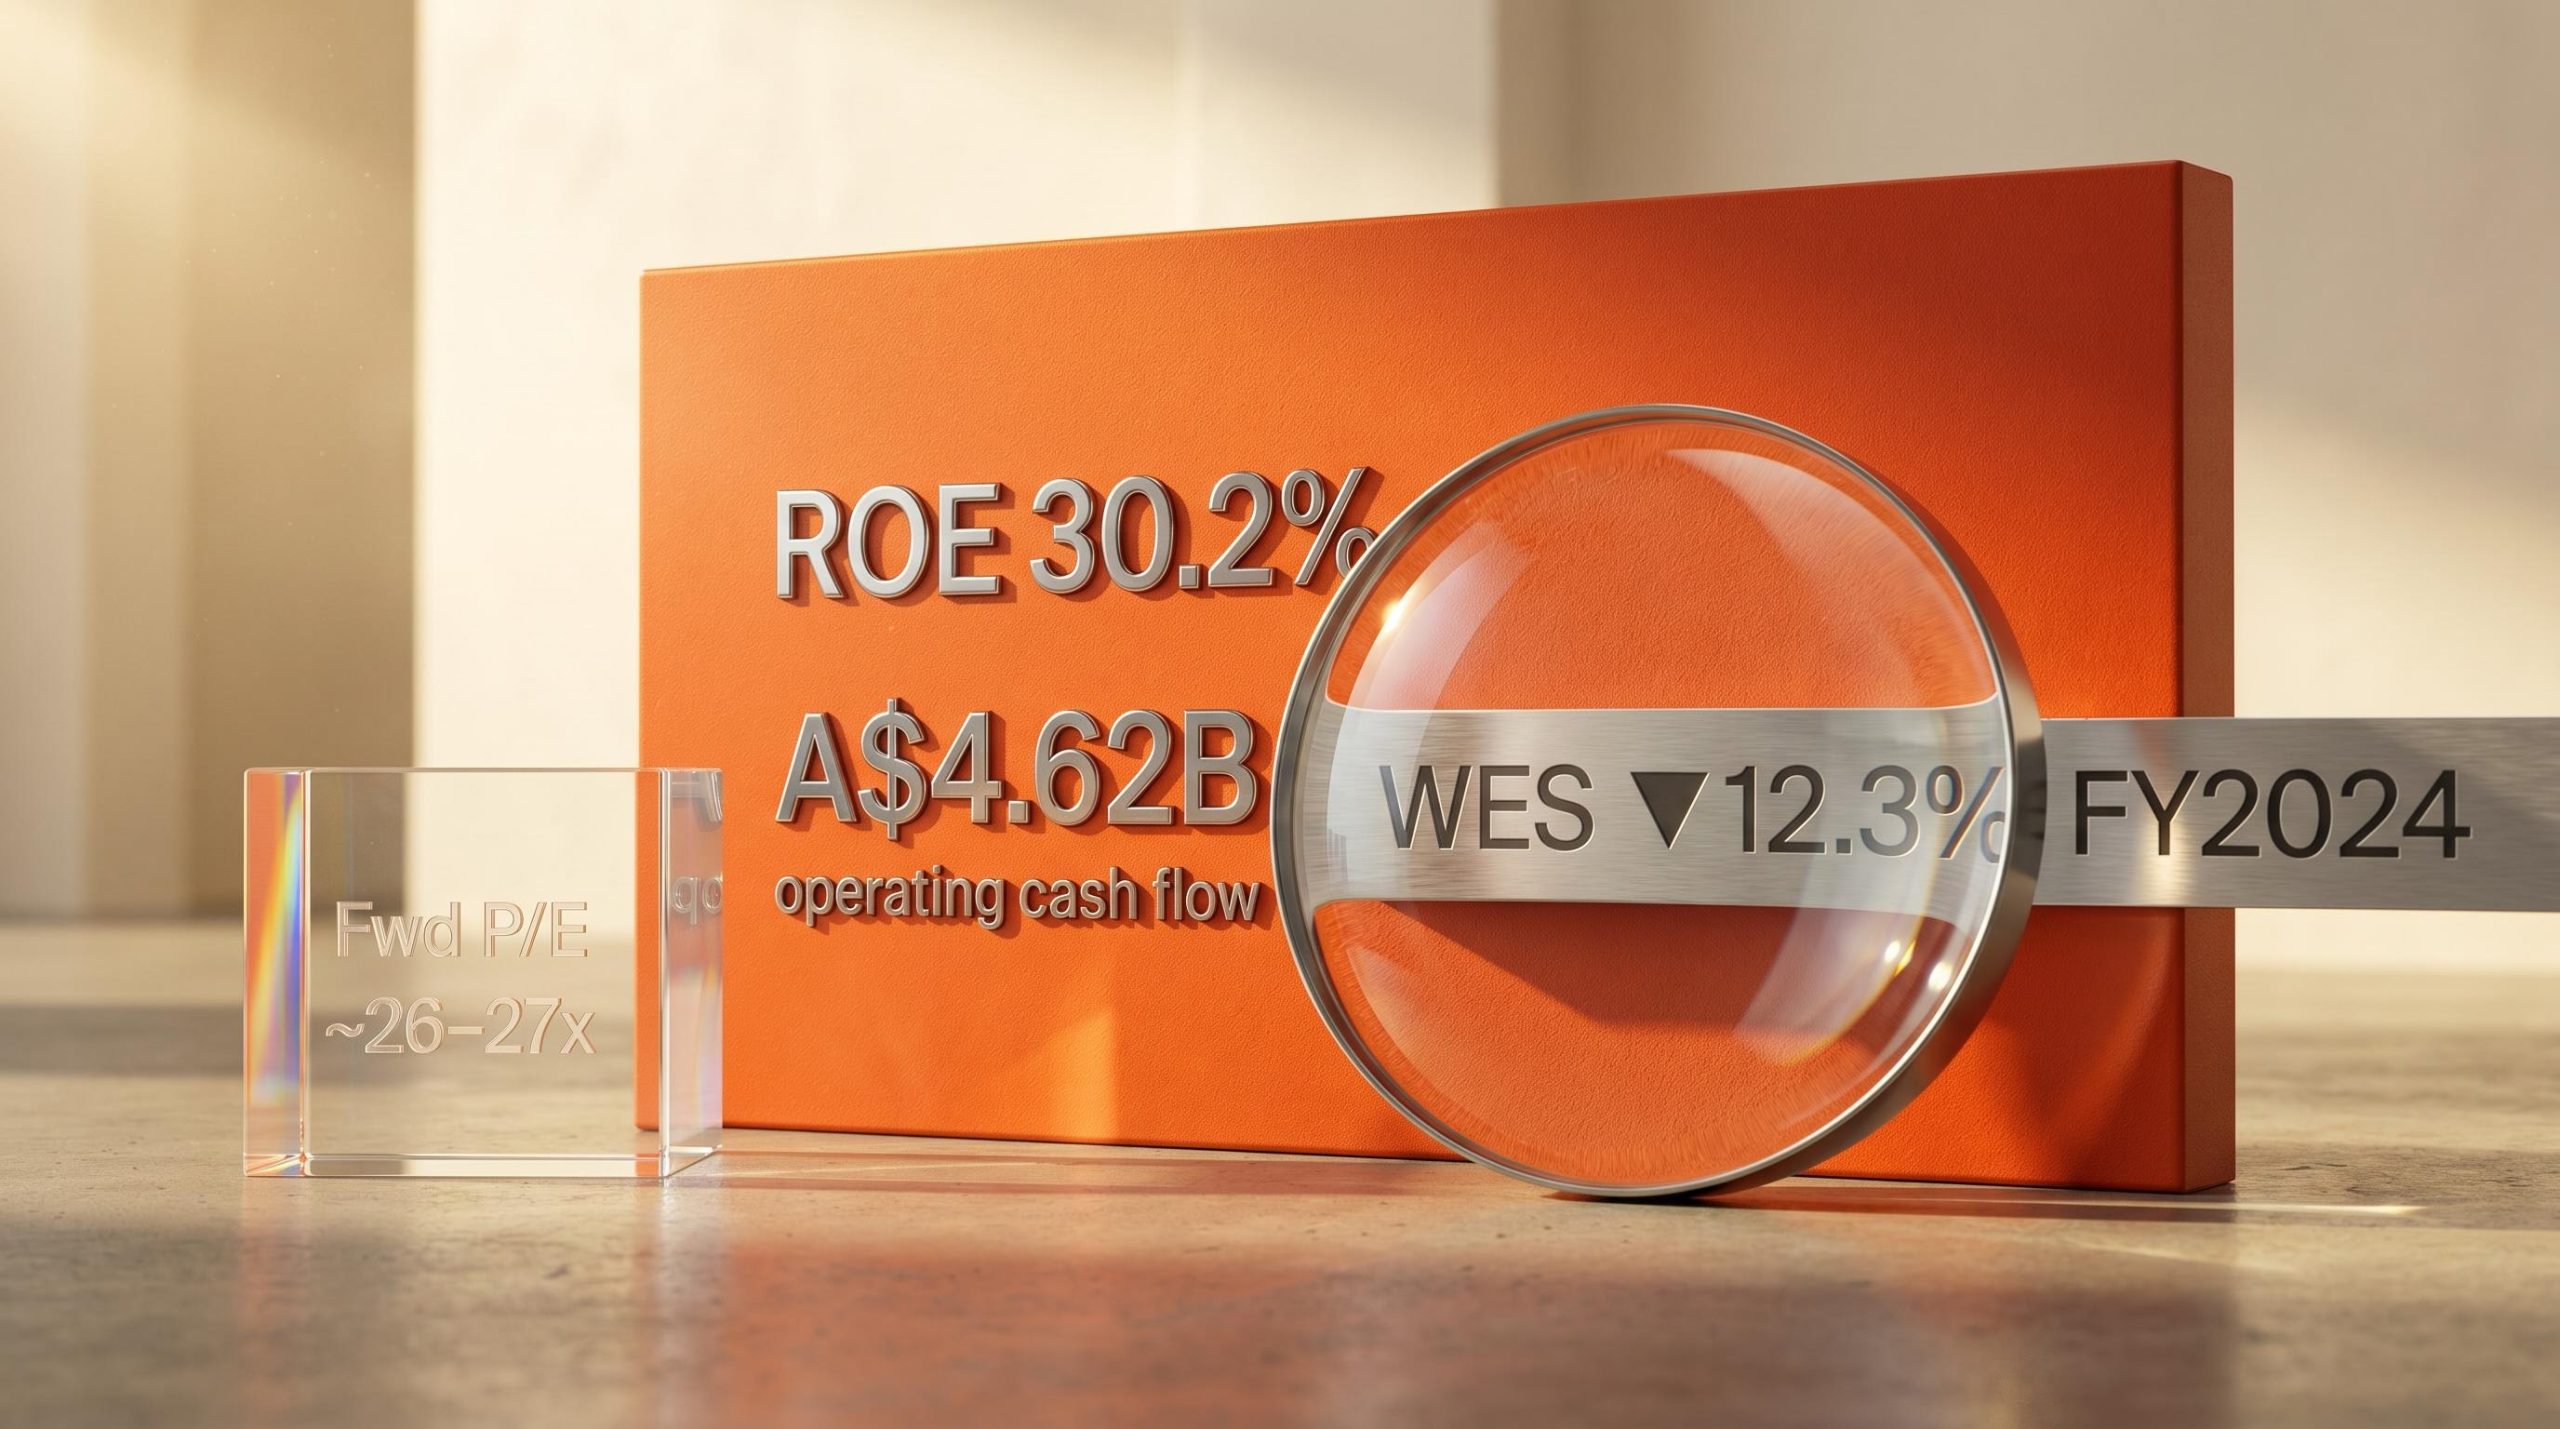
Wesfarmers shares have fallen 12.3% since the start of 2025, yet the company behind them generated A$4.62 billion in operating cash flow in FY2024 and runs the most trusted retail brand in Australia. That tension between price movement and underlying business quality is exactly where interesting investment questions live.
Rising interest rates have weighed on the entire ASX Consumer Discretionary sector, which has delivered an annualised return of just 0.90% over five years versus 4.21% for the broader ASX 200. Yet Wesfarmers achieved annualised revenue growth of 9.2% over the same window, suggesting the business itself has been more resilient than its sector label implies. This analysis unpacks how Wesfarmers actually makes money across economic cycles, why Bunnings is structurally different from other discretionary retailers, what the capital allocation playbook means for long-term shareholders, and what the current valuation signals suggest for investors assessing WES at current price levels.
The conglomerate model that most investors misread
Wesfarmers is classified as a consumer discretionary stock on the ASX. That classification obscures what the Perth-based conglomerate actually is: a capital allocator that happens to own retailers.
The ASX Consumer Discretionary underperformance that has dragged the XDJ to a 1.14% annualised five-year return is rooted in rate cycle mechanics, compressed household disposable incomes, and dividend variability that income investors tend to underweight when screening on yield alone.
The company’s portfolio spans:
- Bunnings (home improvement)
- Kmart and Target (discount department stores)
- Officeworks (office and technology retail)
- Priceline Pharmacy and the broader Health division
- Blackwoods and other industrial safety and distribution businesses
- WesCEF (chemicals, energy, fertilisers)
- Covalent Lithium (50% ownership, Mt Holland project)
The mechanism is an acquire-grow-divest flywheel. Wesfarmers acquires businesses at one value, compounds their earnings through operational reinvestment and management discipline, then divests at a premium when a higher-value owner exists or when returns plateau. This cycle creates a structurally different return profile from single-sector companies whose fortunes are tied to one market cycle.
The results speak directly. FY2024 return on equity (ROE) reached 30.2%, materially above the ASX 200 average.
WES’s FY2024 ROE of 30.2% sits materially above what most domestic discretionary retailers post, typically mid-teens to low-20s.
Understanding this framework is the prerequisite for evaluating whether the 2025 price weakness is structural or cyclical.
When big ASX news breaks, our subscribers know first
Coles and Bunnings: one exit, one anchor, and what each teaches investors
The clearest proof that Wesfarmers operates as a capital allocator rather than a buy-and-hold retailer is the Coles story. Acquired in 2007, Coles was a struggling supermarket chain. Wesfarmers invested heavily in operations, supply chain, and store formats. By 2018, the business had been transformed, and Wesfarmers demerged it as a standalone ASX-listed entity. The cycle was complete: acquire, grow, divest at a premium.
Bunnings is the opposite case, and the contrast does the analytical work.
Why Wesfarmers kept Bunnings and sold Coles
Wesfarmers took its initial stake in Bunnings in 1987 and purchased the remaining 52% in 1994 for A$594 million. More than three decades later, it remains the company’s largest and most profitable division. The capital allocation logic is straightforward: Coles operated in a mature, low-margin, highly competitive grocery market where incremental returns on capital were declining. Bunnings operates in a structurally underserved home improvement market with high switching costs and category breadth that continues to yield investment opportunities.
The demerger allowed both businesses to pursue independent strategies, but the signal to investors is that Wesfarmers did not sell Bunnings because it continued to meet the company’s internal return thresholds, and then some.
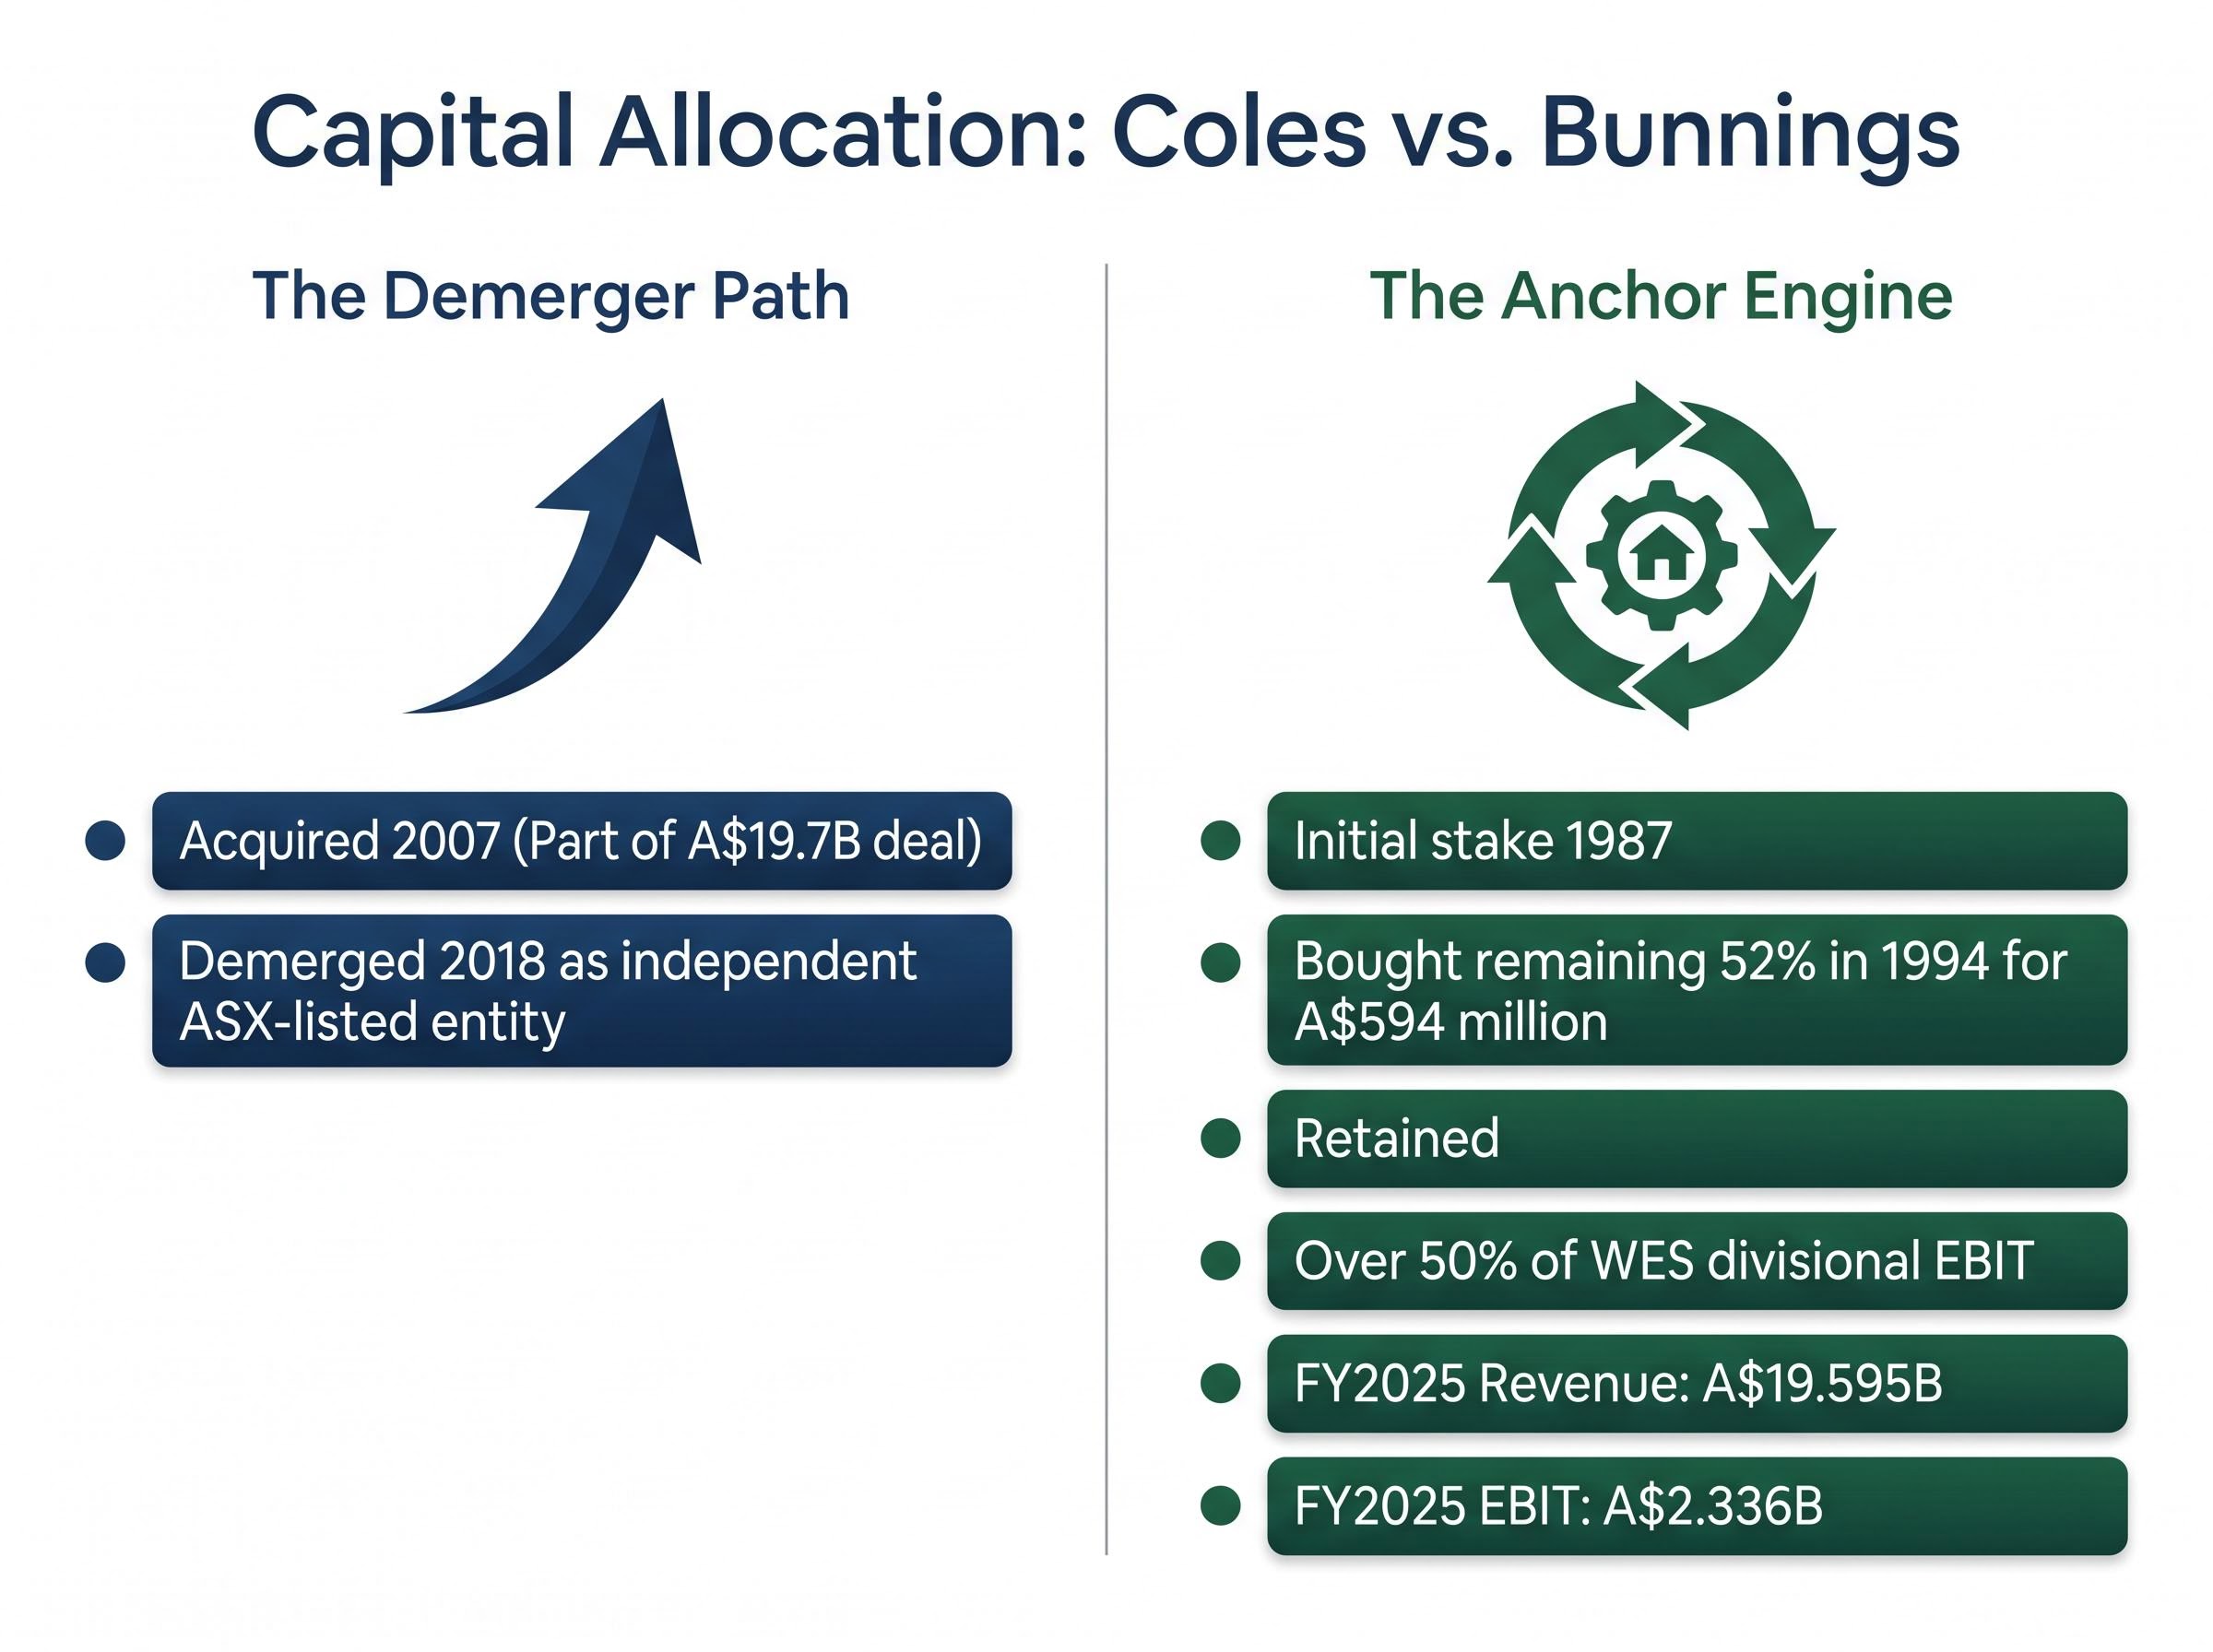
| Dimension | Coles | Bunnings |
|---|---|---|
| Acquisition year | 2007 | 1987 (initial stake); 1994 (remaining 52%) |
| Acquisition cost | Part of broader A$19.7B Coles Group deal | A$594 million (1994 purchase) |
| Strategic outcome | Demerged 2018 | Retained; core holding |
| Current status | Independent ASX-listed entity | Well over 50% of WES divisional EBIT |
| Key financial contribution | N/A (divested) | FY2025 revenue: A$19.595B; EBIT: A$2.336B |
When investors buy WES, they are taking a substantial primary bet on Bunnings’ continued dominance, with the rest of the portfolio providing optionality and diversification.
What “most trusted brand” actually means in financial terms
Bunnings was named Australia’s most trusted brand in both 2023 and 2024. The recognition is widely known. What matters for investors is the specific financial mechanics behind that trust.
The structural characteristics underpinning Bunnings’ competitive position include:
- Store network density that saturates metropolitan and regional markets
- Trade customer penetration that diversifies revenue beyond consumer DIY
- Everyday-low-price positioning that removes the promotional volatility common in discretionary retail
- Category breadth across hardware, garden, building supplies, and homewares that competitors have not replicated at scale
- Digital integration and data-driven merchandising improving customer targeting and supply chain efficiency
These translate into financial durability. Morgan Stanley Australia has described Bunnings as the “anchor earnings engine” for WES, arguing that even in a softer housing cycle, scale and category dominance should allow margin maintenance and low-to-mid single-digit EBIT growth.
Morgan Stanley characterised Bunnings as the “anchor earnings engine” for WES.
UBS noted Bunnings’ “defensive earnings profile,” expecting EPS growth to be driven by modest sales growth rather than major margin expansion. Morningstar forecast mid-single-digit revenue compound annual growth over the next five years with broadly stable EBIT margins.
CEO Rob Scott has described Bunnings as “well positioned to navigate a subdued consumer environment” given its everyday-low-price positioning. Management has flagged housing activity and big-ticket spend as near-term headwinds, offset by structural “improve, not move” consumer trends favouring renovation over relocation. The question for investors is not whether Bunnings is dominant. It is whether that dominance can be maintained as housing cycle conditions remain subdued through 2026 and beyond.
Beyond Bunnings: lithium, healthcare, and where the next compounding cycle might come from
The conglomerate model means Wesfarmers is always mid-cycle on at least one growth initiative. Two current platforms illustrate this.
- Covalent Lithium (Mt Holland): Wesfarmers owns 50% alongside SQM. The project is progressing through commissioning at both the Mt Holland mine and the Kwinana refinery. It remains pre-material cash flow, a position consistent with early-stage platform building. Morgan Stanley and UBS have both characterised WES’s lithium exposure as optionality rather than a near-term earnings driver.
The spodumene price recovery that took lithium carbonate approximately 197% off cycle lows to around US$26,800 per tonne by May 2026 has materially shifted the economics of early-stage lithium projects, including the Mt Holland operation, making the timing of Wesfarmers’ Covalent Lithium commissioning decision more consequential than it appeared twelve months ago.
- Health division (Priceline Pharmacy and API): Wesfarmers completed its acquisition of Australian Pharmaceutical Industries in 2022 and has been integrating it as the Health division. FY2025 commentary confirmed continued progress, with investment in supply chain and systems upgrades. Medium-term ambitions centre on growth in health, wellness, and beauty retailing under the Priceline brand.
Morgan Stanley and UBS characterised WES’s lithium exposure as “optionality rather than a near-term earnings driver.”
No major new acquisitions were announced in the 2024-2026 period. The focus has been on organically growing existing platforms. Both lithium and healthcare could become material earnings contributors by the late 2020s, but equally, they carry execution risk. Investors who price WES purely on current-year earnings from Bunnings and Kmart risk undervaluing embedded optionality; those who assign full value to pre-revenue initiatives risk the opposite error.
Reading the valuation signals after a 12% fall
As of 15 May 2026, WES shares traded at A$71.67, giving the company a market capitalisation of approximately A$81.6-82.0 billion. Three valuation data points frame where the stock sits on the cheap-to-expensive spectrum.
Dividend yield currently sits at approximately 2.76-2.8%, below the five-year historical average of approximately 3.36-3.4%. When dividends are growing (as they have been), a below-average yield signals a share price that remains elevated relative to long-run benchmarks, even after the 2025 decline.
Forward P/E sits at approximately 26.4-27.2x, with a trailing P/E of 26.8x. No longer at peak-cycle highs, but still a premium to the broader ASX 200 and many discretionary peers. Ord Minnett and Goldman Sachs have argued the premium is justified by ROE, cash flow quality, and capital allocation history.
Shaw and Partners noted WES is “no longer expensive, but still not cheap.”
| Broker | Rating | 12-month target | Brief rationale | Source timing |
|---|---|---|---|---|
| Goldman Sachs | BUY | A$70 | Long-term compounder; Bunnings dominance; lithium and healthcare optionality | Pre/post-HY2026 |
| Ord Minnett | ACCUMULATE | A$68 | Capital allocation track record; resilient cash generation; attractive on pullbacks | Pre/post-HY2026 |
| Macquarie | NEUTRAL | A$64-65 | Modest earnings growth; fully valued multiple versus peers | Pre/post-HY2026 |
| Shaw and Partners | HOLD | A$65 | No longer expensive but not cheap; yield below historical average | Pre/post-HY2026 |
| MarketIndex consensus | HOLD | ~A$66-67 | Aggregated broker consensus | May 2026 |
The 12.3% decline has compressed WES’s valuation from expensive toward fair, but has not created a deep-discount opportunity on most standard metrics. The data allows investors to position WES relative to their own valuation framework rather than relying on any single broker’s view.
For investors wanting to stress-test the premium multiple against explicit scenario assumptions, our dedicated guide to the bull case scenario for WES maps out the specific conditions across healthcare earnings growth, Covalent lithium volumes, and retail division margins that would need to hold simultaneously for the current valuation to prove justified.
How diversified conglomerates compound differently from single-sector companies
Most ASX-listed companies operate within a single sector. Their earnings, margins, and share prices are substantially tied to one macro cycle. Conglomerates like Wesfarmers operate differently, and understanding why matters for valuation.
A single-sector company is largely a price-taker on its relevant cycle. A conglomerate can internally reallocate capital toward the highest-returning opportunity at any given time. When Wesfarmers exited Coles in 2018, the freed capital went toward healthcare, lithium, and reinvestment in Bunnings’ network expansion. That flexibility compresses the volatility of the aggregate return stream compared to a single-sector holding.
This is why standard sector classification (ASX Consumer Discretionary) is a blunt instrument for evaluating WES. The XDJ index returned an annualised 0.90% over five years; Wesfarmers achieved revenue growth of 9.2% annually over the same period. FY2024 ROE was 30.2%, following 31.6% in FY2023. Operating cash flow rose from A$4.39 billion in FY2023 to A$4.62 billion in FY2024.
The Wesfarmers FY2024 full-year results, lodged with the ASX in August 2024, confirm the A$4.62 billion operating cash flow figure and the 30.2% return on equity cited throughout this analysis, providing investors with the primary financial disclosures underpinning each divisional performance assessment.
The three most informative metrics for evaluating a conglomerate are:
A multi-method valuation framework that sequences P/S screening, EV/EBITDA benchmarking, and DCF analysis against each other is especially important for conglomerates, where a single metric such as forward P/E can obscure the very different return profiles of constituent businesses operating across separate economic cycles.
- Return on equity (ROE): Measures how efficiently the company converts shareholder capital into profit, and whether the capital allocation decisions are generating returns above the cost of equity.
- Operating cash flow: Reveals the actual cash the business generates after operations, independent of accounting adjustments, and signals dividend sustainability and reinvestment capacity.
- Capital allocation track record: The history of acquisitions, divestments, and organic investments indicates whether management can consistently identify and execute value-creating moves over multi-year horizons.
| Dimension | Single-sector company | Diversified conglomerate | WES example |
|---|---|---|---|
| Capital allocation flexibility | Limited to one sector cycle | Can rotate capital across industries | Exited Coles; entered lithium, healthcare |
| Cycle sensitivity | High; revenue tied to one demand driver | Diversified; multiple demand drivers | Bunnings + Kmart + chemicals + health |
| Valuation benchmarks | Sector P/E, sector-specific multiples | ROE, cash flow, allocation track record | 30.2% ROE; A$4.62B operating cash flow |
| Key investor consideration | Sector outlook drives thesis | Management quality drives thesis | Acquire-grow-divest flywheel across decades |
Analysts across Ord Minnett, Goldman Sachs, and multiple fund managers quoted in the Australian Financial Review have characterised WES as a “core compounder” suited to long-term portfolios. The framework above allows investors to evaluate that characterisation on its own terms.
WES in 2026 and beyond: quality at a price, or priced for quality?
The analytical threads converge on a clear picture. Wesfarmers is a structurally high-quality compounder: 30%-plus ROE, A$4.62 billion in FY2024 operating cash flow, a defensible core business in Bunnings, and a capital allocation playbook that has delivered across multiple decades and economic cycles. At a forward P/E of approximately 26-27x, it is no longer peak-cycle expensive, but it remains a premium to the market.
The key investment considerations are:
- Quality case: Bunnings’ moat characteristics, consistent ROE above 30%, and a management team with a demonstrated track record of disciplined capital allocation support the premium multiple.
- Valuation caution: The dividend yield at approximately 2.76-2.8% remains below the five-year average of approximately 3.36-3.4%. The forward P/E has compressed but has not reached levels that historically produced the strongest entry points.
- Specific risks to monitor: Housing cycle headwinds to Bunnings big-ticket spend; pre-revenue uncertainty around Covalent Lithium; execution risk in the Health division integration; the possibility that near-term earnings growth remains subdued while management invests for medium-term outcomes.
Fund managers quoted in the AFR and Livewire have noted that “better entry points historically appeared during cyclical downturns.”
Management has flagged slower near-term revenue growth while reiterating medium-term confidence in Bunnings network expansion, trade segment penetration, and digital integration. The 12.3% share price pullback has moved WES from stretched to fair-to-reasonable on most metrics, without creating the deep-value opportunity that the most disciplined long-term investors tend to wait for.
This article is for informational purposes only and should not be considered financial advice. Investors should conduct their own research and consult with financial professionals before making investment decisions. Past performance does not guarantee future results. Financial projections are subject to market conditions and various risk factors.