How Modern Mercantilism Is Redrawing the Global Investment Map
4 mins ago

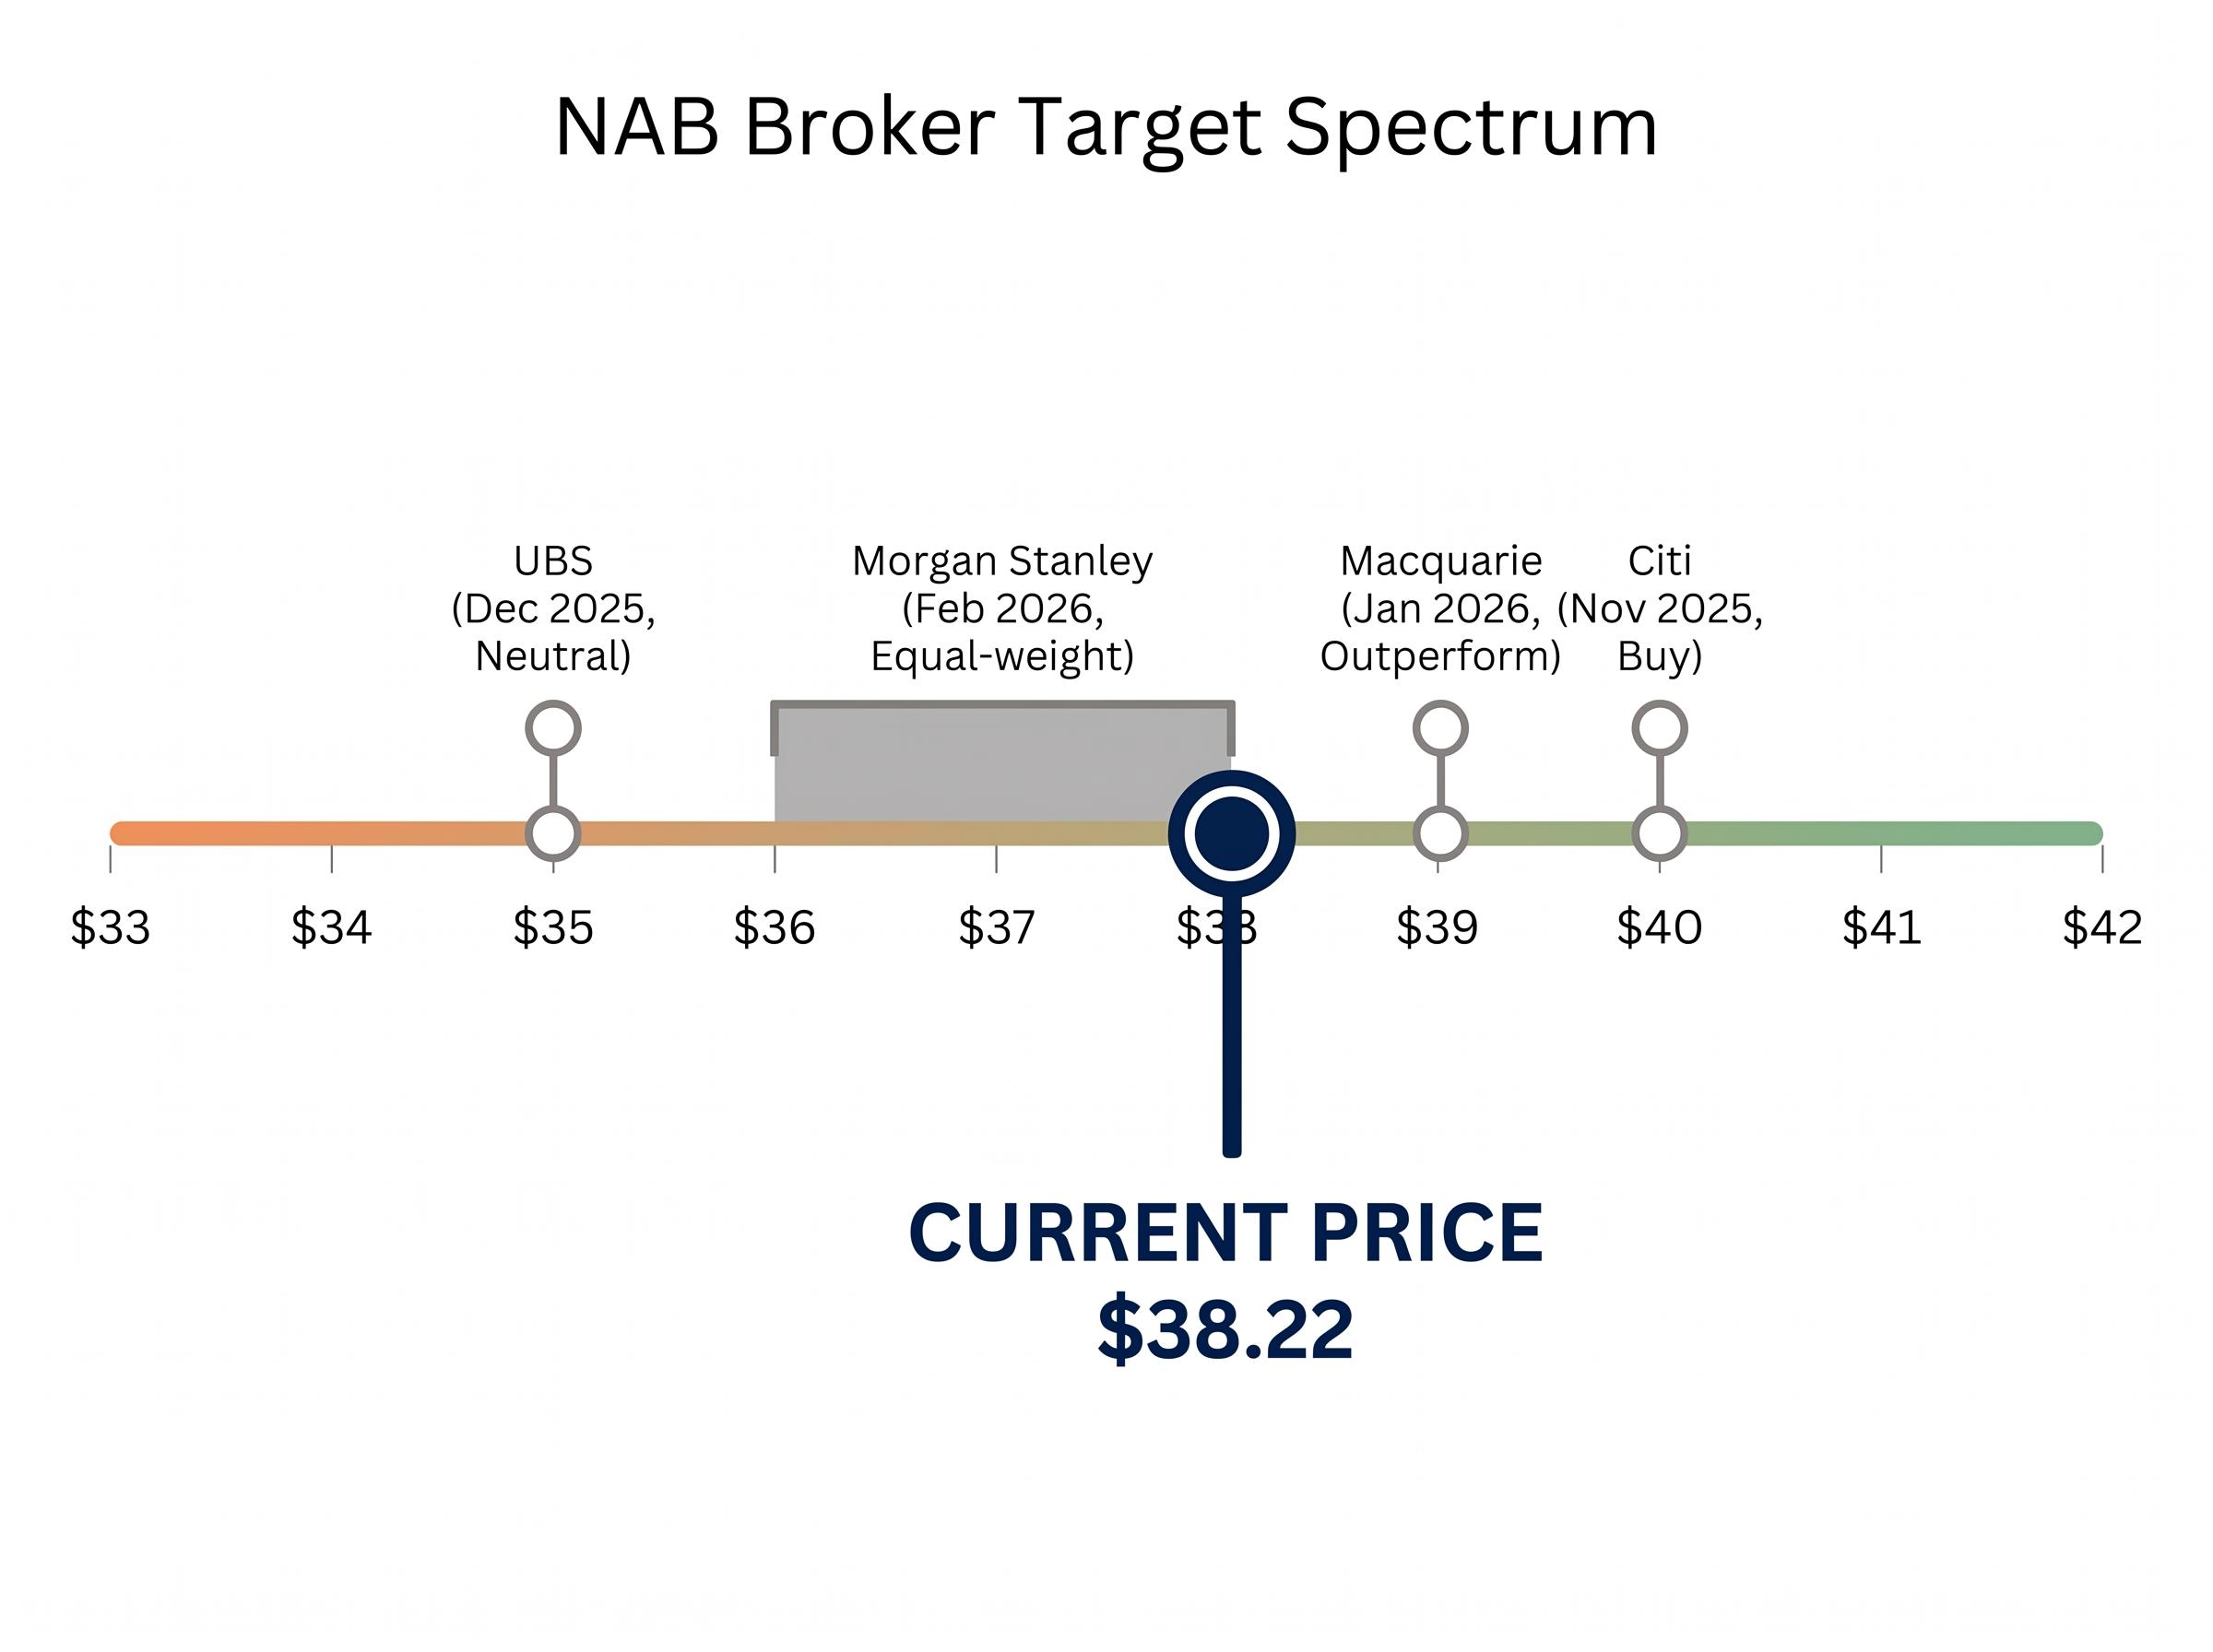
At $38.22 per share, National Australia Bank trades at roughly 16.8x its FY24 cash earnings. Whether that makes it cheap, fair, or expensive depends entirely on the framework used to ask the question.
With the RBA having lifted the cash rate to 4.35% through three consecutive hikes in 2026 and NAB shares having run hard over the past 12-18 months, income-focused investors face a genuinely difficult valuation question: has the market already priced in the good news? This guide works through that question using two standard valuation frameworks applied to NAB’s actual FY24 numbers.
By the end, readers will understand how to apply a PE-based sector comparison and a Dividend Discount Model (DDM) to the NAB share price, what each method reveals, what each conceals, and what the combined output suggests about fair value at current levels.
Every valuation model is only as reliable as the inputs it receives. Before running any calculations, the starting point is a verified set of figures drawn from NAB’s most recent full-year results and the current ASX closing price.
NAB’s FY24 cash earnings per share (diluted, continuing operations) came in at 227.0 cents. Cash EPS, rather than statutory EPS, is the standard input for bank valuations because it strips out non-cash items and one-off charges that distort underlying profitability. At the 11 May 2026 closing price of $38.22, that places the trailing PE ratio at approximately 16.8x.
NAB declared a full-year FY24 dividend of 169 cents per share, fully franked. The 1H25 interim dividend stepped up to 85 cents (fully franked), a 1 cent increase on the prior corresponding period, signalling modest but positive direction on income.
At the current price, the trailing cash dividend yield sits at approximately 4.4%. For investors eligible to utilise franking credits, the grossed-up yield rises to approximately 6.3% after applying the standard 30% corporate tax franking uplift. That distinction matters considerably for SMSF investors in pension phase and low-rate taxpayers who receive a cash refund on unused franking credits.
The franking credit calculation follows a fixed formula: the cash dividend multiplied by 30, divided by 70, reflecting the corporate tax already paid at the company level, so NAB’s $1.69 full-year dividend carries an attached credit of approximately $0.72, lifting the grossed-up value to $2.41 per share for eligible investors.
| Metric | Value |
|---|---|
| Share price (11 May 2026) | $38.22 |
| FY24 cash EPS (diluted) | 227.0 cents |
| Trailing PE | ~16.8x |
| FY24 full-year DPS | 169 cents (fully franked) |
| Trailing cash dividend yield | ~4.4% |
| Grossed-up yield | ~6.3% |
The price-to-earnings ratio is the simplest valuation tool available. It answers one question: how many dollars is the market paying for each dollar of annual earnings?
Applying it to NAB requires three steps:
Sector-adjusted fair value range: approximately $38.59 to $40.86 per share.
At 16.8x trailing earnings, NAB sits modestly below the broader sector average. That is the single most useful PE-based insight for retail investors: the stock is not expensive relative to peers, but it is not materially cheap either.
Broker views frame the picture from different angles. Morgan Stanley’s February 2026 equal-weight rating placed a target around $36-37, viewing NAB as “fairly valued” at 15-16x forward earnings. Citi’s November 2025 buy rating targeted approximately $40, arguing NAB was “undervalued versus its long-term average PE.”
The mean-reversion logic that underpins a sector-average PE target is both useful and contestable. It is useful because banks share similar business models, regulatory environments, and capital requirements. It is contestable because it assumes the sector average itself is rational, which may not hold after an extended price run-up.
PE ratio limitations for bank stocks become especially pronounced after extended rate-hike cycles, when NIM tailwinds flatter current earnings in ways that trailing multiples cannot distinguish from structurally improved profitability, making sector-relative PE comparisons a useful starting point but an unreliable endpoint for any investment decision.
Where the PE ratio asks what the market is paying per dollar of earnings, the DDM asks a different question: what is a share worth if its only value is the income it produces, growing at a steady rate, forever?
The formula is:
Share Value = D / (r – g)
Where D is the annual dividend, r is the discount rate, and g is the expected long-term dividend growth rate.
Three inputs drive the entire output:
The RBA cash rate decision announced on 5 May 2026 lifted the target to 4.35%, providing the risk-free rate anchor used throughout this guide’s discount rate calculations and reflecting the tightening monetary policy cycle that directly affects NAB’s borrower stress exposure.
The economic logic is straightforward. The DDM prices a share as the present value of a perpetual stream of growing income. This makes it more naturally suited to banks, which pay regular, relatively predictable dividends, than to growth companies with variable or absent payouts.
The model’s power, and its danger, is that it forces investors to be explicit about what growth and return assumptions they are embedding in the price they pay. A PE comparison tells you where you sit relative to others. The DDM tells you what you are actually assuming.
For franking-credit-eligible investors, the gross dividend (adjusted for the 30% tax credit) is the more relevant input. NAB’s grossed-up annual dividend is approximately $2.44, which produces materially different valuations when fed through the same formula.
A single DDM output is a false-precision exercise. The model’s value comes from running it across a range of assumptions and observing where the outputs cluster.
The table below applies the $1.71 forward cash dividend to discount rates of 6% through 11% and growth rates of 2% through 4%.
| Discount Rate (r) | g = 2% | g = 3% | g = 4% |
|---|---|---|---|
| 6% | $42.75 | $57.00 | $85.50 |
| 8% | $28.50 | $34.20 | $42.75 |
| 9% | $24.43 | $28.50 | $34.20 |
| 11% | $19.00 | $21.38 | $24.43 |
The range is enormous: from $19.00 at the most conservative assumptions to $85.50 at the most aggressive. That is not a flaw in the model; it is the model doing its job by exposing how sensitive valuation is to the discount rate.
The realistic central case for a mature Australian bank sits at a discount rate of approximately 8-9% (the 4.35% cash rate plus an equity risk premium) and a growth rate of 2-3% (consistent with low single-digit EPS growth expectations). In that zone, the cash-dividend DDM produces outputs of roughly $28.50 to $34.20, averaging approximately $35.74 to $36.16 across the central band.
At the current price of $38.22, the cash DDM suggests NAB is trading slightly above its central-case fair value on raw income alone.
The picture shifts for franking-credit beneficiaries. Using the $2.44 grossed-up dividend with the same central-case assumptions:
Grossed-up DDM output: approximately $51.66 at central-case assumptions, reflecting the materially higher income stream available to SMSF investors in pension phase and other eligible holders.
The discount rate is the primary driver of valuation uncertainty. A 1 percentage point change in the discount rate moves the output by more than the equivalent shift in the growth rate, which is why interest rate expectations matter more to the DDM verdict than earnings growth forecasts.
Both the PE method and the DDM assume that the earnings and dividends being modelled are reliable inputs. Neither model tests whether they actually are.
Credit quality deterioration, net interest margin (NIM) compression, or regulatory capital changes can all erode the inputs faster than either model assumes. The specific risks currently relevant to NAB include three dynamics. The RBA’s three consecutive hikes in 2026 increase borrower stress risk, particularly among highly leveraged mortgage holders. Competitive mortgage pricing continues to compress margins even as rates rise. Payout ratios are already elevated, leaving limited buffer if earnings disappoint.
Broker views illustrate the range of opinion. UBS’s December 2025 neutral rating carried a target of $35, characterising the stock as “fully priced” above $36 given NIM headwinds. Macquarie’s January 2026 outperform rating targeted approximately $39, citing asset quality resilience and cost discipline. NAB’s CET1 capital ratio remains comfortably above APRA’s “unquestionably strong” threshold based on FY24 and 1H25 disclosures, which supports dividend sustainability, though any sharp deterioration in asset quality could constrain payout ratios.
APRA’s unquestionably strong capital framework sets the CET1 benchmarks that Australian major banks must maintain, with the standard requiring capital ratios that provide a meaningful buffer above minimum requirements and directly constraining the payout ratios banks can sustain through economic cycles.
Broker targets cited here are directional and indicative; readers should check current consensus via FN Arena or fresh broker notes issued after the 1H25 results.
Two different frameworks, applied to the same set of verified inputs, produce a consistent message.
| Method | Key Input | Fair Value Range | Implication at $38.22 |
|---|---|---|---|
| PE (sector-adjusted) | Cash EPS $2.27 x 17-18x | $38.59 – $40.86 | Approximately fair value |
| DDM (cash dividend) | $1.71 at 8-9% / 2-3% | ~$35.74 – $36.16 | Slightly above fair value |
| DDM (grossed-up) | $2.44 at 8-9% / 2-3% | ~$51.66 | Material upside for eligible holders |
The PE-based range of $38.59 to $40.86 and the cash DDM range of approximately $35.74 to $36.16 both cluster near the current price, suggesting NAB is approximately fairly valued on a cash basis at $38.22.
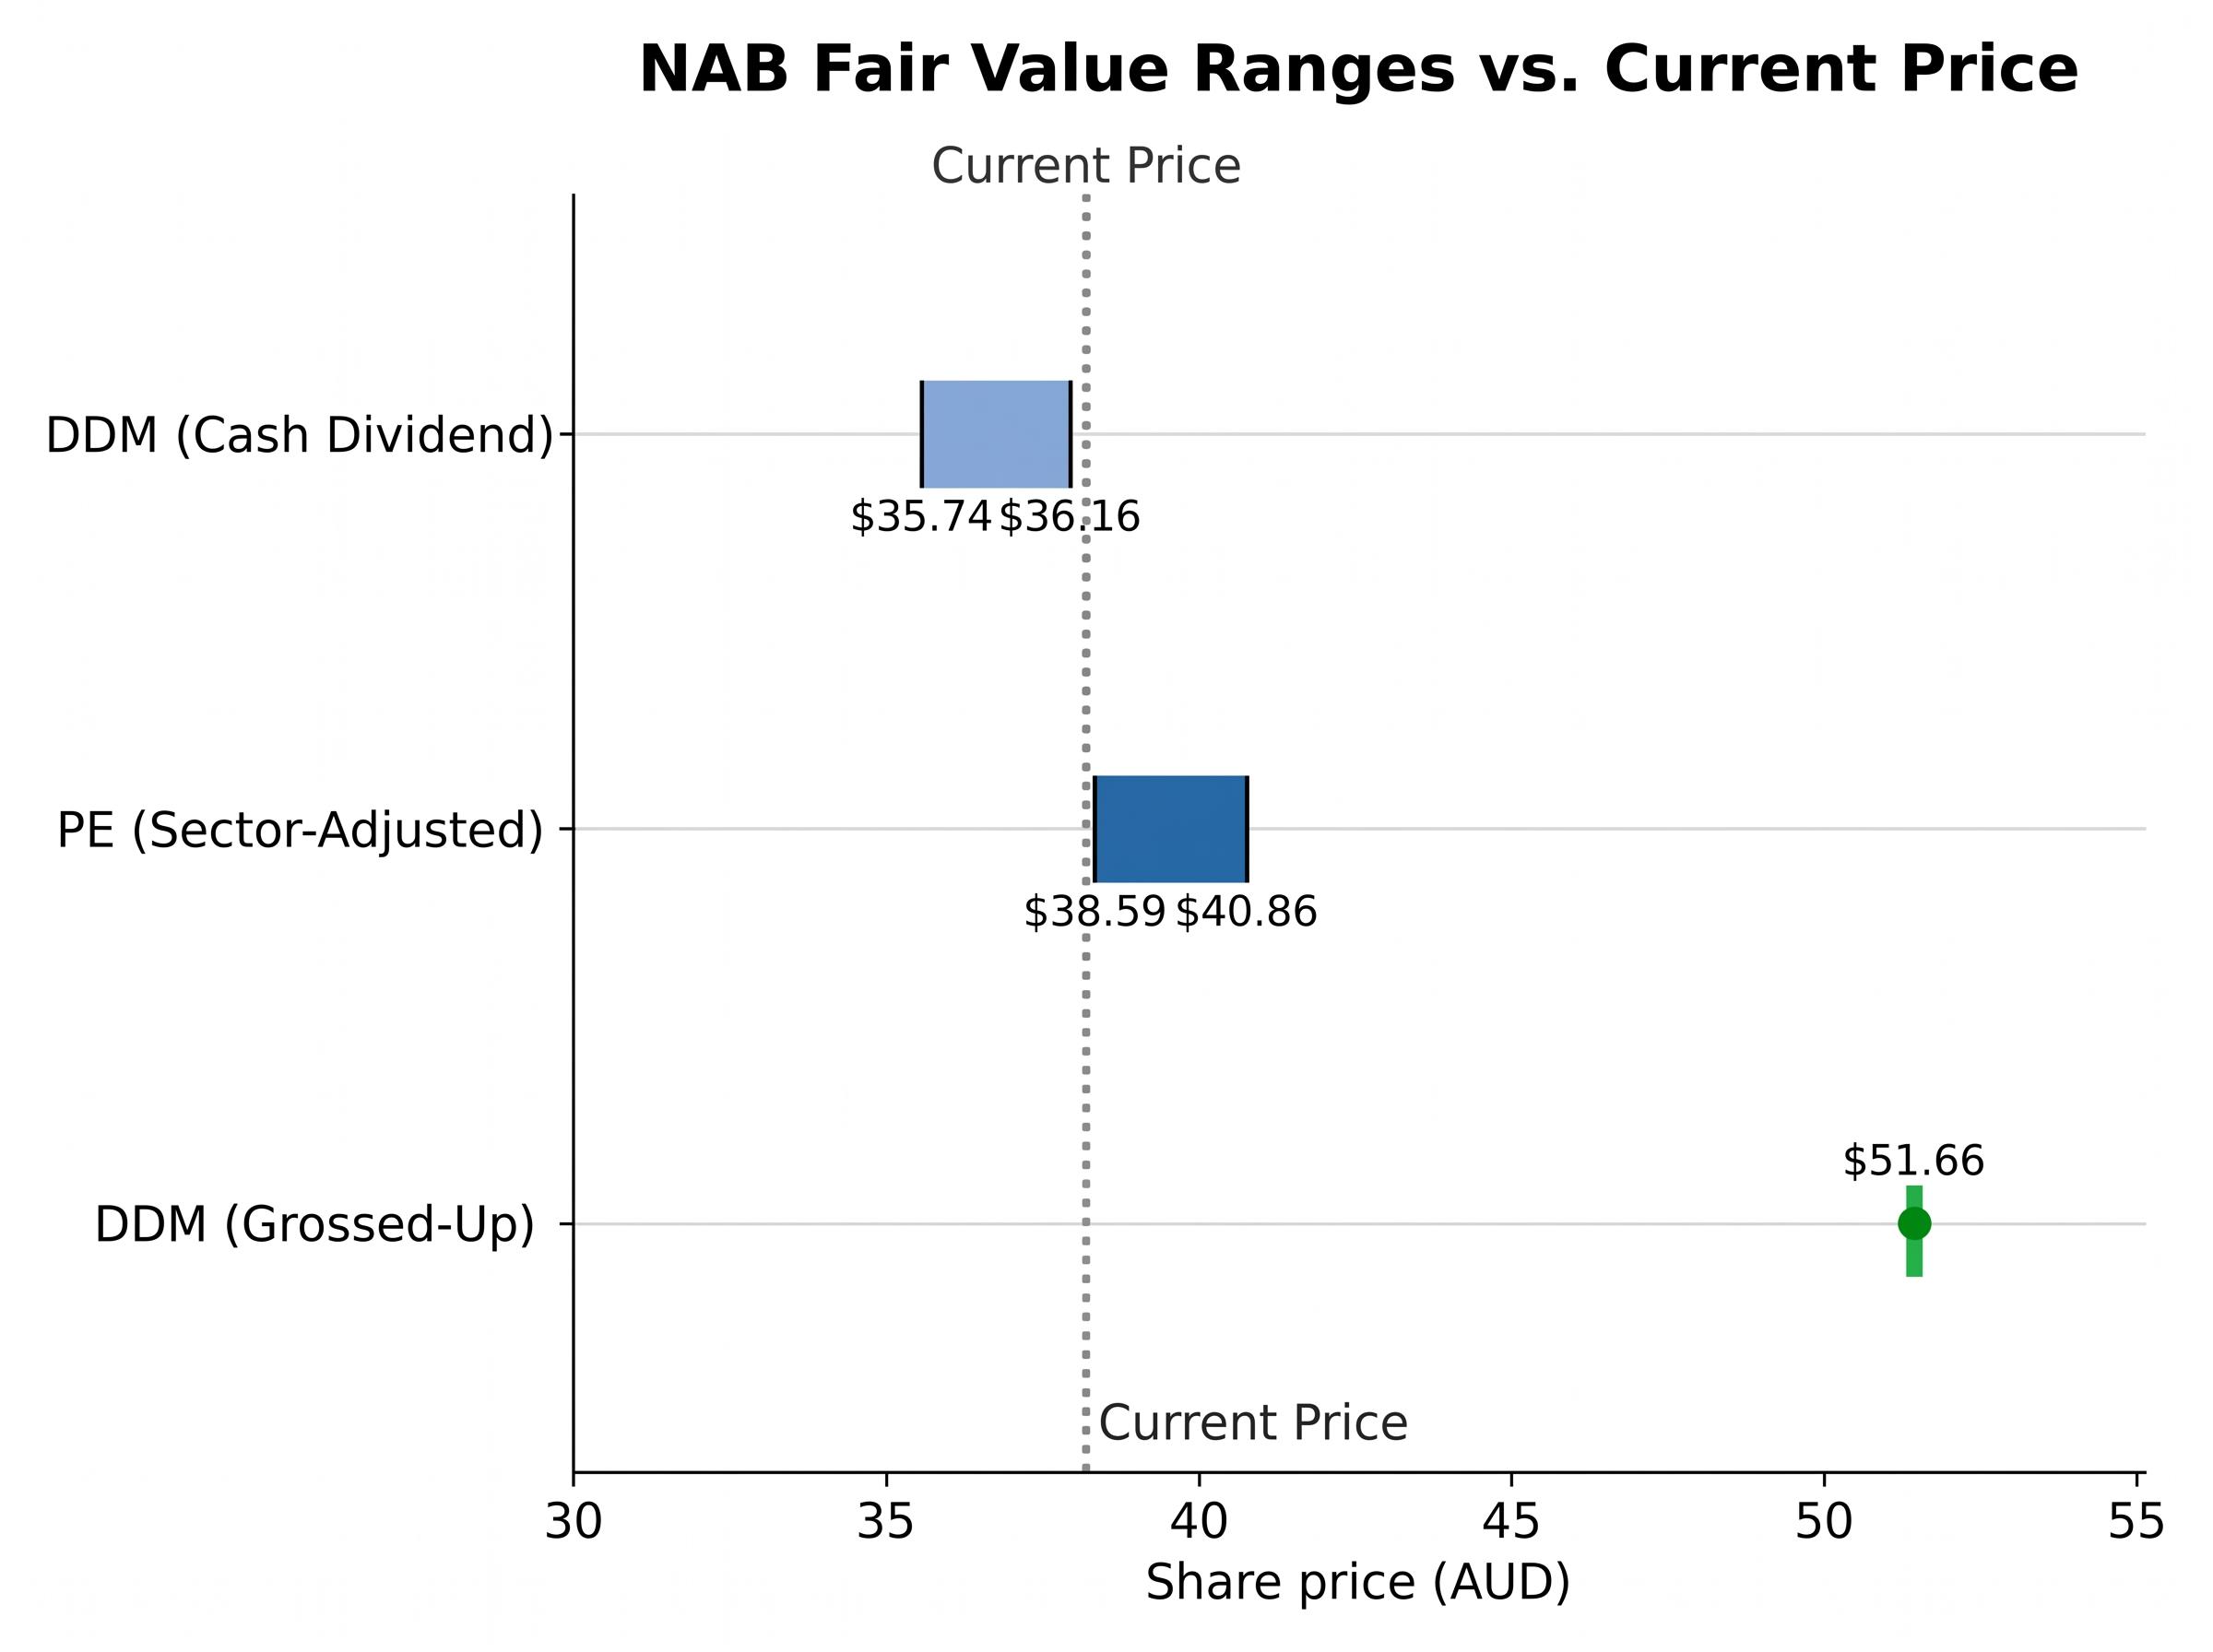
The grossed-up DDM output of approximately $51.66 is the reason NAB remains compelling for SMSF investors and retirees specifically, even when the raw cash valuation offers limited upside.
The grossed-up yield on bank shares creates the widest income advantage for pension-phase SMSF members, who receive franking credits as a direct ATO cash refund rather than a tax offset, an asymmetry that makes the same NAB dividend worth materially more to a pension-phase SMSF than to an investor in the accumulation phase or on a high marginal rate.
Trailing grossed-up yield at current price: approximately 6.3%. With term deposit rates broadly in the mid-3% to low-4% range, the franked income stream remains comparatively attractive for eligible investors.
Neither model screams buy or sell. A pullback toward the $34-36 range would make the stock unambiguously attractive on both frameworks. Sustained trading above $42-43 without a revision to EPS expectations would signal the stock has run ahead of fair value.
The real insight is that NAB’s investment case at current prices rests more on income and franking-credit value than on capital growth, which is precisely the lens income-focused investors should apply.
Both models have converged near the current price. That convergence is itself meaningful: it suggests the market is not obviously mispricing NAB, and that margin of safety requires either a lower entry price or a personal tax advantage (franking credits) that makes the yield more valuable than the headline number suggests.
Qualitative signals in bank valuations often move faster than the earnings figures embedded in PE and DDM inputs, with Big Four impaired loans climbing 15.4% to $9.6 billion in 1H26 while combined cash profit fell only 2.1%, a divergence that standard models would have missed until the next reporting period reflected it in the EPS and DPS numbers.
The sensitivity table from earlier in this guide is a living tool, not a one-time output. Revisiting the assumptions when conditions change will produce a more current and personalised valuation. Three moments warrant a fresh run:
Valuation is not a one-time calculation. The investor who treats these frameworks as a repeatable process, updating inputs as new data arrives, will make better decisions over time than one who acts on a single model output without revisiting the assumptions underneath it.
This article is for informational purposes only and should not be considered financial advice. Investors should conduct their own research and consult with financial professionals before making investment decisions. Past performance does not guarantee future results. Financial projections are subject to market conditions and various risk factors.
The Dividend Discount Model (DDM) values a share by calculating the present value of its future dividend stream, using the formula: share value equals the annual dividend divided by the discount rate minus the expected dividend growth rate. Applied to NAB using a forward dividend of $1.71 and central-case assumptions of an 8-9% discount rate and 2-3% growth, the model produces a fair value range of approximately $35.74 to $36.16 per share.
At a share price of $38.22 and FY24 cash earnings per share of 227.0 cents, NAB's trailing PE ratio sits at approximately 16.8x, which is modestly below the broader Australian major-bank sector average of roughly 17-18x, excluding Commonwealth Bank's premium multiple near 19-20x.
NAB's FY24 dividend of 169 cents per share is fully franked, meaning eligible investors receive an attached franking credit of approximately 72 cents, lifting the grossed-up value to around $2.41 per share. For pension-phase SMSF members, these credits are refunded directly by the ATO as cash, pushing the grossed-up yield to approximately 6.3% compared to the headline cash yield of 4.4%.
According to the PE and DDM analysis in this guide, a pullback in the NAB share price toward the $34-36 range would make the stock clearly attractive on both frameworks, while sustained trading above $42-43 without an upward revision to earnings expectations would signal the stock has moved ahead of fair value.
The discount rate is the most sensitive input in the DDM formula; a one percentage point change moves the output more than an equivalent shift in the dividend growth rate. With the RBA cash rate at 4.35% following three consecutive hikes in 2026, changes in the rate cycle directly alter the risk-free rate anchor, making RBA decisions a key watch point for any DDM-based NAB valuation.