VAS vs VHY: Why the Lower-Yield ETF Wins in Retirement
4 hrs ago

The Reserve Bank of Australia has hiked three times since February 2026, pushing the cash rate to 4.35% and lifting major bank term deposit rates as high as 4.80%. For the first time in years, cash is paying a real wage. So why are income-focused investors still rotating into ASX dividend shares and exchange-traded funds?
The answer sits in what term deposits cannot offer: franking credits, capital growth potential, and inflation-linked distribution upside. With consecutive rate hikes creating ongoing uncertainty about where the cash rate settles, Australian investors face a genuine strategic question about how to position their income portfolios for the remainder of 2026 and beyond. This analysis walks through the current yield landscape on both sides of the ledger, explains why the grossed-up after-tax comparison shifts the calculus for many Australian investors, and outlines a framework for choosing between individual dividend shares, income ETFs, and listed investment companies (LICs) as income vehicles.
The tightening cycle that began in February 2026 has been swift and directional. Three decisions in four months have reset the income landscape:
The RBA Statement on Monetary Policy published in February 2026 confirmed the first of three consecutive hikes, setting out the Board’s assessment that inflation remained sufficiently elevated to warrant tightening despite the existing pressure on mortgage holders and rate-sensitive businesses.
Markets saw the May hike coming. By 20 April, interest rate derivatives were pricing a 72% probability of another move. By 4 May, that figure had climbed to 86%.
Terminal rate forecasts currently point to one further 25 basis point move by December 2026, implying a cash rate of approximately 4.60%, which would push term deposit ceilings higher again and widen the hurdle that dividend securities need to clear on a headline basis.
As of 4 May 2026, markets were pricing an 86% probability of a further RBA hike at the May meeting, a conviction level that materialised in the 25 basis point increase announced the following day.
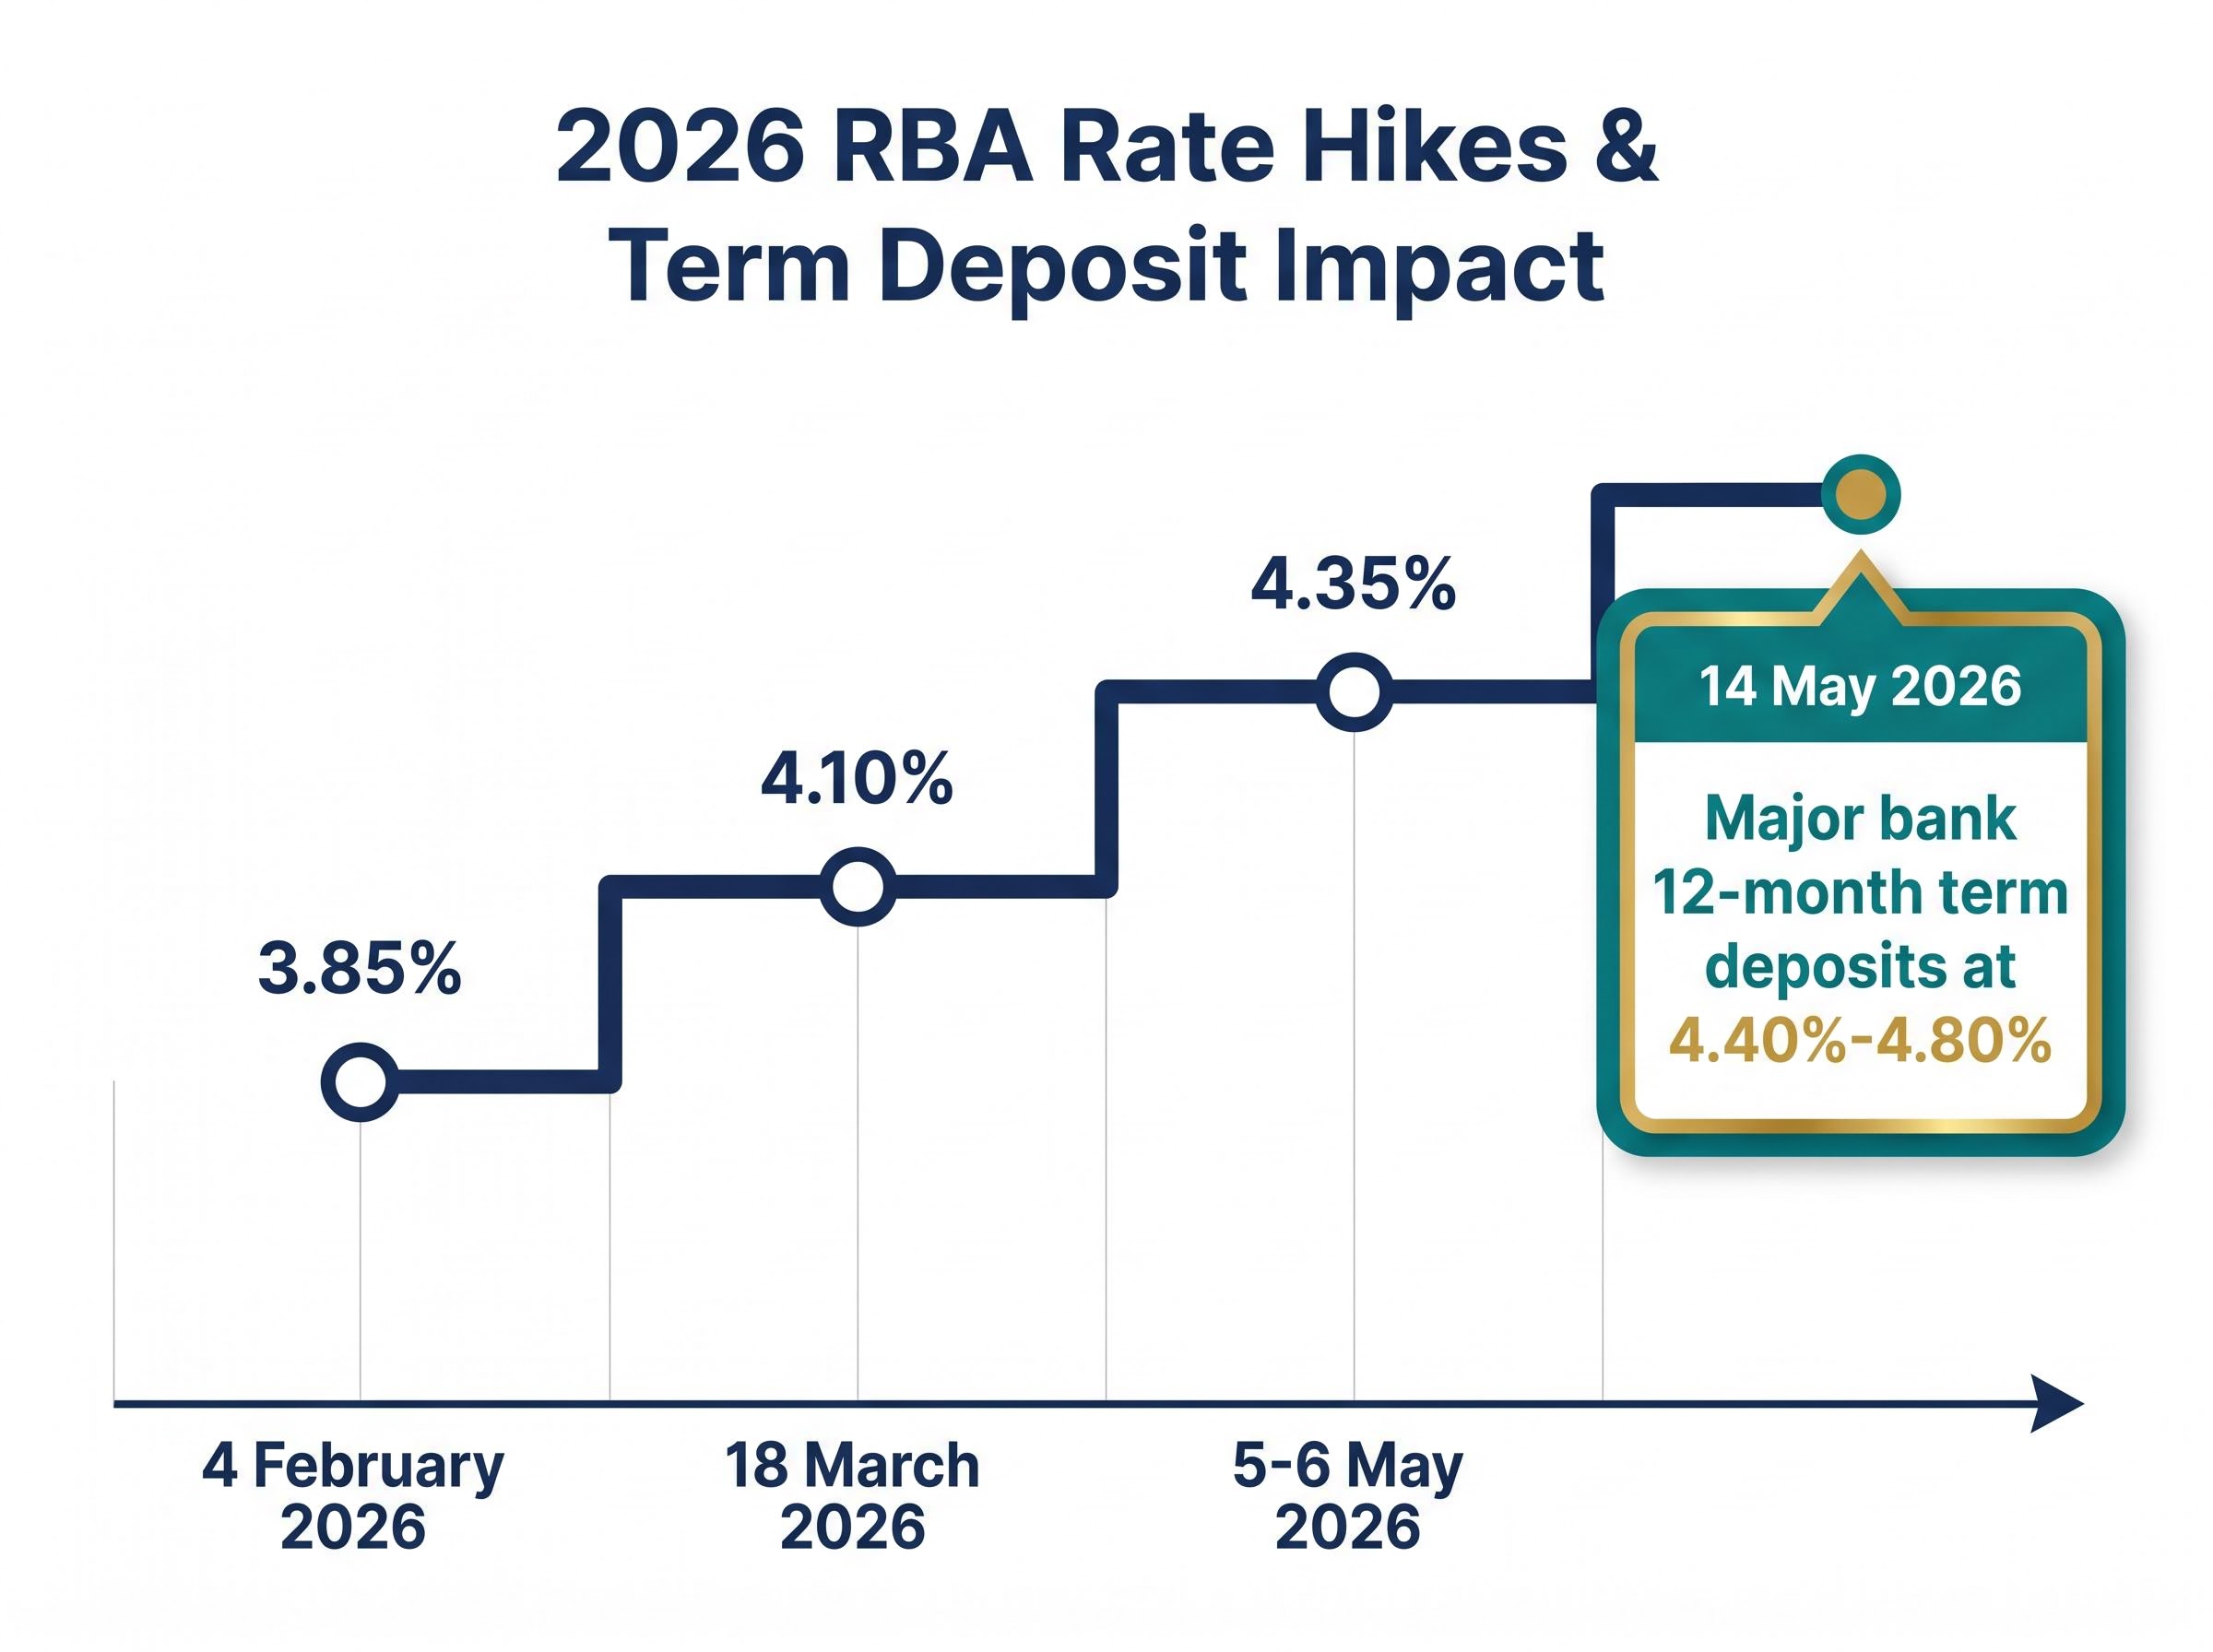
The 4.35% cash rate represents a threshold moment. Major bank 12-month term deposits now sit in the 4.40%-4.80% range as of 14 May 2026, according to Canstar rate comparisons. For the first time since the low-rate era, cash genuinely competes with mid-range dividend yields on a headline basis.
The income investor’s challenge is no longer finding yield above zero. It is finding yield above 4.35% that justifies additional risk and illiquidity.
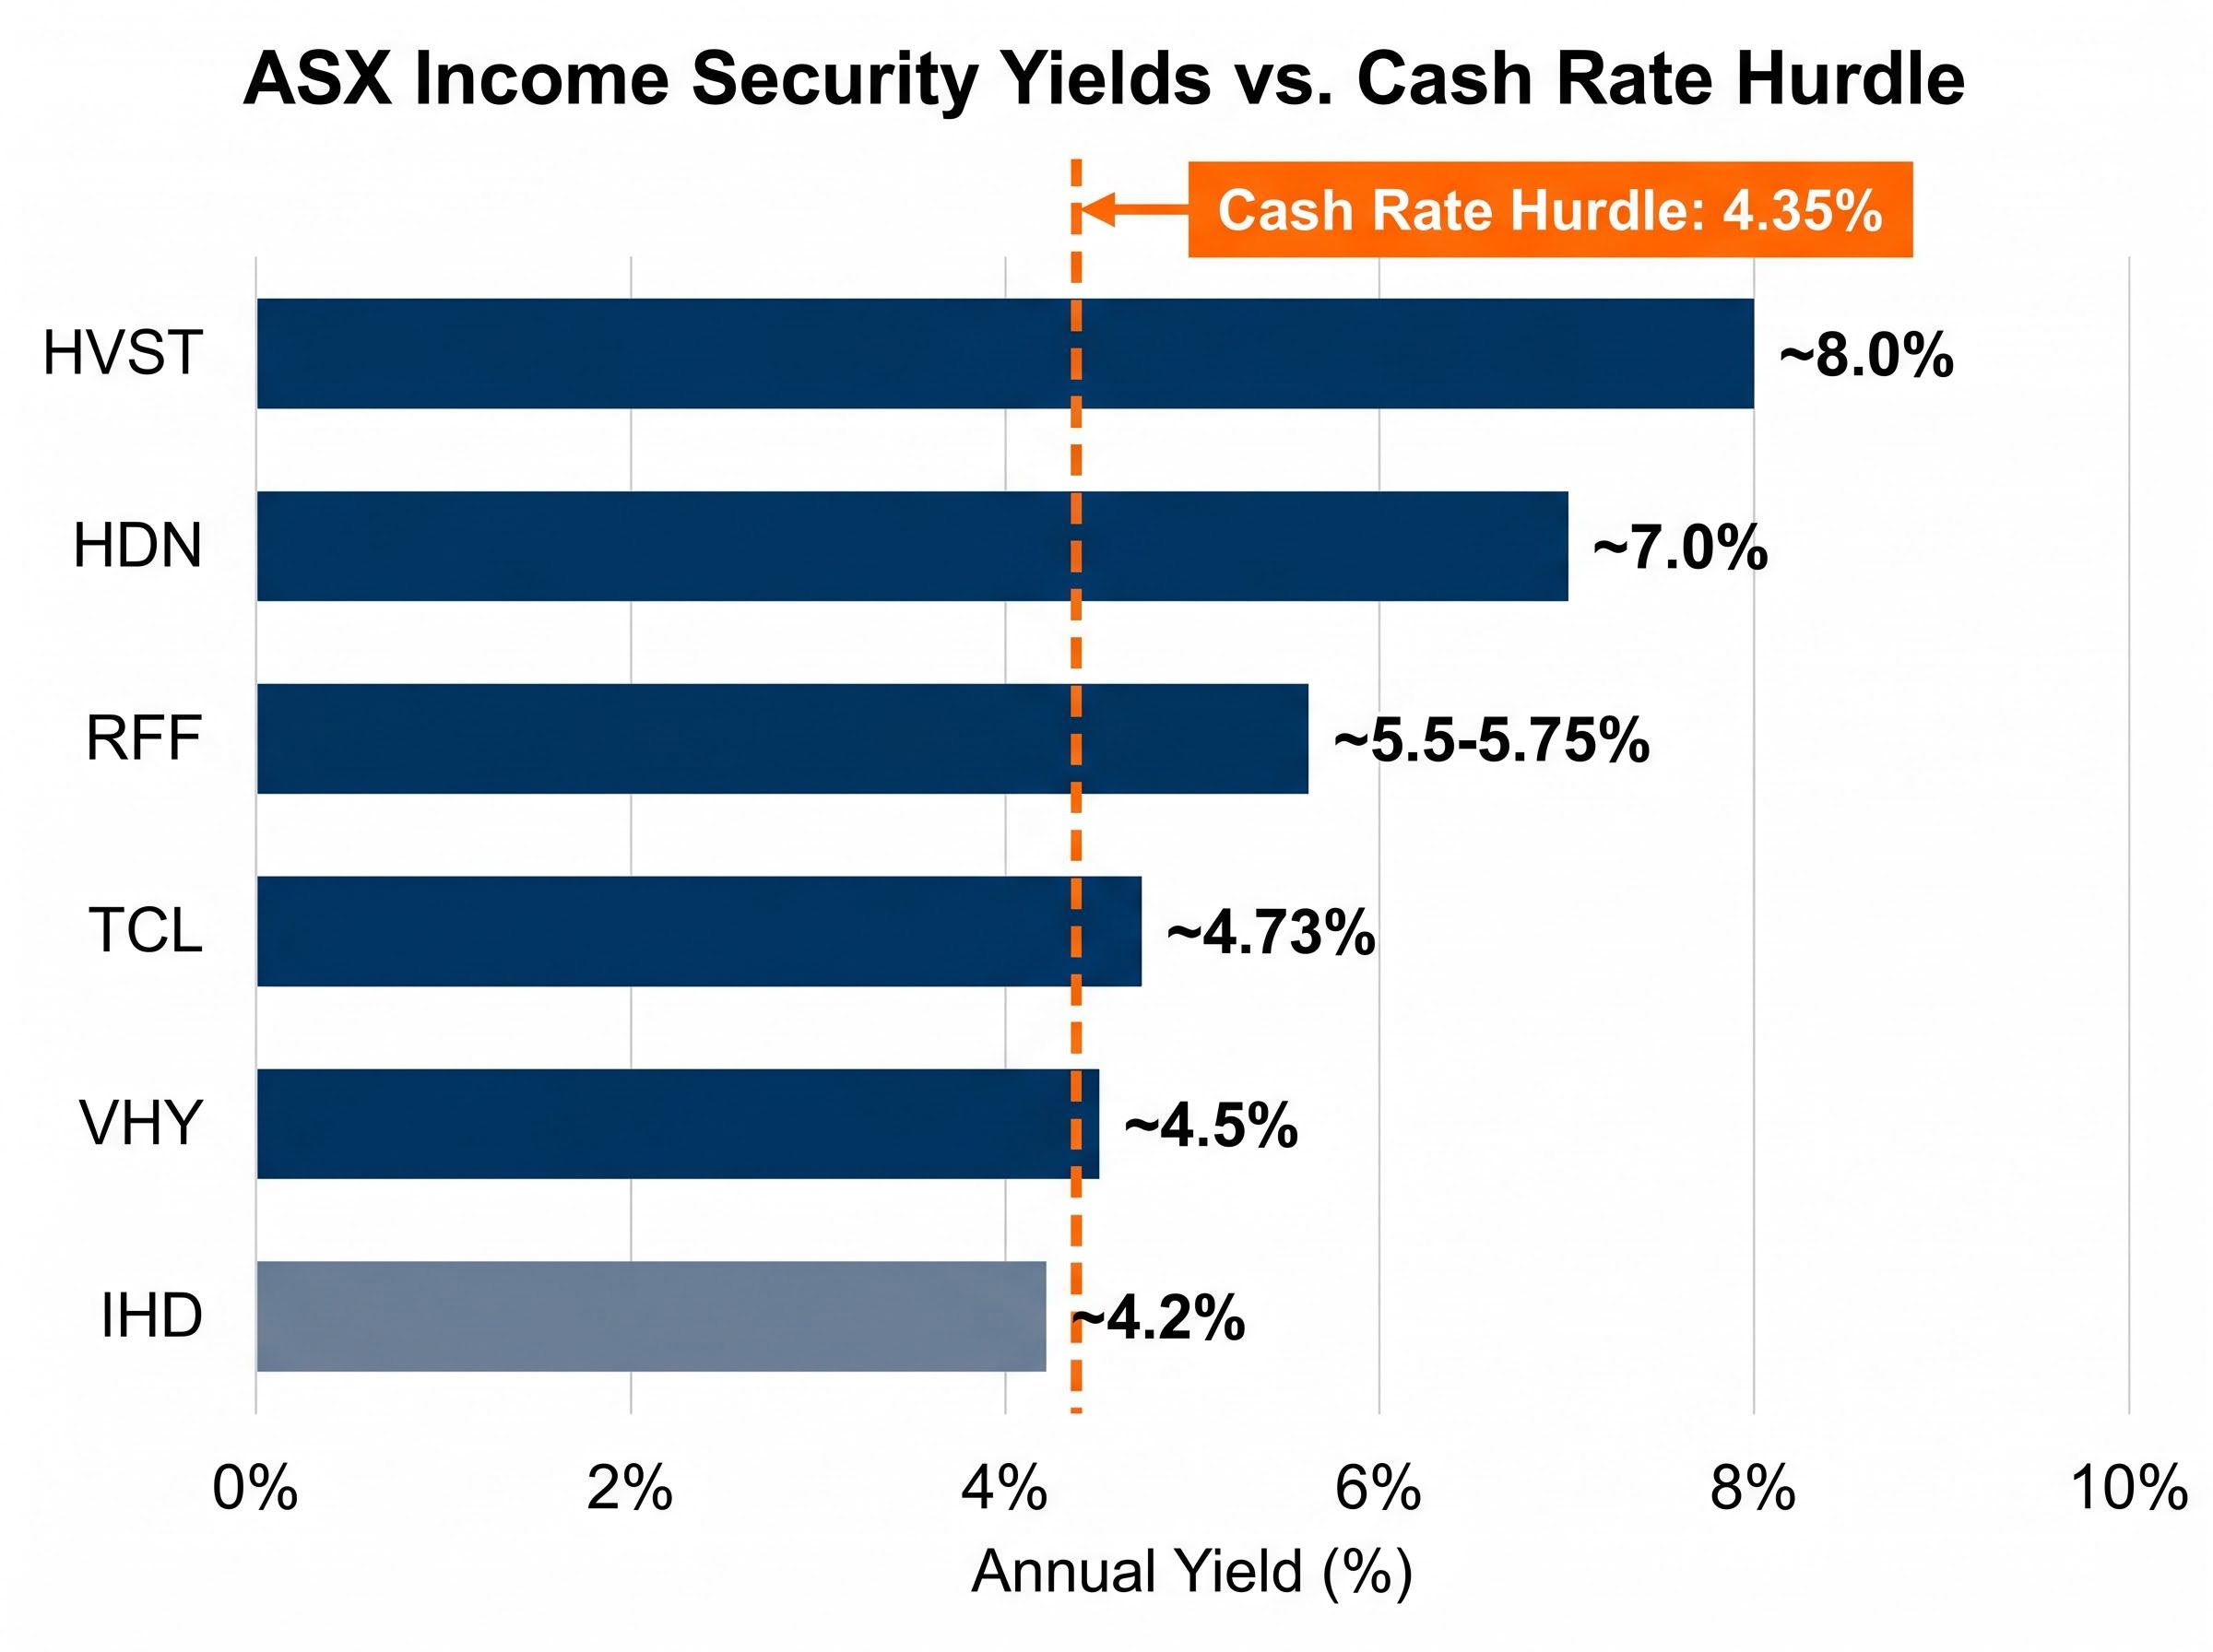
The spread between the cash rate and available ASX income securities ranges from razor-thin to substantial, depending on the security and strategy. The table below maps the current yield landscape against the 4.35% hurdle.
| Security | Type | Approx. FY26/Trailing Yield | Spread Over Cash Rate | Notes |
|---|---|---|---|---|
| HomeCo Daily Needs REIT (HDN) | REIT | ~7.0% | +2.65% | Distribution-focused; higher-yield REIT |
| BetaShares Dividend Harvester (HVST) | Covered-call ETF | ~8.0% | +3.65% | Option overlay caps capital upside |
| Rural Funds Group (RFF) | Agricultural REIT | ~5.5-5.75% | +1.15-1.40% | FY26 forecast ~11.73 cpu |
| Transurban (TCL) | Infrastructure | ~4.73% | +0.38% | FY26 forecast ~69 cpu |
| Vanguard High Yield ETF (VHY) | Broad dividend ETF | ~4.5% | +0.15% | Diversified high-yield ASX equities |
| iShares Dividend Opps ETF (IHD) | Dividend-screened ETF | ~4.2% | -0.15% | Below cash rate on headline basis |
At one end of the spectrum, HDN and RFF offer spreads above cash that provide a meaningful income premium. At the other, IHD sits below the cash rate on a headline basis, and VHY barely clears it. For securities in the lower range, the income case depends almost entirely on franking credits and capital growth to justify the additional risk.
HVST’s approximate 8.0% trailing yield reflects a covered-call option overlay strategy that generates income by selling upside exposure. This is structurally different from pure dividend income and caps the fund’s participation in equity market rallies.
The headline yield comparison between term deposits and dividend shares is structurally misleading for most Australian investors. The reason is franking credits, and the gap they create is wider than many income investors realise.
When an Australian company pays a fully franked dividend, it has already paid 30% corporate tax on the underlying profits. The franking credit attached to the dividend represents that tax already paid. For investors with low or zero marginal tax rates, such as self-managed super funds (SMSFs) in pension phase, that credit is refundable. It adds directly to the after-tax return.
Consider a fully franked 5% dividend yield. Grossed up for the 30% corporate tax rate, the pre-tax equivalent yield rises to approximately 7.14% for a zero-tax SMSF investor. A 4.80% term deposit, by contrast, is simply 4.80% before personal tax. On a like-for-like after-tax basis, the franked dividend delivers materially more income than the deposit, despite appearing only marginally higher on a headline basis.
The franking advantage is not without regulatory complexity. Three developments deserve attention from income investors:
The ATO PCG 2025/3 compliance framework sets out how the regulator will assess franked distributions funded by capital raisings, introducing a risk-tiering approach that distinguishes between arrangements the ATO considers low risk and those it will scrutinise as potential avoidance, with LICs and companies that regularly raise equity to fund dividends falling into higher-risk tiers.
Investors using trust structures should verify their exposure to the proposed changes with a financial adviser before assuming full franking credit access will continue in its current form.
For SMSF trustees and retirees who want to work through the numbers precisely, our dedicated guide to franking credit calculations walks through the 30/70 formula with worked examples, covers the 45-day holding rule exemption thresholds, and explains the PCG 2025/3 implications for equity-raising scenarios.
Once the yield and franking case has been established, the practical question shifts to vehicle selection. Three primary options exist, each with distinct trade-offs.
| Vehicle Type | Yield Predictability | Diversification | Fee Consideration | Key Trade-off |
|---|---|---|---|---|
| Individual Shares | Variable; company-specific | Low unless portfolio is large | Brokerage only | Higher control, higher concentration risk |
| Income ETFs | Moderate; index-driven | High | Management fees (typically 0.25-0.70%) | Diversification and simplicity at the cost of yield control |
| Income LICs | Higher; dividend reserves smooth payments | Moderate to high | Management fees plus potential performance fees | Smoother income, but may trade at discount to NTA |
LICs carry a structural advantage in a volatile rate environment: dividend reserves. Unlike ETFs, which distribute income as it arrives, many income-focused LICs maintain reserves that allow them to smooth distributions even when underlying portfolio income fluctuates. For investors who prioritise income certainty, this feature matters.
Income ETFs remain the default starting point for most investors. VHY offers broad high-yield diversification across the ASX, while HVST takes a fundamentally different approach through its covered-call overlay. The cost and liquidity profile of ETFs makes them the simplest entry into diversified income exposure.
Income ETF total return data reveals a substantial gap between funds that appear similar on a headline yield basis: HVST delivered a five-year annualised return of 8.8% per annum against VHY’s 14.4% per annum as at 31 March 2026, a difference driven by the covered-call overlay’s structural cap on capital participation rather than any difference in underlying income quality.
Sectors most represented across income mandates include:
Single-name concentration carries its own risks. Scentre Group (SCG), for example, has delivered a five-year average annual dividend yield of 4.8%, but its return on equity (ROE) of 1.0% in CY23 and debt-to-equity ratio of 87.3% illustrate how an attractive yield can sit alongside weak underlying returns. Coles (COL), by contrast, has averaged a 3.8% annual dividend yield since 2019 with an ROE of 32.4%, demonstrating how yield and business quality metrics interact differently across names.
A high-rate environment intensifies three specific risks for dividend investors: dividend cuts from leveraged businesses, capital losses in rate-sensitive sectors, and distribution variability from ETF strategies. Building a portfolio that holds up regardless of whether the RBA hikes again or pauses requires a consistent quality screen rather than a bet on a single rate scenario.
High-dividend sector concentration risk materialised in early 2026 when the MSCI World High-Dividend Yield Index fell approximately 7.6% peak to trough while the broader index recovered to all-time highs by mid-April, a divergence explained by the structural overweight to rate-sensitive Financials, Utilities, and Real Estate that routinely make up 65%-85% of high-dividend benchmarks.
The following five-step process offers a framework for stress-testing income holdings:
An ROE above 10% for established businesses provides a baseline quality filter. Securities trading on high headline yields but delivering single-digit returns on equity may be distributing capital rather than genuine earnings.
Cash is now a legitimate tactical allocation. A blended approach that includes a portion in term deposits acknowledges that deposits offer income certainty that no equity can replicate, while dividend securities offer franking and growth that no deposit can match.
The 4.35% cash rate has compressed the spread that dividend investors relied on during the low-rate era. On a headline basis, several broad income ETFs and lower-yielding ASX names barely clear the deposit hurdle. The easy yield advantage is gone.
On a fully grossed-up, after-tax basis, the picture shifts. For SMSF and low-tax investors, a fully franked 5% dividend grosses up to approximately 7.14%, a margin that term deposits cannot approach. Commentary from Australian financial analysts points to yields of 5%-7%+ from ASX 200 names as competitive with deposits and bonds on a total-return basis. The three consecutive hikes have also already priced significant tightening risk into rate-sensitive ASX sectors, potentially creating entry points for long-term income investors.
Term deposits remain a legitimate option for investors who prioritise certainty and have limited appetite for market risk. Their role in a blended income portfolio is stronger today than at any point in the past decade.
The distinction between disciplined income investing and yield-chasing comes down to measuring total return across three dimensions:
Investors who evaluate dividend securities against deposits using only headline yield are making the comparison on incomplete terms. Total return, adjusted for franking and tax status, is the relevant metric.
This article is for informational purposes only and should not be considered financial advice. Investors should conduct their own research and consult with financial professionals before making investment decisions. Past performance does not guarantee future results. Financial projections are subject to market conditions and various risk factors.
Franking credit grossing up converts a franked dividend yield into its pre-tax equivalent, revealing the true after-tax return. For example, a fully franked 5% dividend yield grosses up to approximately 7.14% for a zero-tax SMSF investor, making it far more competitive with term deposits than the headline yield suggests.
As of May 2026, major bank term deposits offer 4.40%-4.80%, meaning several broad income ETFs like VHY (approximately 4.5%) barely clear the cash rate on a headline basis, while higher-yielding securities like HomeCo Daily Needs REIT (approximately 7.0%) and BetaShares Dividend Harvester (approximately 8.0%) offer more substantial spreads above the cash rate hurdle.
Income ETFs distribute income as it arrives and offer high diversification at low cost, while LICs maintain dividend reserves that allow them to smooth distributions across periods of fluctuating portfolio income, making LICs appealing to investors who prioritise payment consistency over simplicity.
The article recommends a five-step process: gross up yields for franking credits, check payout ratio and return on equity (targeting above 10% for established businesses), assess debt levels relative to sector norms, verify long-term dividend history, and diversify across individual shares, ETFs, LICs, and term deposits to reduce dependence on any single income source.
Two key developments apply: ATO PCG 2025/3 (finalised September 2025) introduced a risk-tiering approach for franked distributions funded by capital raisings, and proposed 2026-27 Federal Budget changes could curtail franking credit access for trust structures including family trusts if legislated.